Table of Contents
UNITED STATES
SECURITIES AND EXCHANGE COMMISSION
WASHINGTON, D.C. 20549
FORM 10-K
Annual report pursuant to
section 13 or 15(d) of
The Securities Exchange Act of 1934
| For the fiscal year ended December 31, 2004 |
Commission file number 1-5805 |
JPMorgan Chase & Co.
| Delaware | 13-2624428 | |
| (State or other jurisdiction of incorporation or organization) |
(I.R.S. employer identification no.) |
|
| 270 Park Avenue, New York, NY | 10017 | |
| (Address of principal executive offices) | (Zip code) |
Registrant’s telephone number, including area code: (212) 270-6000
Securities registered pursuant to Section 12(b) of the Act:
Title of each class
Common stock
|
||
Depositary
shares representing a one-tenth interest in 6 5/8%
cumulative preferred stock (stated value—$500) |
||
6.50% subordinated notes due 2005 |
||
6.25% subordinated notes due 2006 |
||
6 1/8% subordinated notes due 2008 |
||
6.75% subordinated notes due 2008 |
||
6.50% subordinated notes due 2009 |
||
Guarantee of 8.25% Capital Securities,
Series H, of Chase Capital VIII |
||
Guarantee of 7.50% Capital Securities, Series I, of
J.P. Morgan Chase Capital IX |
||
Guarantee of 7.00% Capital Securities,
Series J, of J.P. Morgan Chase Capital X |
||
Guarantee of 5 7/8% Capital Securities,
Series K, of J.P. Morgan Chase Capital XI |
||
Guarantee of 6.25% Capital Securities,
Series L, of J.P. Morgan Chase Capital XII |
||
Guarantee of 6.20% Capital
Securities, Series N, of JPMorgan Chase Capital XIV
|
||
Guarantee of 8.50% Preferred Securities of BANK ONE Capital II |
Guarantee of 8.00% Preferred Securities
of BANK ONE Capital V
|
||
Guarantee of 7.20% Preferred Securities of BANK ONE Capital VI |
||
Indexed
Linked Notes on the S&P 500® Index due November 26, 2007 |
||
JPMorgan Market Participation Notes on the S&P
500® Index due March 12, 2008 |
||
Capped Quarterly Observation Notes Linked to S&P
500® Index due September 22, 2008 |
||
Capped Quarterly Observation Notes Linked to S&P
500® Index due October 30, 2008 |
||
Capped Quarterly Observation Notes Linked to S&P
500® Index due January 21, 2009 |
||
JPMorgan Market Participation Notes on the S&P
500® Index due March 31, 2009 |
||
Capped Quarterly Observation Notes Linked to S&P
500® Index due July 7, 2009 |
||
Capped Quarterly Observation Notes Linked to S&P
500® Index due September 21, 2009 |
||
Consumer Price Indexed Securities due January 15, 2010 |
||
Principal Protected Notes Linked to S&P 500® Index due
September 30, 2010 |
The Indexed Linked Notes, JPMorgan Market Participation Notes, Capped Quarterly Observation Notes, Consumer Price
Indexed Securities and Principal Protected Notes are listed on the American Stock Exchange;
all other securities named above are listed on the New York Stock Exchange.
Indicate by check mark whether the Registrant (1) has filed all reports required to be filed by Section 13 or 15(d) of the Securities Exchange Act of 1934 during the preceding 12 months (or for such shorter period that the registrant was required to file such reports), and (2) has been subject to such filing requirements for the past 90 days. Yes ..X.. No.....
Indicate by check mark if disclosure of delinquent filers pursuant to Item 405 of Regulation S-K is not contained herein, and will not be contained, to the best of Registrant’s knowledge, in definitive proxy or information statements incorporated by reference in Part III of this Form 10-K or any amendment to this Form 10-K. [X]
Indicate by check mark whether the Registrant is an accelerated filer (as defined in Rule 12b-2 of the Exchange Act). Yes ..X.. No.....
The aggregate market value of JPMorgan Chase & Co. common stock held by non-affiliates of JPMorgan Chase & Co. on June 30, 2004 was approximately $80,330,277,311.
Document Incorporated by Reference: Portions of Registrant’s proxy statement for the annual meeting of stockholders to be held on May 17, 2005, are incorporated by reference in this Form 10-K in response to Items 10, 11, 12, 13 and 14 of Part III.
Form 10-K Index
Table of Contents
Part I
Item 1: Business
Effective July 1, 2004, Bank One Corporation (“Bank One”) merged with and into JPMorgan Chase & Co. (the “Merger”), pursuant to an Agreement and Plan of Merger dated January 14, 2004. As a result of the Merger, each outstanding share of common stock of Bank One was converted in a stock-for-stock exchange into 1.32 shares of common stock of JPMorgan Chase & Co. (“JPMorgan Chase” or the “Firm”). The Merger was accounted for using the purchase method of accounting. The purchase price to complete the Merger was $58.5 billion.
Bank One’s results of operations were included in the Firm’s results beginning July 1, 2004.
Therefore, the results of operations for the 12 months ended December 31, 2004, reflect six months
of operations of the combined Firm and six months of heritage JPMorgan Chase; the results of
operations for all other periods prior to 2004 reflect only the operations of heritage
JPMorgan Chase.
Overview
JPMorgan Chase is a financial holding company incorporated under Delaware law in 1968. JPMorgan Chase is one of the largest banking institutions in the United States, with $1.2 trillion in assets, $106 billion in stockholders’ equity and operations in more than 50 countries.
JPMorgan Chase’s principal bank subsidiaries are JPMorgan Chase Bank, National Association (“JPMorgan Chase Bank”), a national banking association with branches in 17 states, and Chase Bank USA, National Association (“Chase USA”), a national association that is the Firm’s credit card-issuing bank. JPMorgan Chase’s principal nonbank subsidiary is J.P. Morgan Securities Inc. (“JPMSI”), its U.S. investment banking firm. The bank and nonbank subsidiaries of JPMorgan Chase operate nationally as well as through overseas branches and subsidiaries, representative offices and affiliated banks.
The Firm’s website is www.jpmorganchase.com. JPMorgan Chase makes available free of charge, through its website, annual reports on Form 10-K, quarterly reports on Form 10-Q and current reports on Form 8-K, and any amendments to those reports filed or furnished, pursuant to Section 13(a) or Section 15(d) of the Securities Exchange Act of 1934, as soon as reasonably practicable after it electronically files such material with, or furnishes such material to, the Securities and Exchange Commission (the “SEC”). The Firm has adopted, and posted on its website, a Code of Ethics for its Chief Executive Officer, President and Chief Operating Officer, Chief Financial Officer, Chief Accounting Officer and other senior financial officers.
Business segments
JPMorgan Chase’s activities are organized, for management reporting purposes, into six business segments (Investment Bank, Retail Financial Services, Card Services, Commercial Banking, Treasury & Securities Services and Asset & Wealth Management) and Corporate, which includes its Private Equity and Treasury businesses, as well as corporate support functions. A description of the Firm’s business segments and the products and services they provide to their respective client bases is provided in the “Business segment results” section of Management’s discussion and analysis (“MD&A”) beginning on page 28, and in Note 31 on page 126.
Competition
JPMorgan Chase and its subsidiaries and affiliates operate in a highly competitive environment. Competitors include other banks, brokerage firms, investment banking companies, merchant banks, insurance companies, mutual fund companies, credit card companies, mortgage banking
companies, automobile financing companies, leasing companies, e-commerce and other Internet-based companies, and a variety of other financial services and advisory companies. JPMorgan Chase’s businesses compete with these other firms with respect to the range of products and services offered and the types of clients, customers, industries and geographies served. With respect to some of its geographies and products, JPMorgan Chase competes globally; with respect to others, the Firm competes on a regional basis. JPMorgan Chase’s ability to compete effectively depends on the relative performance of its products, the degree to which the features of its products appeal to customers, and the extent to which the Firm is able to meet its clients’ objectives or needs. The Firm’s ability to compete also depends on its ability to attract and retain its professional and other personnel, and on its reputation.
The financial services industry has experienced consolidation and convergence in recent years, as financial institutions involved in a broad range of financial products and services have merged. This convergence trend is expected to continue, as demonstrated by the merger of JPMorgan Chase and Bank One Corporation on July 1, 2004. Consolidation could result in competitors of JPMorgan Chase gaining greater capital and other resources, such as a broader range of products and services and geographic diversity. It is possible that competition will become even more intense as the Firm continues to compete with other financial institutions that may be larger or better capitalized, or that may have a stronger local presence in certain geographies.
Supervision and regulation
Permissible business activities: The Firm is subject to regulation under state and federal law, including the Bank Holding Company Act of 1956, as amended (the “BHCA”).
Under the 1999 Gramm-Leach-Bliley Act (“GLBA”), bank holding companies meeting certain eligibility criteria may elect to become “financial holding companies,” which may engage in activities that have been approved by the Board of Governors of the Federal Reserve System (the “Federal Reserve Board”) and the United States Department of the Treasury (“U.S. Treasury Department”). JPMorgan Chase elected to become a financial holding company as of March 13, 2000.
Under regulations implemented by the Federal Reserve Board, if any depository institution controlled by a financial holding company ceases to meet certain capital or management standards, the Federal Reserve Board may impose corrective capital and/or managerial requirements on the financial holding company and place limitations on its ability to conduct the broader financial activities permissible for financial holding companies. In addition, the Federal Reserve Board may require divestiture of the holding company’s depository institutions if the deficiencies
1
Table of Contents
Part I
persist. The regulations also provide that if any depository institution controlled by a financial holding company fails to maintain a satisfactory rating under the Community Reinvestment Act (“CRA”), the Federal Reserve Board must prohibit the financial holding company and its subsidiaries from engaging in any additional activities other than those permissible for bank holding companies that are not financial holding companies. At December 31, 2004, the depository-institution subsidiaries of JPMorgan Chase met the capital, management and CRA requirements necessary to permit the Firm to conduct the broader activities permitted under GLBA. However, there can be no assurance that this will continue to be the case in the future.
Regulation by Federal Reserve Board under GLBA: Under GLBA’s system of “functional regulation,” the Federal Reserve Board acts as an “umbrella regulator,” and certain of JPMorgan Chase’s subsidiaries are regulated directly by additional authorities based on the particular activities of those subsidiaries (e.g., the lead bank is regulated by the Office of the Comptroller of the Currency (“OCC”), securities and investment advisory activities are regulated by the SEC, and insurance activities are regulated by state insurance commissioners).
Dividend restrictions: Federal law imposes limitations on the payment of dividends by the subsidiaries of JPMorgan Chase that are national banks. Nonbank subsidiaries of JPMorgan Chase are not subject to those limitations. The amount of dividends that may be paid by national banks, such as JPMorgan Chase Bank and Chase USA, is limited to the lesser of the amounts calculated under a “recent earnings” test and an “undivided profits” test. Under the recent earnings test, a dividend may not be paid if the total of all dividends declared by a bank in any calendar year is in excess of the current year’s net income combined with the retained net income of the two preceding years, unless the national bank obtains the approval of the Comptroller of the Currency. Under the undivided profits test, a dividend may not be paid in excess of a bank’s “undivided profits.” See Note 23 on page 116 for the amount of dividends that the Firm’s principal bank subsidiaries could pay, at January 1, 2005 and 2004, to their respective bank holding companies without the approval of the relevant banking regulators.
In addition to the dividend restrictions described above, the Comptroller of the Currency, the Federal Reserve Board and the Federal Deposit Insurance Corporation (the “FDIC”) have authority to prohibit or to limit the payment of dividends by the banking organizations they supervise, including JPMorgan Chase and its bank and bank holding company subsidiaries, if, in the banking regulator’s opinion, payment of a dividend would constitute an unsafe or unsound practice in light of the financial condition of the banking organization.
Capital requirements: Federal banking regulators have adopted risk-based capital and leverage guidelines that require the Firm’s capital-to-assets ratios to meet certain minimum standards.
The risk-based capital ratio is determined by allocating assets and specified off-balance sheet financial instruments into four weighted categories, with higher levels of capital being required for the categories perceived as representing greater risk. Under the guidelines, capital is divided into two tiers: Tier 1 capital and Tier 2 capital. The amount of Tier 2 capital may not exceed the amount of Tier 1 capital. Total capital is the sum of Tier 1 capital and Tier 2 capital. Under the guidelines, banking organizations are required to maintain a Total capital ratio (total capital to risk-weighted assets) of 8% and a Tier 1 capital ratio of 4%.
Tier 1 components: Capital surplus and common stock remain the most important forms of capital at JPMorgan Chase. Because common equity has no maturity date, and because dividends on common stock are paid only
when and if declared by the Board of Directors, common equity is available to absorb losses over long periods of time. Noncumulative perpetual preferred stock is similar to common stock in its ability to absorb losses. If the Board of Directors does not declare a dividend on noncumulative perpetual preferred stock in any dividend period, the holders of the instrument are never entitled to receive that dividend payment. JPMorgan Chase’s outstanding noncumulative perpetual preferred stock is a type commonly referenced as a “FRAP”: a fixed-rate/ adjustable preferred stock. Because the interest rate on FRAPs may increase (up to a predetermined ceiling), the Federal Reserve Board treats the Firm’s noncumulative FRAPs in a manner similar to cumulative perpetual preferred securities. The Federal Reserve Board permits cumulative perpetual preferred securities to be included in Tier 1 capital but only up to certain limits, as these financial instruments do not provide as strong protection against losses as common equity and noncumulative, non-FRAP securities. Cumulative perpetual preferred stock does not have a maturity date, similar to other forms of Tier 1 capital. However, any dividends not declared on cumulative perpetual preferred stock accumulate and thus continue to be due to the holder of the instrument until all arrearages are satisfied. On March 1, 2005, the Federal Reserve Board issued a final rule that continues the inclusion of trust preferred securities in Tier 1 capital, subject to stricter quantitative limits. The rule provides for a five-year transition period. The Firm is currently assessing the impact of the final rule. The effective date of the final rule is dependent on the date of publication in the Federal Register. Trust preferred securities are generally issued by a special-purpose trust established and owned by JPMorgan Chase. Proceeds from the issuance to the public of the trust preferred security are lent to the Firm for at least 30 (but not more than 50) years. The intercompany note that evidences this loan provides that the interest payments by JPMorgan Chase on the note may be deferred for up to five years. During the period of any such deferral, no payments of dividends may be made on any outstanding JPMorgan Chase preferred or common stock or on the outstanding trust preferred securities issued to the public. During 2003, the Firm implemented Financial Accounting Standards Board (“FASB”) Interpretation No. 46, Consolidation of Variable Interest Entities (“FIN 46”), which addresses the consolidation rules to be applied to entities defined in FIN 46 as “variable interest entities.” Prior to FIN 46, trusts that issued trust preferred securities were consolidated subsidiaries of their respective parents. As a result of FIN 46, JPMorgan Chase is no longer permitted to consolidate these trusts. Tier 2 components: Long-term subordinated debt (generally having an original maturity of 10-12 years) is the primary form of JPMorgan Chase’s Tier 2 capital. Subordinated debt is deemed a form of regulatory capital, because payments on the debt are subordinated to other creditors of JPMorgan Chase, including holders of senior and medium long-term debt and counterparties on derivative contracts.
The federal banking regulators have also established minimum leverage ratio guidelines. The
leverage ratio is defined as Tier 1 capital divided by average total assets (net of the allowance
for loan losses, goodwill and certain intangible assets). The minimum leverage ratio is 3% for bank
holding companies that are considered “strong” under Federal Reserve Board guidelines or
which have implemented the Federal Reserve Board’s risk-based capital measure for market risk.
Other bank holding companies must have a minimum leverage ratio of 4%. Bank holding companies may
be expected to maintain ratios well above the minimum levels, depending upon their particular
condition, risk profile and growth plans.
2
Table of Contents
The risk-based capital requirements explicitly identify concentrations of credit risk, certain risks arising from non-traditional banking activities, and the management of those risks as important factors to consider in assessing an institution’s overall capital adequacy. Other factors taken into consideration by federal regulators include: interest rate exposure; liquidity, funding and market risk; the quality and level of earnings; the quality of loans and investments; the effectiveness of loan and investment policies; and management’s overall ability to monitor and control financial and operational risks, including the risks presented by concentrations of credit and non-traditional banking activities. In addition, the risk-based capital rules incorporate a measure for market risk in foreign exchange and commodity activities and in the trading of debt and equity instruments. The market risk-based capital rules require banking organizations with large trading activities (such as JPMorgan Chase) to maintain capital for market risk in an amount calculated by using the banking organizations’ own internal Value-at-Risk models (subject to parameters set by the regulators).
The minimum risk-based capital requirements adopted by the federal banking agencies follow the Capital Accord of the Basel Committee on Banking Supervision. The Basel Committee has proposed a revision to the Accord (“Basel II”). JPMorgan Chase is actively pursuing implementation of the Basel II framework in accordance with the criteria of the U.S. banking regulators, which will require JPMorgan Chase to use “advanced measurement techniques,” employing its internal estimates of certain key risk drivers to derive capital requirements. Implementation of Basel II by U.S. regulators is expected as of January 1, 2008, with certain transitional implementation arrangements.
FDICIA: The Federal Deposit Insurance Corporation Improvement Act of 1991 (“FDICIA”) provides a framework for regulation of depository institutions and their affiliates, including parent holding companies, by their federal banking regulators; among other things, it requires the relevant federal banking regulator to take “prompt corrective action” with respect to a depository institution if that institution does not meet certain capital adequacy standards.
Supervisory actions by the appropriate federal banking regulator under the “prompt corrective action” rules generally depend upon an institution’s classification within five capital categories. The regulations apply only to banks and not to bank holding companies such as JPMorgan Chase; however, subject to limitations that may be imposed pursuant to GLBA, as described below, the Federal Reserve Board is authorized to take appropriate action at the holding company level, based on the undercapitalized status of the holding company’s subsidiary banking institutions. In certain instances relating to an undercapitalized banking institution, the bank holding company would be required to guarantee the performance of the undercapitalized subsidiary and might be liable for civil money damages for failure to fulfill its commitments on that guarantee.
As of December 31, 2004, the Firm and its primary banking subsidiaries were “well-capitalized.”
FDIC Insurance Assessments: FDICIA also requires the FDIC to establish a risk-based assessment system for FDIC deposit insurance. Under the FDIC’s risk-based insurance premium assessment system, each depository institution is assigned to one of nine risk classifications based upon certain capital and supervisory measures and, depending upon its classification, is assessed insurance premiums on its deposits.
Powers of the FDIC upon insolvency of an insured depository institution: An FDIC-insured depository institution can be held liable for any loss incurred or expected to be incurred by the FDIC in connection with another FDIC-insured institution under common control, with such institution being “in default” or “in danger of default” (commonly referred to as “cross-guarantee” liability). An FDIC cross-guarantee claim against a depository institution is generally superior in right of payment to claims of the holding company and its affiliates against such depository institution.
If the FDIC is appointed the conservator or receiver of an insured depository institution upon its insolvency or in certain other events, the FDIC has the power: (1) to transfer any of the depository institution’s assets and liabilities to a new obligor without the approval of the depository institution’s creditors; (2) to enforce the terms of the depository institution’s contracts pursuant to their terms; or (3) to repudiate or disaffirm any contract or lease to which the depository institution is a party, the performance of which is determined by the FDIC to be burdensome and the disaffirmation or repudiation of which is determined by the FDIC to promote the orderly administration of the depository institution. The above provisions would be applicable to obligations and liabilities of those of JPMorgan Chase’s subsidiaries that are insured depository institutions, such as JPMorgan Chase Bank and Chase USA, including, without limitation, obligations under senior or subordinated debt issued by those banks to investors (referenced below as “public noteholders”) in the public markets.
Under federal law, the claims of a receiver of an insured depository institution for administrative expenses and the claims of holders of U.S. deposit liabilities (including the FDIC, as subrogee of the depositors) have priority over the claims of other unsecured creditors of the institution, including public noteholders, in the event of the liquidation or other resolution of the institution. As a result, whether or not the FDIC would ever seek to repudiate any obligations held by public noteholders of any subsidiary of the Firm that is an insured depository institution, such as JPMorgan Chase Bank or Chase USA, the public noteholders would be treated differently from, and could receive, if anything, substantially less than, the depositors of the depository institution.
The USA PATRIOT Act: On October 26, 2001, President Bush signed into law The USA PATRIOT Act of 2001 (the “Act”).
The Act substantially broadens existing anti-money laundering legislation and the extraterritorial jurisdiction of the United States; imposes new compliance and due diligence obligations; creates new crimes and penalties; compels the production of documents located both inside and outside the United States, including those of non-U.S. institutions that have a correspondent relationship in the United States; and clarifies the safe harbor from civil liability to customers. The Act mandates the U.S. Treasury Department to issue a number of regulations to further clarify the Act’s requirements or provide more specific guidance on their application.
The Act requires all “financial institutions,” as defined, to establish certain anti-money laundering compliance and due diligence programs. The Act requires financial institutions that maintain correspondent accounts for non-U.S. institutions, or persons that are involved in private banking for “non-United States persons” or their representatives, to establish “appropriate, specific and, where necessary, enhanced due diligence policies, procedures, and controls that are reasonably designed to detect and report instances of money laundering through those accounts.”
3
Table of Contents
Part I
JPMorgan Chase believes its programs satisfy the requirements of the Act. Bank regulators are focusing their examinations on anti-money laundering compliance, and JPMorgan Chase continues to enhance its anti-money laundering compliance programs.
Other supervision and regulation: Under current Federal Reserve Board policy, JPMorgan Chase is expected to act as a source of financial strength to its bank subsidiaries and to commit resources to support the bank subsidiaries in circumstances where it might not do so absent such policy. However, because GLBA provides for functional regulation of financial holding company activities by various regulators, GLBA prohibits the Federal Reserve Board from requiring payment by a holding company or subsidiary to a depository institution if the functional regulator of the payor objects to such payment. In such a case, the Federal Reserve Board could instead require the divestiture of the depository institution and impose operating restrictions pending the divestiture.
Any loans by a bank holding company to any of its subsidiary banks are subordinate in right of payment to deposits and certain other indebtedness of the subsidiary banks. In the event of a bank holding company’s bankruptcy, any commitment by the bank holding company to a federal bank regulatory agency to maintain the capital of a subsidiary bank at a certain level would be assumed by the bankruptcy trustee and entitled to a priority of payment.
The bank subsidiaries of JPMorgan Chase are subject to certain restrictions imposed by federal law on extensions of credit to, and certain other transactions with, the Firm and certain other affiliates, and on investments in stock or securities of JPMorgan Chase and those affiliates. These restrictions prevent JPMorgan Chase and other affiliates from borrowing from a bank subsidiary unless the loans are secured in specified amounts.
The Firm’s bank and certain of its nonbank subsidiaries are subject to direct supervision and regulation by various other federal and state authorities (some of which are considered “functional regulators” under GLBA). JPMorgan Chase’s national bank subsidiaries, such as JPMorgan Chase Bank and Chase USA, are subject to supervision and regulation by the OCC and, in certain matters, by the Federal Reserve Board and the FDIC. Supervision and regulation by the responsible regulatory agency generally includes comprehensive annual reviews of all major aspects of the relevant bank’s business and condition, as well as the imposition of periodic reporting requirements and limitations on investments and other powers. The Firm also conducts securities underwriting, dealing and brokerage activities through JPMSI and other broker-dealer subsidiaries, all of which are subject to the regulations of the SEC and the National Association of Securities Dealers, Inc. (“NASD”). JPMSI is a member of the New York Stock Exchange (“NYSE”). The operations of JPMorgan Chase’s mutual funds also are subject to regulation by the SEC. The types of activities in which the non-U.S. branches of JPMorgan Chase Bank and the international subsidiaries of JPMorgan Chase may engage are subject to various restrictions imposed by the Federal Reserve Board. Those non-U.S. branches and international subsidiaries also are subject to the laws and regulatory authorities of the countries in which they operate.
The activities of JPMorgan Chase Bank and Chase USA as consumer lenders also are subject to regulation under various federal laws, including the Truth-in-Lending, the Equal Credit Opportunity, the Fair Credit Reporting, the Fair Debt Collection Practice and the Electronic Funds Transfer acts, as well as various state laws. These statutes impose
requirements on the making, enforcement and collection of consumer loans and on the types of disclosures that need to be made in connection with such loans.
In addition, under the requirements imposed by GLBA, JPMorgan Chase and its subsidiaries are required periodically to disclose to their retail customers the Firm’s policies and practices with respect to (1) the sharing of non-public customer information with JPMorgan Chase affiliates and others; and (2) the confidentiality and security of that information. Under GLBA, retail customers also must be given the opportunity to “opt out” of information-sharing arrangements with non-affiliates, subject to certain exceptions set forth in GLBA.
Important factors that may affect future results
From time to time, the Firm has made and will make forward-looking statements. These statements can be identified by the fact that they do not relate strictly to historical or current facts. Forward-looking statements often use words such as “anticipate,” “target,” “expect,” “estimate,” “intend,” “plan,” “goal,” “believe” or other words of similar meaning. Forward-looking statements provide JPMorgan Chase’s current expectations or forecasts of future events, circumstances or results. JPMorgan Chase’s disclosures in this report, including in the MD&A section, contain forward-looking statements. The Firm also may make forward-looking statements in its other documents filed with the SEC and in other written materials. In addition, the Firm’s senior management may make forward-looking statements orally to analysts, investors, representatives of the media and others.
Any forward-looking statements made by or on behalf of the Firm speak only as of the date they are made. JPMorgan Chase does not undertake to update forward-looking statements to reflect the impact of circumstances or events that arise after the date the forward-looking statement was made. The reader should, however, consult any further disclosures of a forward-looking nature JPMorgan Chase may make in its Annual Reports on Form 10-K, its Quarterly Reports on Form 10-Q and its Current Reports on Form 8-K.
All forward-looking statements, by their nature, are subject to risks and uncertainties. JPMorgan Chase’s actual future results may differ materially from those set forth in its forward-looking statements. Factors that might cause the Firm’s future financial performance to vary from that described in its forward-looking statements include the credit, market, operational, liquidity, interest rate and other risks discussed in the MD&A section of this report and in other periodic reports filed with the SEC. In addition, the following discussion sets forth certain risks and uncertainties that the Firm believes could cause its actual future results to differ materially from expected results. However, other factors besides those listed below or discussed in JPMorgan Chase’s reports to the SEC also could adversely affect the Firm’s results, and the reader should not consider any such list of factors to be a complete set of all potential risks or uncertainties. This discussion is provided as permitted by the Private Securities Litigation Reform Act of 1995.
Merger of JPMorgan Chase and Bank One. There are significant risks and uncertainties associated
with the Firm’s merger with Bank One. For example, JPMorgan Chase may fail to realize the growth
opportunities and cost savings anticipated to be derived from the merger. In addition, it is
possible that the integration process could result in the loss of
4
Table of Contents
key employees, or that the disruption of ongoing business from the Merger could adversely affect JPMorgan Chase’s ability to maintain relationships with clients or suppliers.
Business conditions and general economy. The profitability of JPMorgan Chase’s businesses could be affected by general economic conditions in the United States or abroad. In 2004 both the U.S. and global economies continued to strengthen overall. While the outlook for the Firm for 2005 continues to be cautiously optimistic, there can be no assurances that the economic recovery that began in 2003 will continue throughout 2005.
Factors such as the liquidity of the global financial markets, the level and volatility of equity prices and interest rates, investor sentiment, inflation, and the availability and cost of credit could significantly affect the activity level of clients, with respect to size, number and timing of transactions involving the Firm’s investment banking business, including its underwriting and advisory businesses. These factors also may affect the realization of cash returns from the Firm’s private equity business. A recurrence of a market downturn would likely lead to a decline in the volume of transactions that the Firm executes for its customers and, therefore, lead to a decline in the revenues it receives from trading commissions and spreads. Higher interest rates or continued weakness in the market also could affect the willingness of financial investors to participate in loan syndications or underwritings managed by JPMorgan Chase. The Firm generally maintains large trading portfolios in the fixed income, currency, commodity and equity markets and has significant investment positions, including merchant banking investments held by its private equity business. The revenues derived from mark-to-market values of the Firm’s business are affected by many factors, including its credit standing; its success in proprietary positioning; volatility in interest rates and in equity and debt markets; and the economic, political and business factors described below. JPMorgan Chase anticipates that these revenues will fluctuate over time.
The fees JPMorgan Chase earns for managing assets are also dependent upon general economic conditions. For example, a higher level of U.S. or non-U.S. interest rates or a downturn in trading markets could affect the valuations of the mutual funds managed by the Firm, which, in turn, could affect the Firm’s revenues. Moreover, even in the absence of a market downturn, below-market performance by JPMorgan Chase’s mutual funds could result in outflows of assets under management and, therefore, reduce the fees the Firm receives.
The credit quality of JPMorgan Chase’s on-balance sheet and off-balance sheet assets may be affected by business conditions. In a poor economic environment there is a greater likelihood that more of the Firm’s customers or counterparties could become delinquent on their loans or other obligations to JPMorgan Chase, which, in turn, could result in a higher levels of charge-offs and provision for credit losses, all of which would adversely affect the Firm’s earnings.
The Firm’s consumer businesses are particularly affected by domestic economic conditions, including U.S. interest rates, the rate of unemployment, the level of consumer confidence, changes in consumer spending and the number of personal bankruptcies, as these factors will affect the level of consumer loans and credit quality.
Competition. JPMorgan Chase operates in a highly competitive environment and expects various factors to cause competitive conditions to continue to intensify. The Firm expects competition to intensify as continued merger activity in the financial services industry produces larger,
better-capitalized companies that are capable of offering a wider array of financial products and services, and at more competitive prices. In addition, technological advances and the growth of e-commerce have made it possible for non-depository institutions to offer products and services that traditionally were banking products, and for financial institutions to compete with technology companies in providing electronic and Internet-based financial solutions.
Non-U.S. operations; trading in non-U.S. securities. The Firm does business throughout the world, including in developing regions of the world commonly known as emerging markets. JPMorgan Chase’s businesses and revenues derived from non-U.S. operations are subject to risk of loss from unfavorable political and diplomatic developments, currency fluctuations, social instability, changes in governmental policies or policies of central banks, expropriation, nationalization, confiscation of assets and changes in legislation relating to non-U.S. ownership. JPMorgan Chase also invests in the securities of corporations located in non-U.S. jurisdictions, including emerging markets. Revenues from the trading of non-U.S. securities also may be subject to negative fluctuations as a result of the above factors. The impact of these fluctuations could be accentuated, because generally, non-U.S. trading markets, particularly in emerging market countries, are smaller, less liquid and more volatile than U.S. trading markets.
Operational risk. JPMorgan Chase, like all large corporations, is exposed to many types of operational risk, including the risk of fraud by employees or outsiders, unauthorized transactions by employees or operational errors, including clerical or record-keeping errors or those resulting from faulty or disabled computer or telecommunications systems. Given the high volume of transactions at JPMorgan Chase, certain errors may be repeated or compounded before they are discovered and successfully rectified. In addition, the Firm’s necessary dependence upon automated systems to record and process its transaction volume may further increase the risk that technical system flaws or employee tampering or manipulation of those systems will result in losses that are difficult to detect. The Firm may also be subject to disruptions of its operating systems, arising from events that are wholly or partially beyond its control (including, for example, computer viruses or electrical or telecommunications outages), which may give rise to losses in service to customers and to loss or liability to the Firm. The Firm is further exposed to the risk that its external vendors may be unable to fulfill their contractual obligation to the Firm (or will be subject to the same risk of fraud or operational errors by their respective employees as is the Firm), and to the risk that the Firm’s (or its vendors’) business continuity and data security systems prove not to be sufficiently adequate. The Firm also faces the risk that the design of its controls and procedures prove inadequate or are circumvented, thereby causing delays in detection or errors in information. Although the Firm maintains a system of controls designed to keep operational risk at appropriate levels, there can be no assurance that JPMorgan Chase will not suffer losses from operational risks in the future that may be material in amount.
Government monetary policies and economic controls. JPMorgan Chase’s businesses and earnings are affected by general economic conditions, both domestic and international. The Firm’s businesses and earnings also are affected by the fiscal or other policies that are adopted by various regulatory authorities of the United States, non-U.S. governments and international agencies. For example, policies and regulations of the Federal Reserve Board influence, directly and indirectly, the rate of interest paid by commercial banks on their interest-bearing deposits and also
5
Table of Contents
Part I
may affect the value of financial instruments held by the Firm. The actions of the Federal Reserve Board also determine to a significant degree the Firm’s cost of funds for lending and investing. The nature and impact of future changes in economic and market conditions and fiscal policies are uncertain and are beyond the Firm’s control. In addition, these policies and conditions can affect the Firm’s customers and counterparties, both in the United States and abroad, which may increase the risk that such customers or counterparties default on their obligations to JPMorgan Chase.
Reputational and legal risk. The Firm’s ability to attract and retain customers and employees could be adversely affected to the extent its reputation is damaged. The failure of the Firm to deal, or to appear to fail to deal, with various issues that could give rise to reputational risk could cause harm to the Firm and its business prospects. These issues include, but are not limited to, appropriately dealing with potential conflicts of interest; legal and regulatory requirements; ethical issues; money-laundering; privacy; record-keeping; sales and trading practices; and the proper identification of the legal, reputational, credit, liquidity and market risks inherent in its products. Failure to address appropriately these issues could also give rise to additional legal risk to the Firm, which, in turn, could increase the size and number of litigation claims and damages asserted against the Firm or subject the Firm to enforcement actions, fines and penalties.
Credit, market, liquidity and private equity risk. JPMorgan Chase’s revenues also are dependent upon the extent to which management can successfully achieve its business strategies within a disciplined risk environment. JPMorgan Chase’s ability to grow its businesses is affected by pricing and competitive pressures, as well as by the costs associated with the introduction of new products and services and the expansion and development of new distribution channels. To the extent any of the instruments and strategies the Firm uses to hedge or otherwise manage its exposure to market, credit and private equity risk are not effective, the Firm may not be able to mitigate effectively its risk exposures in particular market environments or against particular types of risk. The Firm’s balance sheet growth will be dependent upon the economic conditions described above, as well as on its determination to securitize, sell, purchase or syndicate particular loans or loan portfolios. The Firm’s trading revenues and interest rate risk are dependent upon its ability to identify properly, and mark to market, changes in the value of its financial instruments caused by changes in market prices or rates. The Firm’s earnings will also be dependent upon how effectively its critical accounting estimates, including those used in its private equity valuations, prove accurate and upon how effectively it determines and assesses the cost of credit and manages its risk concentrations. To the extent its assessments of migrations in credit quality and of risk concentrations, or its assumptions or estimates used in establishing valuation models for the fair value of assets and liabilities or for loan loss reserves, prove inaccurate or not predictive of actual results, the Firm could suffer higher-than-anticipated losses. The successful management of credit, market, operational and private equity risk is an important consideration in managing the Firm’s liquidity risk, as evaluation by rating agencies of the management of these risks affects their determinations as to the Firm’s credit ratings and, therefore, its cost of funds.
Non-U.S. operations
For geographic distributions of total revenue, total expense, income before income tax expense and net income, see Note 30 on page 125. For a discussion of non-U.S. loans, see Note 11 on page 101 and the sections entitled “Country exposure” in the MD&A on page 65 and “Cross-border outstandings” on page 139.
Item 2: Properties
The headquarters of JPMorgan Chase is located in New York City at 270 Park Avenue, which is a 50-story bank and office building owned by JPMorgan Chase. This location contains approximately 1.3 million square feet of space. In total, JPMorgan Chase owns or leases approximately 12.3 million square feet of commercial office space and retail space in New York City.
Prior to the merger with Bank One on July 1, 2004, the headquarters of Bank One was located in Chicago at 10 South Dearborn, which continues to be used as an administrative and operational facility. This location is owned by the Firm and contains approximately 2.0 million square feet of space. In total, JPMorgan Chase owns or leases approximately 5.2 million square feet of commercial office and retail space in Chicago.
JPMorgan Chase and its subsidiaries also own or lease significant administrative and operational facilities in Houston and Dallas, Texas (6.8 million square feet); Columbus, Ohio (3 million square feet); Phoenix, Arizona (1.5 million square feet); Tampa, Florida (1.1 million square feet); Jersey City, New Jersey (1.1 million square feet); and in Indianapolis, Indiana (1 million square feet).
In the United Kingdom, JPMorgan Chase leases approximately
2.4 million square feet of office space and owns a 350,000 square-foot
operations center.
In addition, JPMorgan Chase and its subsidiaries occupy offices and other administrative and operational facilities throughout the world under various types of ownership and leasehold agreements, including 2,508 retail branches in the United States. The properties occupied by JPMorgan Chase are used across all of the Firm’s business segments and for corporate purposes.
JPMorgan Chase continues to evaluate its current and projected space requirements, particularly in light of the merger with Bank One. There is no assurance that the Firm will be able to dispose of its excess premises or that it will not incur charges in connection with such dispositions. Such disposition costs may be material to the Firm’s results of operations in a given period. For a discussion of occupancy expense, see the Consolidated results of operations discussion on page 22.
Item 3: Legal proceedings
Enron litigation. JPMorgan Chase is involved in a number of lawsuits and investigations arising out of its banking relationships with Enron Corp. and its subsidiaries (“Enron”). A lawsuit in London by the Firm against Westdeutsche Landesbank Girozentrale (“WLB”) sought to compel payment of $165 million under an Enron-related letter of credit issued by WLB. WLB resisted payment on the grounds that the underlying pre-pay transaction, and its predecessors, were “disguised loans” and part of a
6
Table of Contents
“fraudulent scheme to hide Enron’s debt.” The trial of that action was conducted in June and July 2004, and on August 3, 2004, the Court issued its decision in favor of JPMorgan Chase, finding that the Firm did not commit fraud and ordering WLB to pay the letter of credit in full. That order has become final.
Other actions involving Enron have been initiated by parties against JPMorgan Chase, its directors and certain of its officers. These lawsuits include a series of purported class actions brought on behalf of shareholders of Enron, including the lead action captioned Newby v. Enron Corp. The consolidated complaint filed in Newby names as defendants, among others, JPMorgan Chase; several other investment banking firms; a number of law firms; Enron’s former accountants and affiliated entities and individuals; and other individual defendants, including present and former officers and directors of Enron. It asserts claims against JPMorgan Chase and the other defendants under federal and state securities laws. The Newby trial is scheduled to commence in October 2006.
Additional actions include: a purported, consolidated class action lawsuit by JPMorgan Chase stockholders alleging that the Firm issued false and misleading press releases and other public documents relating to Enron in violation of Section 10(b) of the Securities Exchange Act of 1934 and Rule 10b-5 thereunder; putative class actions on behalf of JPMorgan Chase employees who participated in the Firm’s employee stock ownership plans alleging claims under the Employee Retirement Income Security Act (“ERISA”) for alleged breaches of fiduciary duties and negligence by JPMorgan Chase, its directors and named officers; shareholder derivative actions alleging breaches of fiduciary duties and alleged failures to exercise due care and diligence by the Firm’s directors and named officers in the management of JPMorgan Chase; individual and putative class actions in various courts by Enron investors, creditors and holders of participating interests related to syndicated credit facilities; third-party actions brought by defendants in Enron-related cases, alleging federal and state law claims against JPMorgan Chase and many other defendants; investigations by governmental agencies with which the Firm is cooperating; and several bankruptcy actions, including an adversary proceeding brought by Enron in bankruptcy court seeking damages for alleged aiding and abetting of breaches of fiduciary duty by Enron insiders, return of alleged fraudulent conveyances and preferences, and equitable subordination of JPMorgan Chase’s claims in the Enron bankruptcy.
WorldCom litigation. J.P. Morgan Securities Inc. (“JPMSI”) and JPMorgan Chase were named as defendants in more than 50 actions that were filed in U.S. District Courts, in state courts in more than 20 states, and in one arbitral panel beginning in July 2002, arising out of alleged accounting irregularities in the books and records of WorldCom Inc. Plaintiffs in these actions are individual and institutional investors, including state pension funds, who purchased debt securities issued by WorldCom pursuant to public offerings in 1997, 1998, 2000 and 2001. JPMSI acted as an underwriter of the 1998, 2000 and 2001 offerings. In addition to JPMSI, JPMorgan Chase and, in two actions, J.P. Morgan Securities Ltd. (“JPMSL”), in its capacity as one of the underwriters of the international tranche of the 2001 offering, the defendants in various of the actions include other underwriters, certain executives and directors of WorldCom, and WorldCom’s auditors. In the actions, plaintiffs allege that defendants knew, or were reckless or negligent in not knowing, that the securities were sold to plaintiffs on the basis of misrepresentations and omissions of material facts concerning the financial condition and business of WorldCom. The complaints against JPMorgan Chase, JPMSI and JPMSL assert claims under federal and state securities laws, under other state statutes and
under common-law theories of fraud and negligent misrepresentation. In the class action pending in the U.S. District Court for the Southern District of New York, which involves claims on approximately $15 billion of Worldcom bonds, the court denied summary judgment with respect to the alleged financial misrepresentation and certain alleged omissions claims, and trial is presently scheduled to commence in late March 2005.
Commercial Financial Services litigation. JPMSI (formerly known as Chase Securities Inc.) has been named as a defendant in several actions that were filed in or transferred to the U.S. District Court for the Northern District of Oklahoma in 1999, arising from the failure of Commercial Financial Services, Inc. (“CFS”). Plaintiffs in these actions are institutional investors who purchased approximately $1.3 billion (original face amount) of asset-backed securities issued by CFS. The securities were backed by charged-off credit card receivables. In addition to JPMSI, the defendants in various of the actions are the founders and key executives of CFS, as well as its auditors and outside counsel. JPMSI is alleged to have been the investment banker to CFS and to have acted as an initial purchaser and placement agent in connection with the issuance of certain of the securities. Plaintiffs allege that defendants knew, or were reckless or negligent in not knowing, that the securities were sold to plaintiffs on the basis of misleading misrepresentations and omissions of material facts. The complaints against JPMSI assert claims under the Securities Exchange Act of 1934, under the Oklahoma Securities Act and under common-law theories of fraud and negligent misrepresentation. Plaintiffs seek damages in the amount of approximately $1.8 billion, plus punitive damages and additional interest that continues to accrue, and attorney’s fees. CFS has commenced an action against JPMSI in Oklahoma state court and has asserted claims against JPMSI for professional negligence and breach of fiduciary duty. CFS alleges that JPMSI failed to detect and prevent its insolvency. CFS seeks damages of approximately $1.3 billion. CFS also has commenced, in its bankruptcy case, an adversary proceeding against JPMSI and its credit card affiliate, Chase Manhattan Bank USA, N.A., alleging that certain payments, aggregating $78.4 million, made in connection with CFS’s purchase or securitization of charged-off credit card receivables were constructive fraudulent conveyances, and it seeks to recover such payments and interest. A trial date on the adversary proceeding has been set for May 2005. The federal securities actions have been set for trial in July 2005.
IPO allocation litigation. Beginning in May 2001, JPMorgan Chase and certain of its securities subsidiaries were named, along with numerous other firms in the securities industry, as defendants in a large number of putative class action lawsuits filed in the U.S. District Court for the Southern District of New York. These suits purport to challenge alleged improprieties in the allocation of stock in various public offerings, including some offerings for which a JPMorgan Chase entity served as an underwriter. The suits allege violations of securities and antitrust laws arising from alleged material misstatements and omissions in registration statements and prospectuses for the initial public offerings (“IPOs”) and alleged market manipulation with respect to aftermarket transactions in the offered securities. The securities claims allege, among other things, misrepresentation and market manipulation of the aftermarket trading for these offerings by tying allocations of shares in IPOs to undisclosed excessive commissions paid to JPMorgan Chase and to required aftermarket purchase transactions by customers who received allocations of shares in the respective IPOs, as well as allegations of misleading analyst reports. The antitrust claims allege an illegal conspiracy to require customers, in exchange for IPO allocations, to pay undisclosed and excessive
7
Table of Contents
Part I
commissions and to make aftermarket purchases of the IPO securities at a price higher than the offering price as a precondition to receiving allocations. The securities cases were all assigned to one judge for coordinated pre-trial proceedings, and the antitrust cases were all assigned to another judge. On February 13, 2003, the Court denied the motions of JPMorgan Chase and others to dismiss the securities complaints. On October 13, 2004, the Court granted in part plaintiffs’ motion to certify classes in six “focus” cases in the securities litigation, and the underwriter defendants have petitioned to appeal that decision. On February 15, 2005, the Court preliminarily approved a proposed settlement of plaintiffs’ claims against the issuer defendants in these cases. With respect to the antitrust claims, on November 3, 2003, the Court granted defendants’ motion to dismiss the claims relating to the IPO allocation practices, and that decision is on appeal. A separate antitrust claim alleging that JPMSI and the other underwriters conspired to fix their underwriting fees is in discovery.
Research analyst conflicts. JPMSI has been named as a co-defendant with nine other broker-dealers in a putative class action filed in federal court in Colorado, seeking an unspecified amount of money damages for alleged violations of federal securities laws related to analyst independence issues; and an action filed in West Virginia state court by West Virginia’s Attorney General, seeking recovery from the defendants in the aggregate of $5,000 for each of what are alleged to be hundreds of thousands of violations of the state’s consumer protection statute. On August 8, 2003, the plaintiffs in the Colorado action dismissed the complaint without prejudice. In West Virginia, the court denied defendants’ motion to dismiss, and defendants are pursuing an interlocutory appeal to the State Supreme court.
JPMSI was served by the SEC, NASD and NYSE on or about May 30, 2003, with subpoenas or document requests seeking information regarding certain present and former officers and employees in connection with an investigation focusing on whether particular individuals properly performed supervisory functions regarding domestic equity research. The regulators also raised issues regarding JPMSI’s document retention procedures and policies and pursued a books-and-records charge against it concerning e-mail that its heritage entities could not retrieve for the period prior to July 2001. JPMSI has negotiated an agreement that has been accepted by all of the regulators to settle this matter for a payment of a $2.1 million penalty without admitting or denying any allegations.
National Century Financial Enterprises litigation. JPMorgan Chase, JPMorgan Chase Bank, JPMorgan Partners, Beacon Group, LLC and three current or former Firm employees have been named as defendants in more than a dozen actions filed in or transferred to the United States District Court for the Southern District of Ohio (the “MDL Litigation”). In the majority of these actions, Bank One, Bank One, N.A., and Banc One Capital Markets, Inc. are also named as defendants. JPMorgan Chase Bank and Bank One, N.A. are also defendants in an action brought by The Unencumbered Assets Trust (“UAT”), a trust created for the benefit of the creditors of National Century Financial Enterprises, Inc. (“NCFE”) as a result of NCFE’s Plan of Liquidation in bankruptcy. These actions arose out of the November 2002 bankruptcy of NCFE. Prior to bankruptcy, NCFE provided financing to various healthcare providers through wholly-owned special-purpose vehicles, including NPF VI and NPF XII, which purchased discounted accounts receivable to be paid under third-party insurance programs. NPF VI and NPF XII financed the purchases of such receivables primarily through private placements of notes (“Notes”) to institutional investors and pledged the receivables for, among other
things, the repayment of the Notes. In the MDL Litigation, JPMorgan Chase Bank is sued in its role as indenture trustee for NPF VI, which issued approximately $1 billion in Notes. Bank One, N.A. is sued in its role as indenture trustee for NPF XII, which issued approximately $2 billion in Notes. The three current or former Firm employees are sued in their roles as former members of NCFE’s board of directors (the “Defendant Employees”). JPMorgan Chase, JPMorgan Partners and Beacon Group, LLC, are claimed to be vicariously liable for the alleged actions of the Defendant Employees. Banc One Capital Markets, Inc. is sued in its role as co-manager for three note offerings made by NPF XII. Other defendants include the founders and key executives of NCFE, its auditors and outside counsel, and rating agencies and placement agents that were involved with the issuance of the Notes. Plaintiffs in these actions include institutional investors who purchased more than $2.7 billion in original face amount of asset-backed securities issued by NCFE. Plaintiffs allege that the trustees violated fiduciary and contractual duties, improperly permitted NCFE and its affiliates to violate the applicable indentures and violated securities laws by (among other things) failing to disclose the true nature of the NCFE arrangements. Plaintiffs further allege that the Defendant Employees controlled the Board and audit committees of the NCFE entities; were fully aware or negligent in not knowing of NCFE’s alleged manipulation of its books; and are liable for failing to disclose their purported knowledge of the alleged fraud to the plaintiffs. Plaintiffs also allege that Banc One Capital Markets, Inc. is liable for cooperating in the sale of securities based on false and misleading statements. Motions to dismiss on behalf of the JPMorgan Chase entities, the Bank One entities and the Defendant Employees are currently pending. In the UAT action, JPMorgan Chase Bank and Bank One are sued in their roles as indenture trustees. Claims are asserted under the Federal Racketeer Influenced and Corrupt Organizations Act (“RICO”), the Ohio Corrupt Practices Act and various common-law claims. Responsive pleadings in the UAT action have not been filed.
Mutual fund Litigation: On June 29, 2004, Banc One Investment Advisors (“BOIA”) entered into a
settlement with the New York Attorney General and the SEC related to alleged market timing in the
One Group mutual funds. Under the settlement, BOIA paid $10 million in restitution and fee
disgorgement plus a civil penalty of $40 million. BOIA also agreed to reduce fees over a five-year
period in the amount of $8 million per year, consented to a cease-and-desist order and a censure,
and agreed to undertake certain compliance and mutual fund governance reforms. Additionally,
JPMorgan Chase, Bank One, and certain subsidiaries and officers have been named, along with
numerous other entities related to the mutual fund industry, as defendants in private-party
litigation arising out of alleged late trading and market timing in mutual funds. The actions have
been filed in or transferred to U.S. District Court in Baltimore, Maryland. Certain plaintiffs
allege that BOIA and related entities and officers allowed favored investors to market time and
late trade in the One Group mutual funds. These complaints include a purported class action on
behalf of One Group shareholders alleging claims under federal securities laws and common law; a
purported derivative suit on behalf of the One Group funds under the Investment Company Act, the
Investment Advisers Act and common law; and a purported class action on behalf of participants and
beneficiaries of the Bank One Corporation 401(k) plan, alleging claims under the Employee
Retirement Income Security Act. On September 29, 2004, certain other plaintiffs in the federal
action in Baltimore, Maryland filed amended complaints which included JPMorgan Chase and JPMSI as
defendants. The amended complaints allege that JPMorgan Chase and JPMSI, with several co-defendants
including Bank of America,
8
Table of Contents
Bank of America Securities, Canadian Imperial Commerce Bank, Bear Stearns and CFSB, provided financing to Canary Capital which was used to engage in the market timing and late trading. JPMorgan Chase and JPMSI are alleged to have financed knowingly the market timing and late trading by Canary Capital and Edward Stern, and knowingly to have created short-position equity baskets to allow Canary Capital to profit from trading in a falling market. On February 25, 2005, BOIA, JPMorgan Chase, JPMSI and other defendants filed motions to dismiss these actions.
Certain JPMorgan Chase subsidiaries have also received various subpoenas and information requests relating to market timing and late trading in mutual funds from various governmental and other agencies, including the SEC, the NASD, the U.S. Department of Labor, the Attorneys General of New York, West Virginia and Vermont, and regulators in the United Kingdom, Luxembourg, the Republic of Ireland, Chile and Hong Kong. The Firm is fully cooperating with these investigations.
On January 12, 2005, Bank One Securities Corporation (“BOSC”) entered into a settlement with the NASD pursuant to which BOSC was censured and agreed to pay a $400,000 fine for its alleged failure to implement adequate supervisory systems and written procedures designed to detect and prevent late trading of mutual funds, and for inaccurately recording the entry time for customer orders.
Bank One Securities Litigation. Bank One and several former officers and directors are defendants in three class actions and one individual action arising out of the mergers between Banc One Corporation (“Banc One”) and First Commerce Corporation (“First Commerce”), and Banc One Corporation and First Chicago NBD Corporation (“FCNBD”). These actions were filed in 2000 and are pending in the United States District Court for the Northern District of Illinois in Chicago under the general caption, In re Bank One Securities Litigation. The cases were filed after Bank One’s earnings announcements in August and November 1999 that lowered Bank One’s earnings expectations for the third and fourth quarters of 1999. Following the announcements, Bank One’s stock price had dropped by 37.7% as of November 10, 1999.
Two of these class actions were brought by representatives of FCNBD shareholders and Banc One shareholders, respectively, alleging certain misrepresentations and omissions of material fact made in connection with the merger between FCNBD and Banc One, which was completed in October 1998. There is also an individual lawsuit proceeding
in connection with that same merger. A third class action was filed by another individual plaintiff representing shareholders of First Commerce, alleging certain misrepresentations and omissions of material fact made in connection with the merger between Banc One and First Commerce, which was completed in June 1998. All of these plaintiff groups claim that as a result of various misstatements or omissions regarding payment processing issues at First USA Bank, N.A., a wholly-owned subsidiary of Banc One, and as a result of the use of various accounting practices, the price of Banc One common stock was artificially inflated, causing their shareholders to acquire shares of the Bank One’s common stock in the merger at an exchange rate that was artificially deflated. The complaints against Bank One and the individual defendants assert claims under federal securities laws. Fact discovery, with limited exceptions, closed in December 2003. The parties are in the middle of expert discovery, which is scheduled to close in the spring of 2005.
In addition to the various cases, proceedings and investigations discussed above, JPMorgan Chase and its subsidiaries are named as defendants in a number of other legal actions and governmental proceedings arising in connection with their respective businesses. Additional actions, investigations or proceedings may be brought from time to time in the future. In view of the inherent difficulty of predicting the outcome of legal matters, particularly where the claimants seek very large or indeterminate damages, or where the cases present novel legal theories, involve a large number of parties or are in early stages of discovery, the Firm cannot state with confidence what the eventual outcome of these pending matters will be, what the timing of the ultimate resolution of these matters will be or what the eventual loss, fines or penalties related to each pending matter may be. JPMorgan Chase believes, based upon its current knowledge, after consultation with counsel and after taking into account its litigation reserves, that the outcome of the legal actions, proceedings and investigations currently pending against it should not have a material adverse effect on the consolidated financial condition of the Firm. However, in light of the uncertainties involved in such proceedings, actions and investigations, there is no assurance that the ultimate resolution of these matters will not significantly exceed the reserves currently accrued by the Firm; as a result, the outcome of a particular matter may be material to JPMorgan Chase’s operating results for a particular period, depending upon, among other factors, the size of the loss or liability imposed and the level of JPMorgan Chase’s income for that period.
Item 4: Submission of matters to a vote of security holders
None.
Executive officers of the registrant
| Name | Age | Positions and offices held with JPMorgan Chase | ||||
| (at December 31, 2004) | ||||||
William B. Harrison, Jr.
|
61 | Chairman and Chief Executive Officer since November 2001, prior to which he was President and Chief Executive Officer from December 2000. He was Chairman and Chief Executive Officer from January through December 2000 and President and Chief Executive Officer from June through December 1999. | ||||
9
Table of Contents
Part I
James Dimon
|
48 | President and Chief Operating Officer. Prior to the Merger, he had been Chairman and Chief Executive Officer of Bank One Corporation since March 2000. Before joining Bank One Corporation, he had been a private investor from November 1998 until March 2000; President of Citigroup Inc. and Chairman and Co-Chief Executive Officer of Citigroup Inc. subsidiary Salomon Smith Barney Holdings, Inc. from October to November 1998; President and Chief Operating Officer of Travelers Group from November 1993 until October 1998. | ||||
Austin A. Adams
|
61 | Chief Information Officer. Prior to the Merger, he had been Chief Information Officer of Bank One Corporation since March 2001. Before joining Bank One Corporation, he had been Chief Information Officer at First Union Corporation (now known as Wachovia Corp.) from 1985 until February 2001. | ||||
Steven B. Black
|
52 | Co-Chief Executive Officer of the Investment Bank since March 2004, prior to which he had been Deputy Head of the Investment Bank since January 2001 and Head of Institutional Equities business since 2000. Prior to joining JPMorgan Chase in 2000, he had been Vice Chairman, Global Equities, Tax Exempt Securities and Securities Lending of Citigroup Inc. subsidiary, Salomon Smith Barney Inc. | ||||
William I. Campbell
|
60 | Chairman of Card Services. Prior to the Merger, he had been Head of Card Services with Bank One Corporation since July 2003. He had been Senior Partner with Sanoch Management, LLC from January 2000 until July 2003, prior to which he had been Co-Chief Executive Officer of Global Consumer Business of Citigroup Inc. from January 1996 until December 1999. | ||||
Michael J. Cavanagh
|
38 | Chief Financial Officer since September 2004, prior to which he had been Head of Middle Market Banking. Prior to the Merger, he had been Chief Administrative Officer of Commercial Banking from February 2003, Chief Operating Officer for Middle Market Banking from August 2003, Treasurer from 2001 until 2003, and Head of Strategy and Planning from May 2000 until 2001 at Bank One Corporation. Prior to joining Bank One Corporation, he held executive positions at Citigroup Inc. and its predecessor entities. | ||||
David A. Coulter
|
57 | Chairman of West Coast Region since January 2005 and Head of Private Equity since March 2004. He had been Chairman of the Investment Bank and Head of Asset & Wealth Management from June 2002 until December 2004, prior to which he had been Head of Chase Financial Services from 2000 until 2002. Prior to joining JPMorgan Chase in 2000, he led the West Coast operations of The Beacon Group, prior to which he was Chairman and Chief Executive Officer of BankAmerica Corporation and Bank of America NT & SA. | ||||
John J. Farrell
|
52 | Director Human Resources and Head of Security since September 2001. | ||||
Joan Guggenheimer
|
52 | Co-General Counsel. Prior to the Merger, she had been Chief Legal Officer and Corporate Secretary at Bank One Corporation since May 2003. She had served in various positions with Citigroup Inc. and its predecessor entities from 1985 until 2003, and prior to joining Bank One Corporation was General Counsel of the Global Corporate and Investment Bank and also served as Co-General Counsel of Citigroup Inc. | ||||
Frederick W. Hill
|
54 | Director of Corporate Marketing and Communications. | ||||
Samuel Todd Maclin
|
48 | Head of Commercial Banking since July 2004, prior to which he had been Chairman and CEO of the Texas Region and Head of Middle Market Banking. | ||||
Jay Mandelbaum
|
42 | Head of Strategy and Business Development. Prior to the Merger, he had been Head of Strategy and Business Development since September 2002 at Bank One Corporation. He had been Vice Chairman and Chief Executive Officer of the Private Client Group of Citigroup Inc. subsidiary Salomon Smith Barney, Inc. from September 2000 until August 2002 and Senior Executive Vice President of Private Client Sales and Marketing at Salomon Smith Barney, Inc. from August 1997 until August 2000. | ||||
William H. McDavid
|
58 | Co-General Counsel. Prior to the Merger, he had been General Counsel. | ||||
Heidi Miller
|
51 | Chief Executive Officer of Treasury & Securities Services. Prior to the Merger, she had been Chief Financial Officer at Bank One Corporation since March 2002. Prior to joining Bank One Corporation, she had been Vice Chairman of Marsh, Inc. from January 2001 until |
10
Table of Contents
| March 2002; Senior Executive Vice President, Chief Financial Officer and Head of Strategic Planning at Priceline.com from March until November 2000; Chief Financial Officer at Citigroup Inc. from 1998 until March 2000. | ||||||
Charles W. Scharf
|
39 | Head of Retail Financial Services. Prior to the Merger, he had been Head of Retail Banking from May 2002 prior to which he was Chief Financial Officer from June 2000 at Bank One Corporation. Prior to joining Bank One Corporation, he had been Chief Financial Officer at Citigroup Global Corporate and Investment Bank from 1998 until 2000. | ||||
Richard J. Srednicki
|
57 | Chief Executive Officer of Card Services from July 2004 prior to which he was Executive Vice President of Chase Cardmember Services from 1999 until 2004. | ||||
James E. Staley
|
48 | Global Head of Asset & Wealth Management since 2001. He had been Head of the Private Bank at J.P. Morgan & Co. Incorporated. | ||||
Don M. Wilson III
|
56 | Chief Risk Officer. He had been Co-Head of Credit & Rates Markets from 2001 until July 2003, prior to which he headed the Global Trading Division. | ||||
William T. Winters
|
43 | Co-Chief Executive Officer of the Investment Bank since March 2004, prior to which he had been Deputy Head of the Investment Bank and Head of Credit & Rate Markets. He had been Head of Global Markets at J.P. Morgan & Co. Incorporated. |
Unless otherwise noted, during the five fiscal years ended December 31, 2004, all of JPMorgan Chase’s above-named executive officers have continuously held senior-level positions with JPMorgan Chase or its predecessor institutions, Bank One Corporation, J.P. Morgan & Co. Incorporated and The Chase Manhattan Corporation. There are no family relationships among the foregoing executive officers.
Part II
Item 5: Market for registrant’s common
equity, related stockholder matters and
issuer purchases of equity securities
The outstanding shares of JPMorgan Chase’s common stock are listed and traded on the New York Stock Exchange, the London Stock Exchange Limited and the Tokyo Stock Exchange. For the quarterly high and low prices of JPMorgan Chase’s common stock on the New York Stock Exchange for the last two years, see the section entitled “Supplementary information — selected quarterly financial data (unaudited)” on page 129. JPMorgan Chase declared quarterly cash dividends on its common stock in the amount of $0.34 per share for each quarter of 2004 and 2003. The common dividend payout ratio based on reported net income was 88% for 2004, 43% for 2003 and 171% for 2002. At January 31, 2005, there were 233,239 holders of record of JPMorgan Chase’s common stock. For information regarding securities authorized for issuance under the Firm’s employee stock-based compensation plans, see Item 12 on page 12.
On July 20, 2004, the Board of Directors approved an initial stock repurchase program in the aggregate amount of $6.0 billion. This amount includes shares to be repurchased to offset issuances under the Firm’s employee equity-based plans. The actual amount of shares repurchased will be subject to various factors, including market conditions; legal considerations affecting the amount and timing of repurchase activity; the Firm’s capital position (taking into account purchase accounting adjustments); internal capital generation; and alternative potential investment opportunities. The stock repurchase program has no set expiration or termination date.
The Firm’s repurchases of equity securities were as follows:
| Total open | Average | Dollar value of | ||||||||||
| For the year ended | market shares | price paid | remaining authorized | |||||||||
| December 31, 2004 | repurchased | per share(a) | repurchase program | |||||||||
Third quarter |
3,497,700 | $ | 39.42 | $ | 5,862 | |||||||
October |
4,187,000 | 37.60 | 5,704 | |||||||||
November |
5,827,700 | 38.12 | 5,482 | |||||||||
December |
5,766,800 | 38.19 | 5,262 | |||||||||
Fourth quarter |
15,781,500 | 38.01 | 5,262 | |||||||||
Total for 2004 |
19,279,200 | $ | 38.27 | $ | 5,262 | |||||||
| (a) | Excludes commission costs. |
In addition to the repurchases disclosed above, participants in the Long-term Incentive Plan and Stock Option Plan may have shares withheld to cover income taxes. Shares withheld to pay income taxes are repurchased pursuant to the terms of the applicable Plan and not under the Firm’s publicly announced share repurchase program. Shares repurchased were as follows for the year ended December 31, 2004: first quarter— 3,625,236 shares at an average price per share of $39.47; second quarter—669,247 shares at an average price per share of $36.23; third quarter—995,686 shares at an average price per share of $38.17; October—107,795 shares at an average price per share of $39.48; November—216,254 shares at an average price per share of $38.79; December—95,026 shares at an average price per share of $37.96; fourth quarter—419,075 shares at an average price per share of $38.78; 2004 Total—5,709,244 shares at an average price per share of $38.82.
11
Table of Contents
Parts II & III
Item 6: Selected financial data
For five-year selected financial data, see “Five-year summary of consolidated financial highlights (unaudited)” on page 130.
Item 7: Management’s discussion and
analysis of financial condition and
results of operations
Management’s discussion and analysis of the financial condition and results of operations, entitled “Management’s discussion and analysis,” appears on pages 18 through 81. Such information should be read in conjunction with the Consolidated financial statements and Notes thereto, which appear on pages 84 through 128.
Item 7A: Quantitative and qualitative
disclosures about market risk
For information related to market risk, see the “Market risk management” section on pages 70 through 74 and Note 26 on pages 118-119.
Item 8: Financial statements
and supplementary data
The Consolidated financial statements, together with the Notes thereto and the report of PricewaterhouseCoopers LLP dated February 22, 2005 thereon, appear on pages 83 through 128.
Supplementary financial data for each full quarter within the two years ended December 31, 2004 are included on page 129 in the table entitled “Supplementary information — selected quarterly financial data (unaudited).” Also included is a “Glossary of terms” on page 131.
Item 9: Changes in and disagreements
with accountants on accounting and
financial disclosure
None.
Item 9A: Controls and procedures
Within the 75-day period prior to the filing of this report, an evaluation was carried out under the supervision and with the participation of the Firm’s management, including its Chief Executive Officer, Chief Operating Officer and Chief Financial Officer, of the effectiveness of the design and operation of its disclosure controls and procedures (as defined in Rule 13a-15(e) under the Securities Exchange Act of 1934). See Exhibits 31.1,
31.2 and 31.3 for the Certification statements issued by the Chief Executive Officer, Chief Operating Officer and Chief Financial Officer. Based upon that evaluation, the Chief Executive Officer, Chief Operating Officer and Chief Financial Officer concluded that the design and operation of these disclosure controls and procedures were effective.
The work undertaken by the Firm to comply with Section 404 of the Sarbanes-Oxley Act of 2002 involved the identification, documentation, assessment and testing of the Firm’s internal control over financial reporting in order to evaluate the effectiveness of such controls. The evaluation included key controls of Bank One Corporation from the date of its acquisition on July 1, 2004.
The Firm is committed to maintaining high standards of internal control over financial reporting.
Nevertheless, because of its inherent limitations, internal control over financial reporting may
not prevent or detect misstatements. In addition, in a firm as large and complex as JPMorgan
Chase, lapses or deficiencies in internal controls are likely to occur from time to time and there
can be no assurance that any such deficiencies will not result in significant deficiencies — or,
even, material weaknesses — in internal controls in the future. See page 82 for Management’s
report on internal control over financial reporting, and page 83 for
the Report of the Firm’s independent
registered public accounting firm with respect to management’s
assessment of internal control. There was no change in the
Firm’s internal control over financial reporting (as defined in
Rule 13a-15(f) under the Securities Exchange Act of 1934) that
occurred during the fourth quarter of 2004 that has materially
affected, or is reasonably likely to materially affect, the
Firm’s internal control over financial reporting.
Item 9B: Other information
None.
Part III
Item 10: Directors and
executive officers of the Registrant
See Item 13 on page 13.
Item 11: Executive compensation
See Item 13 on page 13.
Item 12: Security ownership of certain
beneficial owners and management
For security ownership of certain beneficial owners and management, see Item 13 on page 13.
12
Table of Contents
Parts III & IV
The following table details the total number of shares available for issuance under JPMorgan Chase employee stock-based incentive plans (including shares available for issuance to nonemployee directors). The Firm is not authorized to grant stock-based incentive awards to nonemployees other than to nonemployee directors.
| Number of shares to be | Weighted-average | Number of shares remaining | ||||||||||
| December 31, 2004 | issued upon exercise of | exercise price of | available for future issuance under | |||||||||
| (Shares in thousands) | outstanding options | outstanding options | equity compensation plans | |||||||||
Employee stock-based incentive plans approved by shareholders |
314,814 | $ | 35.76 | 188,580 | (a)(b) | |||||||
Employee stock-based incentive plans not approved by shareholders |
172,448 | 40.12 | 54,000 | (c) | ||||||||
Total |
487,262 | $ | 37.30 | 242,580 | ||||||||
| (a) | Includes
35 million shares of restricted stock/restricted stock units available for
grant in lieu of cash under our shareholder approved plan. The shareholder approved
1996 Long-Term Incentive Plan, as
amended in May 2000, expires in May 2005. |
|
| (b) | In
January 2005, approximately 35.5 million restricted stock
units and 2.0 million stock appreciation rights (“SARs”)
(settled only in shares) and stock options were granted under the Firm’s shareholder
approved plan as part of
employee annual incentive compensation. Other than these grants, the Firm does not
anticipate making any significant grants to employees under the 1996 Long-Term Incentive
Plan before
this plan expires in May 2005. A new equity plan will be presented for approval by
shareholders at the annual meeting in May 2005. For the new
equity plan, management will
not be
requesting the remaining shares available for future issuance under the shareholder
approved 1996 Long-Term Incentive Plan — anticipated to be about 150 million shares — be
made available
under the new equity plan. |
|
| (c) | Management has determined that there will be no grants in 2005 under either the Stock Option
Plan (under which options and SARs were last awarded in 2002) and the Value Sharing
Plan (6.3 million options and SARs were
granted in 2004). Both of these non-shareholder approved plans will expire in May
2005. Management will not be requesting that the 54 million shares available for
future issuance be carried over to the new equity plan. |
Item 13: Certain relationships and
related transactions
Information related to JPMorgan Chase’s Executive Officers is included on pages 9-11. Pursuant to Instruction G (3) to Form 10-K, the remainder of the information to be provided in Items 10, 11, 12, 13 and 14 of Form 10-K (other than information pursuant to Rule 402 (i), (k) and (l) of Regulation S-K) is incorporated by reference to JPMorgan Chase’s definitive proxy statement for the 2005 annual meeting of stockholders, which proxy statement will be filed with the Securities and Exchange Commission pursuant to Regulation 14A within 120 days of the close of JPMorgan Chase’s 2004 fiscal year.
Item 14: Principal accounting fees and
services
See Item 13 above.
Part IV
Item 15: Exhibits, financial statement
schedules
Exhibits, financial statements and financial statement schedules
| 1. | Financial statements |
|||
The Consolidated financial statements, the Notes thereto and the report thereon listed in Item
8 are set forth commencing on page 83. |
||||
| 2. | Financial statement schedules |
|||
Financial statement schedules are omitted since the required information is either not
applicable, not deemed material, or is shown in the respective Consolidated financial
statements or in the Notes thereto. |
||||
| 3. | Exhibits |
|||
| 3.1 | Restated Certificate of Incorporation of JPMorgan Chase & Co. |
|||
| 3.2 | By-laws of JPMorgan Chase & Co. as amended by the Board of
Directors on March 16, 2004, effective July 20, 2004. |
|||
| 4.1 | Deposit Agreement, dated as of February 8, 1996, between
J.P. Morgan & Co. Incorporated (succeeded through merger by
JPMorgan Chase & Co.) and Morgan Guaranty Trust Company of
New York (succeeded through merger by JPMorgan Chase Bank),
as Depository (incorporated by reference to Exhibit 4.7 to the
Registration Statement on Form 8-A of The Chase Manhattan
Corporation (now known as JPMorgan Chase & Co.) File No.
1-5805), filed December 20, 2000. |
|||
| 4.2 | Indenture, dated as of December 1, 1989, between Chemical
Banking Corporation (now known as JPMorgan Chase & Co.) and
The Chase Manhattan Bank (National Association), as succeeded
to by Bankers Trust Company (now known as Deutsche Bank
Trust Company Americas), as Trustee. |
|||
| 4.3(a) | Indenture, dated as of April 1, 1987, as amended and restated as of December 15, 1992,
between Chemical Banking Corporation (now known as JPMorgan Chase & Co.) and Morgan Guaranty
Trust Company of New York (now known as JPMorgan Chase Bank), as succeeded to by U.S. Bank
Trust National Association, as Trustee (incorporated by reference to Exhibit 4.3(a) to the
Annual Report on Form 10-K of JPMorgan Chase & Co. (File No. 1-5805) for the year ended
December 31, 2000). |
|||
| 4.3(b) | Second Supplemental Indenture, dated as of October 8, 1996,
between The Chase Manhattan Corporation (now known as
JPMorgan Chase & Co.) and U.S. Bank Trust National
Association, as Trustee, to the Indenture, dated as of April 1,
1987, as amended and restated as of December 15, 1992 (incorporated by reference to Exhibit 4.3(b) to the Annual Report on
Form 10-K of J.P. Morgan Chase & Co. (File No. 1-5805) for the
year ended December 31, 2000). |
|||
13
Table of Contents
Part IV
| 4.3(c) | Third Supplemental Indenture, dated as of December 29, 2000,
between The Chase Manhattan Corporation (now known as
JPMorgan Chase & Co.) and U.S. Bank Trust National
Association, as Trustee, to the Indenture, dated as of April 1,
1987, as amended and restated as of December 15, 1992 (incorporated by reference to Exhibit 4.3(c) to the Annual Report on
Form 10-K of J.P. Morgan Chase & Co. (File No. 1-5805) for the
year ended December 31, 2000). |
|||
| 4.4(a) | Amended and Restated Indenture, dated as of September 1,
1993, between The Chase Manhattan Corporation (as assumed
by JPMorgan Chase & Co.) and Chemical Bank (succeeded
through the merger by JPMorgan Chase Bank), as Trustee (incorporated by reference to Exhibit 4.4(a) to the Annual Report on
Form 10-K of J.P. Morgan Chase & Co. (File No. 1-5805) for the
year ended December 31, 2000). |
|||
| 4.4(b) | First Supplemental Indenture, dated as of March 29, 1996,
among Chemical Banking Corporation (now known as JPMorgan
Chase & Co.), The Chase Manhattan Corporation, Chemical
Bank, as resigning Trustee, and U.S. Bank Trust National
Association, as successor Trustee, to the Amended and Restated
Indenture, dated as of September 1, 1993 (incorporated by reference to Exhibit 4.4(b) to the Annual Report on Form 10-K of J.P.
Morgan Chase & Co. (File No. 1-5805) for the year ended
December 31, 2000). |
|||
| 4.4(c) | Second Supplemental Indenture, dated as of October 8, 1996,
between The Chase Manhattan Corporation (now known as
JPMorgan Chase & Co.) and U.S. Bank Trust National Association,
as Trustee, to the Amended and Restated Indenture, dated as of
September 1, 1993 (incorporated by reference to Exhibit 4.4(c) to
the Annual Report on Form 10-K of J.P. Morgan Chase & Co. (File
No. 1-5805) for the year ended December 31, 2000). |
|||
| 4.4(d) | Third Supplemental Indenture, dated as of December 29, 2000,
between The Chase Manhattan Corporation (now known as
JPMorgan Chase & Co.) and U.S. Bank Trust National Association,
as Trustee, to the Amended and Restated Indenture, dated as of
September 1, 1993 (incorporated by reference to Exhibit 4.4(d)
to the Annual Report on Form 10-K of J.P. Morgan Chase & Co.
(File No. 1-5805) for the year ended December 31, 2000). |
|||
| 4.5(a) | Indenture dated as of August 15, 1982, between J.P. Morgan &
Co. Incorporated (succeeded through merger by JPMorgan Chase
& Co.) and U.S. Bank Trust National Association, as Trustee
(incorporated by reference to Exhibit 4.5(a) to the Annual Report
on Form 10-K of J.P. Morgan Chase & Co. (File No. 1-5805) for
the year ended December 31, 2000). |
|||
| 4.5(b) | First Supplemental Indenture, dated as of May 5, 1986,
between J.P. Morgan & Co. Incorporated (succeeded through
merger by JPMorgan Chase & Co.) and U.S. Bank Trust National
Association, as Trustee, to the Indenture, dated as of August 15,
1982 (incorporated by reference to Exhibit 4.5(b) to the Annual
Report on Form 10-K of J.P. Morgan Chase & Co. (File No. 1-5805) for the year ended December 31, 2000). |
|||
| 4.5(c) | Second Supplemental Indenture, dated as of February 27, 1996,
between J.P. Morgan & Co. Incorporated (succeeded through
merger by JPMorgan Chase & Co.) and U.S. Bank Trust National
Association, as Trustee, to the Indenture, dated as of August 15,
1982 (incorporated by reference to Exhibit 4.5(c) to the Annual
Report on Form 10-K of J.P. Morgan Chase & Co. (File No. 1-5805) for the year ended December 31, 2000). |
|||
| 4.5(d) | Third Supplemental Indenture, dated as of January 30, 1997,
between J.P. Morgan & Co. Incorporated (succeeded through
merger by JPMorgan Chase & Co.) and U.S. Bank Trust National
Association, as Trustee, to the Indenture, dated as of August 15,
1982 (incorporated by reference to Exhibit 4.5(d) to the Annual
Report on Form 10-K of J.P. Morgan Chase & Co. (File No. 1-5805) for the year ended December 31, 2000). |
|||
| 4.5(e) | Fourth Supplemental Indenture, dated as of December 29, 2000,
among J.P. Morgan & Co. Incorporated, The Chase Manhattan
Corporation (now known as JPMorgan Chase & Co.), and U.S.
Bank Trust National Association, as Trustee, to the Indenture, dated
as of August 15, 1982 (incorporated by reference to Exhibit
4.5(e) to the Annual Report on Form 10-K of J.P. Morgan Chase
& Co. (File No. 1-5805) for the year ended December 31, 2000). |
|||
| 4.6(a) | Indenture dated as of March 1, 1993, between J.P. Morgan & Co.
Incorporated (succeeded through merger by JPMorgan Chase &
Co.) and U.S. Bank Trust National Association, as Trustee (incorporated by reference to Exhibit 4.7(a) to the Annual Report on
Form 10-K of J.P. Morgan Chase & Co. (File No. 1-5805) for the
year ended December 31, 2000). |
|||
| 4.6(b) | First Supplemental Indenture, dated as of December 29, 2000,
among J.P. Morgan & Co. Incorporated, The Chase Manhattan
Corporation (now known as JPMorgan Chase & Co.), and U.S.
Bank Trust National Association, as Trustee, to the Indenture,
dated as of March 1, 1993 (incorporated by reference to Exhibit
4.7(b) to the Annual Report on Form 10-K of J.P. Morgan Chase
& Co. (File No. 1-5805) for the year ended December 31, 2000). |
|||
| 4.7 | Indenture dated May 25, 2001, between J.P. Morgan Chase &
Co. (now known as JPMorgan Chase & Co.) and Deutsche Bank
Trust Company Americas (previously known as Bankers Trust
Company), as Trustee (incorporated by reference to Exhibit
4(a)(1) to the Registration Statement on Form S-3 (File
No. 333-52826)
of J.P. Morgan Chase & Co., File No. 1-5805). |
|||
| 4.8(a) | Junior Subordinated Indenture, dated as of December 1, 1996,
between The Chase Manhattan Corporation (now known as
JPMorgan Chase & Co.) and The Bank of New York, as
Debenture Trustee. |
|||
| 4.8(b) | Guarantee Agreement, dated as of January 24, 1997, between
The Chase Manhattan Corporation (now known as JPMorgan
Chase & Co.) and The Bank of New York, as Trustee. |
|||
| 4.8(c) | Amended and Restated Trust Agreement, dated as of January
24, 1997, among The Chase Manhattan Corporation (now
known as JPMorgan Chase & Co.), The Bank of New York, as
Property Trustee, The Bank of New York (Delaware), as Delaware
Trustee, and the Administrative Trustees named therein. |
|||
14
Table of Contents
| 4.9(a) | Indenture relating to senior debt securities, dated March 3,
1997, between Banc One Corporation (a predecessor to Bank
One Corporation) (succeeded through merger by JPMorgan
Chase & Co.) and The Chase Manhattan Bank, as Trustee. |
|||
| 4.9(b) | First Supplemental Indenture relating to senior debt securities,
dated as of October 2, 1998, between Banc One Corporation (a
predecessor to Bank One Corporation) (succeeded through
merger by JPMorgan Chase & Co.) and The Chase Manhattan
Bank, as Trustee. |
|||
| 4.9(c) | Form of Second Supplemental Indenture relating to senior debt
securities, dated as of July 1, 2004, among J.P. Morgan Chase &
Co. (now known as JPMorgan Chase & Co.), Bank One Corporation,
JPMorgan Chase Bank, as resigning Trustee, and Deutsche Bank
Trust Company Americas, as successor Trustee, to the Indenture,
dated as of March 3, 1997 (incorporated by reference to
Exhibit 4.22 to the Registration Statement on Form S-3 dated
July 1, 2004. (File No. 333-116822) of JPMorgan Chase & Co.) |
|||
| 4.10(a) | Indenture relating to subordinated debt securities, dated March
3, 1997, between Banc One Corporation (a predecessor to Bank
One Corporation) (succeeded through merger by JPMorgan
Chase & Co.) and The Chase Manhattan Bank, as Trustee. |
|||
| 4.10(b) | First Supplemental Indenture relating to subordinated debt securities dated October 2, 1998, between Banc One Corporation
(a predecessor to Bank One Corporation) (succeeded through
merger by JPMorgan Chase & Co.) and The Chase Manhattan
Bank, as Trustee. |
|||
| 4.10(c) | Second Supplemental Indenture relating to subordinated debt
securities, dated July 1, 2004, among J.P. Morgan Chase & Co.
(now known as JPMorgan Chase & Co.), Bank One Corporation,
JPMorgan Chase Bank, as resigning Trustee, and U.S. Bank Trust
National Association, as successor Trustee, to the Indenture
dated as of March 3, 1997 (incorporated by reference to Exhibit
4.25 to the Registration Statement on Form S-3 dated July 1,
2004. (File No. 333-116822) of JPMorgan Chase & Co.) |
|||
| 4.11(a) | Form of Indenture, dated July 1, 1995, between Banc One Corporation
(a predecessor to Bank One Corporation) (succeeded through
merger by JPMorgan Chase & Co.) and Citibank N.A, as Trustee. |
|||
| 4.11(b) | Form of Supplemental Indenture,
dated July 1, 2004, among J.P.
Morgan Chase & Co. (now known as JPMorgan Chase & Co.),
Bank One Corporation, and Citibank N.A. as resigning Trustee,
and U.S. Bank Trust National Association, as successor Trustee, to
the Indenture, dated as of July 1, 1995 (incorporated by reference
to Exhibit 4.27 to the Registration Statement on Form S-3 dated
July 1, 2004. (File No. 333-116822) of JPMorgan Chase & Co.) |
|||
| 4.12(a) | Form of Indenture, dated December 1, 1995, between First
Chicago NBC Corporation (a predecessor to Bank One Corporation)
(succeeded through merger by JPMorgan Chase & Co.) and The
Chase Manhattan Bank (National Association), as Trustee. |
|||
| 4.12(b) | Form of Supplemental Indenture, dated as of July 1, 2004, among
J.P. Morgan Chase & Co. (now known as JPMorgan Chase & Co.),
Bank One Corporation, JPMorgan Chase Bank (as successor to
The Chase Manhattan Bank (National Association), as resigning
Trustee, and U.S. Bank Trust National Association, as successor
Trustee, to the Indenture, dated as of December 1, 1995
(incorporated by reference to Exhibit 4.29 to the Registration
Statement on Form S-3 dated July 1, 2004. (File No. 333-116822)
of JPMorgan Chase & Co.) |
|||
| 10.1 | Deferred Compensation Plan for Non-Employee Directors of
The Chase Manhattan Corporation (now known as JPMorgan
Chase & Co.) and The Chase Manhattan Bank (now known as
JPMorgan Chase Bank, N.A.), as amended and restated effective
December, 1996. |
|||
| 10.2 | Post-Retirement Compensation Plan for Non-Employee Directors,
as amended and restated as of May 21, 1996. |
|||
| 10.3 | Deferred Compensation Program of JPMorgan Chase & Co. and
Participating Companies, effective as of January 1, 1996. |
|||
| 10.4 | Amended and Restated 1996 Long-Term Incentive Plan of The
Chase Manhattan Corporation (incorporated by reference to
Schedule 14A, filed on April 5, 2000, of The Chase Manhattan
Corporation, File No. 1-5805). |
|||
| 10.5(a) | The Chase Manhattan 1994 Long-Term Incentive Plan. |
|||
| 10.5(b) | Amendment to The Chase Manhattan 1994 Long-Term Incentive
Plan. |
|||
| 10.6 | Chemical Banking Corporation Long-Term Stock Incentive Plan,
as amended and restated as of May 19, 1992. |
|||
| 10.7 | Key Executive Performance Plan of JPMorgan Chase & Co., as
amended and restated January 1, 1999 (incorporated by reference to Proposal 4 of the Joint Proxy Statement, dated April 19,
2004, of J.P. Morgan Chase & Co. and Bank One Corporation). |
|||
| 10.8 | Excess Retirement Plan of The Chase Manhattan Bank and
Participating Companies, restated effective January 1, 1997
(incorporated by reference to Exhibit 10.14 to the Annual Report
on Form 10-K of J.P. Morgan Chase & Co. (File No. 1-5805) for
the year ended December 31, 2000). |
|||
| 10.9 | Form of J.P. Morgan &
Co. Incorporated Stock Option Award. |
|||
| 10.10 | 1992 J.P. Morgan & Co.
Incorporated Stock Incentive Plan, as amended. |
|||
| 10.11 | 1984 J.P. Morgan & Co.
Incorporated Stock Incentive Plan, as amended. |
|||
| 10.12 | 1995 J.P. Morgan & Co.
Incorporated Stock Incentive Plan, as amended. |
|||
| 10.13 | 1998 J.P. Morgan & Co.
Incorporated Performance Plan. |
|||
| 10.14 | Executive Retirement Plan of The Chase Manhattan Corporation
and Certain Subsidiaries (incorporated by reference to Exhibit
10.25 to the Annual Report on Form 10-K of J.P. Morgan Chase
& Co. (File No. 1-5805) for the year ended December 31, 2000). |
|||
15
Table of Contents
Part IV
| 10.15 | Benefit Equalization Plan of The Chase Manhattan Corporation
and Certain Subsidiaries (incorporated by reference to Exhibit
10.26 to the Annual Report on Form 10-K of J.P. Morgan Chase
& Co. (File No. 1-5805) for the year ended December 31, 2000). |
|||
| 10.16 | Summary of Terms of JPMorgan Chase & Co. Severance Policy. |
|||
| 10.17 | Employment Agreement between J. P. Morgan Chase & Co. and
James Dimon dated January 14, 2004 (incorporated by reference
to Exhibit 10.1 of the Registration Statement on Form S-4 dated
as of July 1, 2004 of J.P. Morgan Chase & Co. (File
No. 333-112967)). |
|||
| 10.18 | Summary of Terms of Pension
– William B. Harrison, Jr. (incorporated by reference to Form 8-K of JPMorgan Chase
& Co. dated February 28, 2005). |
|||
| 10.19 | Bank One Corporation Director
Stock Plan, as amended (incorporated by reference to
Exhibit 10(B) to the Form 10-K of Bank One Corporation for
the year ended December 31, 2003). |
|||
| 10.20 | Summary of Bank One Corporation
Director Deferred Compensation Plan (incorporated by reference to
Exhibit 10(M) to the Form 10-K of Bank One Corporation for
the year ended December 31, 2000). |
|||
| 10.21 | Bank One Corporation Stock
Performance Plan (incorporated by reference to Exhibit 10(A) to
the Form 10-K of Bank One Corporation for the year ended
December 31, 2002). |
|||
| 10.22 | Bank One Corporation Deferred
Compensation Plan, as amended (incorporated by reference to
Exhibit 10(D) to the Form 10-K of Bank One Corporation for
the year ended December 31, 2000). |
|||
| 10.23 | Bank One Corporation
Supplement Savings and Investment Plan, as amended (incorporated by
reference to Exhibit 10(E) to the Form 10-K of Bank One Corporation for
the year ended December 31, 2003). |
|||
| 10.24 | Bank One Corporation
Supplemental Personal Pension Account Plan, as amended (incorporated by reference to
Exhibit 10(F) to the Form 10-K of Bank One Corporation for
the year ended December 31, 2003). |
|||
| 10.25 | Bank One Corporation Key
Executive Change of Control Plan, as amended (incorporated by reference to
Exhibit 10(G) to the Form 10-K of Bank One Corporation for
the year ended December 31, 2003). |
|||
| 10.26 | Bank One Corporation Planning
Group annual Incentive Plan, as amended (incorporated by reference to
Exhibit 10(H) to the Form 10-K of Bank One Corporation for
the year ended December 31, 2003). |
|||
| 10.27 | Bank One Corporation Investment
Option Plan (incorporated by reference to
Exhibit 10(I) to the Form 10-K of Bank One Corporation for
the year ended December 31, 2003). |
|||
| 10.28 | First Chicago Corporation Stock
Incentive Plan. |
|||
| 10.29 | NBD Bancorp, Inc. Performance
Incentive Plan, as amended. |
|||
| 10.30 | Bank One Corporation Revised
and Restated 1989 Stock Incentive Plan. |
|||
| 10.31 | Bank One Corporation Revised
and Restated 1995 Stock Incentive Plan. |
|||
| 12.1 | Computation of ratio of earnings to fixed charges. |
|||
| 12.2 | Computation of ratio of earnings to fixed charges and preferred
stock dividend requirements. |
|||
| 21.1 | List of Subsidiaries of JPMorgan Chase & Co. |
|||
| 22.1 | Annual Report on Form 11-K of the JPMorgan Chase 401(k)
Savings Plan (to be filed by amendment pursuant to Rule 15d-21
under the Securities Exchange Act of 1934). |
|||
| 23.1 | Consent of independent registered public accounting firm. |
|||
| 31.1 | Certification. |
|||
| 31.2 | Certification. |
|||
| 31.3 | Certification. |
|||
| 32 | Certification pursuant to 18 U.S.C. Section 1350, as adopted
pursuant to Section 906 of the Sarbanes-Oxley Act of 2002. |
|||
JPMorgan Chase hereby agrees to furnish to the Securities and Exchange
Commission, upon request, copies of instruments defining the rights of
holders for the outstanding nonregistered long-term debt of JPMorgan
Chase and its subsidiaries and certain other long-term debt issued by
predecessor institutions of JPMorgan Chase and assumed by virtue of
the mergers with those respective institutions. These instruments have
not been filed as exhibits hereto by reason that the total amount of each
issue of such securities does not exceed 10% of the total assets of
JPMorgan Chase and its subsidiaries on a consolidated basis. In addition,
JPMorgan Chase hereby agrees to file with the Securities and Exchange
Commission, upon request, the Junior Subordinated Indentures, the
Guarantees and the Amended and Restated Trust Agreements for each
Delaware business trust subsidiary that has issued Capital Securities,
the guarantees for which have been assumed by JPMorgan Chase & Co.
by virtue of the mergers of the respective predecessor institutions that
originally issued such securities. The provisions of such agreements differ
from the documents constituting Exhibits 4.8(a), (b) and (c) to this report
only with respect to the pricing terms of each series of capital securities;
these pricing terms are disclosed in Note 17 on page 112.
|
||||
16
Table of Contents
Table of contents
Financial:
| Management’s discussion and analysis: | ||
| 18 | Introduction |
|
| 20 | Executive overview |
|
| 22 | Consolidated results of operations |
|
| 25 | Explanation and reconciliation of the Firm’s use of non-GAAP financial measures |
|
| 28 | Business segment results |
|
| 49 | Balance sheet analysis |
|
| 50 | Capital management |
|
| 52 | Off-balance sheet arrangements and contractual cash obligations |
|
| 54 | Risk management |
|
| 55 | Liquidity risk management |
|
| 57 | Credit risk management |
|
| 70 | Market risk management |
|
| 75 | Operational risk management |
|
| 76 | Reputation and fiduciary risk management |
|
| 76 | Private equity risk management |
|
| 77 | Critical accounting estimates used by the Firm |
|
| 80 | Nonexchange-traded commodity contracts at fair value |
|
| 80 | Accounting and reporting developments |
|
| Audited financial statements: | ||
| 82 | Management’s report on internal control over financial reporting |
|
| 83 | Report of independent registered public accounting firm |
|
| 84 | Consolidated financial statements |
|
| 88 | Notes to consolidated financial statements |
|
| Supplementary information: | ||
| 129 | Selected quarterly financial data |
|
| 130 | Five-year summary of consolidated financial highlights |
|
| 131 | Glossary of terms |
|
| JPMorgan Chase & Co. / 2004 Annual Report | 17 |
Table of Contents
Management’s discussion and analysis
This section of the Annual Report provides management’s discussion and analysis (“MD&A”) of the financial condition and results of operations for JPMorgan Chase. See the Glossary of terms on page 131 for a definition of terms used throughout this Annual Report. The MD&A included in this Annual Report contains statements that are forward-looking within the meaning of the Private Securities Litigation Reform Act of 1995. Such statements are based upon the current beliefs and expectations of JPMorgan Chase’s management and are subject to
significant risks and uncertainties. These risks and uncertainties could cause JPMorgan Chase’s results to differ materially from those set forth in such forward-looking statements. Such risks and uncertainties are described herein and in Part I, Item 1: Business, Important factors that may affect future results, in the JPMorgan Chase Annual Report on Form 10-K for the year ended December 31, 2004, filed with the Securities and Exchange Commission and available at the Commission’s website (www.sec.gov), to which reference is hereby made.
Introduction
JPMorgan Chase & Co. (“JPMorgan Chase” or the “Firm”), a financial holding company incorporated under Delaware law in 1968, is a leading global financial services firm and one of the largest banking institutions in the United States, with $1.2 trillion in assets, $106 billion in stockholders’ equity and operations in more than 50 countries. The Firm is a leader in investment banking, financial services for consumers and businesses, financial transaction processing, investment management, private banking and private equity. JPMorgan Chase serves more than 90 million customers, including consumers nationwide and many of the world’s most prominent wholesale clients.
JPMorgan Chase’s principal bank subsidiaries are JPMorgan Chase Bank, National Association (“JPMorgan Chase Bank”), a national banking association with branches in 17 states; and Chase Bank USA, National Association, a national bank headquartered in Delaware that is the Firm’s credit card issuing bank. JPMorgan Chase’s principal nonbank subsidiary is J.P. Morgan Securities Inc. (“JPMSI”), its U.S. investment banking firm.
The headquarters for JPMorgan Chase is in New York City. The retail banking business, which includes the consumer banking, small business banking and consumer lending activities with the exception of credit card, is headquartered in Chicago. Chicago also serves as the headquarters for the commercial banking business.
JPMorgan Chase’s activities are organized, for management reporting purposes, into six business segments, as well as Corporate. The Firm’s wholesale businesses are comprised of the Investment Bank, Commercial Banking, Treasury & Securities Services, and Asset & Wealth Management. The Firm’s consumer businesses are comprised of Retail Financial Services and Card Services. A description of the Firm’s business segments, and the products and services they provide to their respective client bases, follows:
Investment Bank
Retail Financial Services
home mortgages. Consumer & Small Business Banking offers one of the largest branch networks in the United States, covering 17 states with 2,508 branches and 6,650 automated teller machines. Auto & Education Finance is the largest bank originator of automobile loans as well as a top provider of loans for college students. Through its Insurance operations, the Firm sells and underwrites an extensive range of financial protection products and investment alternatives, including life insurance, annuities and debt protection products.
Card Services
Commercial Banking
Treasury & Securities Services
Asset & Wealth Management
| 18 | JPMorgan Chase & Co./2004 Annual Report |
Table of Contents
services. AWM delivers investment management to institutional investors across all asset classes. The Private bank and Private client services businesses provide integrated wealth management services to ultra-high-net-worth and high-net-worth clients, respectively.
Merger with Bank One Corporation
Effective July 1, 2004, Bank One Corporation (“Bank One”) merged with and into JPMorgan Chase (the “Merger”), pursuant to an Agreement and Plan of Merger dated January 14, 2004. As a result of the Merger, each outstanding share of common stock of Bank One was converted in a stock-for-stock exchange into 1.32 shares of common stock of JPMorgan Chase. The Merger was accounted for using the purchase method of accounting. The purchase price to complete the Merger was $58.5 billion. Key objectives of the Merger were to provide the Firm with a more balanced business mix and greater geographic diversification.
Bank One’s results of operations were included in the Firm’s results beginning July 1, 2004. Therefore, the results of operations for the 12 months ended December 31, 2004, reflect six months of operations of the combined Firm and six months of heritage JPMorgan Chase; the results of operations for all other periods prior to 2004 reflect only the operations of heritage JPMorgan Chase.
It is expected that cost savings of approximately $3.0 billion (pre-tax) will be achieved by the end of 2007; approximately two-thirds of the savings are anticipated to be realized by the end of 2005. Total 2004 Merger savings were approximately $400 million. Merger costs to combine the operations of JPMorgan Chase and Bank One are expected to range from approximately $4.0 billion to $4.5 billion (pre-tax). Of these costs, approximately $1.0 billion, specifically related to Bank One, were accounted for as purchase accounting adjustments and were recorded as an increase to goodwill in 2004. Of the approximately $3.0 billion to $3.5 billion in remaining Merger-related costs, $1.4 billion (pre-tax) were incurred in 2004 and have been charged to income, $1.4 billion (pre-tax) are expected to be incurred in 2005, and the remaining costs are expected to be incurred in 2006. These estimated Merger-related charges will result from actions taken with respect to both JPMorgan Chase’s and Bank One’s operations, facilities and employees. The charges will be recorded based on the nature and timing of these integration actions.
As part of the Merger, certain accounting policies and practices were conformed, which resulted in $976 million (pre-tax) of charges in 2004. The significant components of the conformity charges were comprised of a $1.4 billion (pre-tax) charge related to the decertification of the seller’s interest in credit card securitizations, and the benefit of a $584 million reduction in the allowance for credit losses as a result of conforming the wholesale and consumer credit provision methodologies.
Other business events
Electronic Financial Services
Cazenove
Highbridge
Vastera
| JPMorgan Chase & Co./2004 Annual Report | 19 |
Table of Contents
Management’s discussion and analysis
Executive overview
This overview of management’s discussion and analysis highlights selected information and may not contain all of the information that is important to readers of this Annual Report. This overview discusses the economic or industry-wide factors that affected JPMorgan Chase, the factors that drove business performance, and the factors that management monitors in setting policy. For a more complete understanding of trends, events, commitments, uncertainties, liquidity, capital resources and critical accounting estimates, this entire Annual Report should be read carefully.
Financial performance of JPMorgan Chase
| As of or for the year ended December 31, (a) | ||||||||||||
| (in millions, except per share and ratio data) | 2004 | 2003 | Change | |||||||||
Total net revenue |
$ | 43,097 | $ | 33,384 | 29 | % | ||||||
Provision for credit losses |
2,544 | 1,540 | 65 | |||||||||
Noninterest expense |
34,359 | 21,816 | 57 | |||||||||
Net income |
4,466 | 6,719 | (34 | ) | ||||||||
Net income per share — diluted |
1.55 | 3.24 | (52 | ) | ||||||||
Average common equity |
75,641 | 42,988 | 76 | |||||||||
Return on average common equity(“ROCE”) |
6 | % | 16 | % | (1,000 | )bp | ||||||
Loans |
$ | 402,114 | $ | 214,766 | 87 | % | ||||||
Total assets |
1,157,248 | 770,912 | 50 | |||||||||
Deposits |
521,456 | 326,492 | 60 | |||||||||
Tier 1 capital ratio |
8.7 | % | 8.5 | % | 20 | bp | ||||||
Total capital ratio |
12.2 | 11.8 | 40 | |||||||||
| (a) | 2004 results include six months of the combined Firm’s results and six months of heritage
JPMorgan Chase results. 2003 reflects the results of heritage JPMorgan Chase only. |
Business overview
The Firm’s results in 2004 were affected by many factors, but the most significant of these were the Merger, the litigation charge taken in the second quarter of the year and global economic growth.
The Firm reported 2004 net income of $4.5 billion, or $1.55 per share, compared with net income of $6.7 billion, or $3.24 per share, for 2003. The return on common equity was 6%, compared with 16% in 2003. Results included $3.7 billion in after-tax charges, or $1.31 per share, comprised of: Merger costs of $846 million; charges to conform accounting policies as a result of the Merger of $605 million; and a charge of $2.3 billion to increase litigation reserves. Excluding these charges, operating earnings would have been $8.2 billion, or $2.86 per share, and return on common equity would have been 11%. Operating earnings represent business results without the merger-related costs and the significant litigation charges.
During the course of the year, the Firm developed a comprehensive plan of Merger integration and began to execute on the plan. Significant milestones during the year included: branding decisions for all businesses; merger of the holding companies, lead banks and credit card banks; conversion of the Bank One credit card portfolio to a new processing platform; announcement of insourcing of major technology operations; and consolidation and standardization of human resource policies and benefit plans. As part of the Merger, the Firm announced that it had targeted reducing operating expenses by $3.0 billion (pre-tax) by the end of 2007. In order to accomplish the cost reductions, the Firm announced that it expects to incur Merger costs of approximately $4.0 billion to $4.5 billion and reduce its workforce by approximately 12,000 over the same time period.
In 2004, both the U.S. and global economies continued to strengthen overall, even though momentum slowed during the second half of the year due to rising oil prices. Gross domestic product increased by 3.9% globally and 4.4% in the U.S., both up from 2003. The U.S. economy experienced rising short-term interest rates, driven by Federal Reserve Board (“FRB”) actions during the course of the year. The federal funds rate increased from 1.00% to 2.25% during the year and the yield curve flattened, as long-term interest rates were relatively stable. Equity markets, both domestic and international, enjoyed strong results, with the S&P 500 up 9% and international indices increasing in similar fashion. Capital markets activity during 2004 was healthy, debt underwriting was consistent with the strong levels experienced in 2003, and equity underwriting enjoyed strong and consistent activity during the year. The U.S. consumer sector showed continued strength buoyed by the overall economic strength, despite slowing mortgage origination and refinance activity. Retail sales were up over the prior year, and bankruptcy filings were down significantly from 2003.
On an operating basis, net income in each of the Firm’s lines of business was affected primarily by the Merger. The discussion that follows highlights other factors which affected operating results in each business.
Despite the relatively beneficial capital markets environment, results for the Investment Bank were under pressure during the year. This was primarily due to a decline in trading revenue related to lower fixed income trading, driven by weaker portfolio management results, and a reduction in net interest income, stemming primarily from lower loan balances. This was partially offset by increased investment banking fees, the result of continued strength in debt underwriting, and higher advisory fees. The Investment Bank benefited from a reduction in the allowance for credit losses, primarily due to the improved credit quality of the loan portfolio, as evidenced by the significant drop in nonperforming loans and, to a lesser extent, recoveries of previously charged-off loans. Expenses rose, primarily due to higher compensation expenses.
Retail Financial Services benefited from better spreads earned on deposits and growth in retained residential mortgage and home equity loan balances. Mortgage fees and related income was also up, reflecting higher mortgage servicing revenue, partially offset by significantly lower prime mortgage production income related to the slower mortgage origination activity. The Provision for credit losses benefited from improved credit quality in nearly all portfolios and a reduction in the allowance for credit losses related to the sale of a $4 billion manufactured home loan portfolio. Higher compensation expenses were due to continued expansion of the branch office network, including 130 new locations (106 net additional branches) opened during 2004 for the combined Firm, and expansion of the sales force, partially offset by ongoing efficiency improvements.
Card Services revenue benefited from higher loan balances and customer charge volume, which increased net interest income and higher net interchange income, respectively. Expenses increased due to higher marketing spending and higher volume-based processing expenses.
Commercial Banking revenues benefited from strong deposit growth and higher investment banking fees. These benefits were partially offset by lower service charges on deposits, which often decline when interest rates rise. Credit quality continued to improve, resulting in lower net charge-offs and nonperforming loans.
| 20 | JPMorgan Chase & Co./2004 Annual Report |
Table of Contents
Treasury & Securities Services revenues benefited from strong growth in assets under custody and average deposits, along with deposit spreads, which improved due to the relatively low interest rate environment for deposits. These benefits were offset by lower service charges on deposits, which often decline when interest rates rise. Revenues and expenses also were affected by acquisitions, divestitures and growth in business volume. Expenses also increased due to software impairment charges, and legal and technology-related expenses.
Asset & Wealth Management results were positively affected by the strength of global equity markets, an improved product mix, better investment performance and net asset inflows. Results also benefited from deposit and loan growth.
The Corporate segment performance was negatively affected by a repositioning of the investment securities portfolio and tighter spreads. This was partially offset by improved Private Equity results due to an improved climate for investment sales.
The Firm’s balance sheet was likewise significantly affected by the Merger. Aside from the Merger, the Firm took a number of actions during the year to strengthen the balance sheet. Notably, the Treasury investment portfolio was repositioned to reduce exposure to rising interest rates; auto leasing was de-emphasized, and lease receivables were reduced by 16% to $8 billion; the $4 billion manufactured home loan portfolio was sold; the $2 billion recreational vehicle portfolio was sold subsequent to year-end; a significant portion of third-party private equity investments have been sold; and the Firm increased its litigation reserves. The Firm’s capital base was also significantly enhanced following the Merger. As of year-end, total stockholders’ equity was $106 billion, and the Tier 1 capital ratio was 8.7%. The capital position allowed the Firm to begin repurchasing common stock during the second half of the year, with more than $700 million, or 19.3 million common shares, repurchased during the year.
2005 business outlook
JPMorgan Chase’s outlook for 2005 should be viewed against the backdrop of the global economy, financial markets and the geopolitical environment, all of which are integrally linked together. While the Firm considers outcomes for, and has contingency plans to respond to, stress environments, its basic outlook for 2005 is predicated on the interest rate movements implied in the forward rate curve for U.S. Treasuries, the continuation of the favorable U.S. and international equity markets and continued expansion of the global economy.
The performance of the Firm’s capital markets businesses is highly correlated to overall global economic growth. The Investment Bank enters 2005 with a strong pipeline for advisory and underwriting business, and it continues to focus on growing its client-driven trading business. Compared with 2004, the Investment Bank expects a reduction in credit portfolio revenues, as both net interest income on loans and gains from workouts are likely to decrease. Financial market movements and activity levels also affect Asset & Wealth Management and Treasury & Securities Services. Asset & Wealth Management anticipates revenue growth, driven by net inflows to Assets under supervision and by the Highbridge acquisition, as well as deposit and loan growth. Treasury & Securities Services anticipates modest revenue growth, due to wider spreads on deposits, as well as increased business volume and activity in the custody, trade, commercial card, American Depositary Receipt and Collateralized Debt Obligation businesses. Commercial Banking anticipates that net revenues will benefit from growth in treasury services and investment banking fees, offset by margin compression on loans.
The business outlook varies for the respective consumer businesses. Card Services anticipates modest growth in consumer spending and in card outstandings. For RFS, Home Finance earnings are likely to weaken given a market-driven decline in mortgage originations, neutralizing the expected earnings increase in Consumer & Small Business Banking. The drop in revenue at Home Finance should be mitigated by ongoing efforts to bring expenses in line with lower expected origination volumes. Growth is expected to continue in Consumer & Small Business Banking, with increases in core deposits and associated revenue partially offset by ongoing investments in the branch distribution network. New branch openings should continue at a pace consistent with or slightly above those of 2004. At the heritage Chase branches, expanded hours and realigned compensation plans that tie incentives to branch performance are expected to provide improvements in productivity and incremental net revenue growth. Earnings in Auto & Education Finance are expected to remain under pressure, given the current competitive operating environment. Across all RFS businesses, credit quality trends remain stable, with a slight increase in credit costs likely in 2005.
The Corporate sector includes Private Equity, Treasury and the corporate support units. The revenue outlook for the Private Equity business is directly related to the strength of equity market conditions in 2005. If current market conditions persist, the Firm anticipates continued realization of private equity gains; the Firm is not anticipating investment securities gains from the Treasury portfolio in 2005.
The Provision for credit losses in 2005 is anticipated to be higher than in 2004, driven primarily by a return to a more normal level of provisioning for credit losses in the wholesale businesses over time. The consumer Provision for credit losses in 2005 should reflect increased balances, with generally stable credit quality. The Firm plans to implement higher minimum-payment requirements in the Card Services business in the third quarter of 2005; it is anticipated that this will increase delinquency and net charge-off rates, but the magnitude of the impact is currently being assessed.
The Firm’s 2005 expenses should reflect the realization of $1.5 billion in merger savings. These savings are expected to be offset by a projected $1.1 billion of incremental spending related to firmwide technology infrastructure, distribution enhancement, and product improvement and expansion in Retail Financial Services, the Investment Bank and Asset & Wealth Management. In addition, expenses will increase as a result of recent acquisitions, such as Highbridge and Cazenove.
Management will seek to continue to strengthen the Firm’s balance sheet through rigorous financial and risk discipline. Any capital generated in excess of the Firm’s capital targets, and beyond that required to support anticipated modest growth in assets and the underlying risks of the Firm’s businesses, including litigation risk, will create capital flexibility in 2005 with respect to common stock repurchases and further investments in the Firm’s businesses.
| JPMorgan Chase & Co./2004 Annual Report | 21 |
Table of Contents
Management’s discussion and analysis
Consolidated results of operations
The following section provides a comparative discussion of JPMorgan Chase’s consolidated results of operations on a reported basis for the three-year period ended December 31, 2004. Factors that are primarily related to a single business segment are discussed in more detail within that business segment than they are in this consolidated section. For a discussion of the Critical accounting estimates used by the Firm that affect the Consolidated results of operations, see pages 77-79 of this Annual Report.
Revenue
| Year ended December 31,(a) | ||||||||||||
| (in millions) | 2004 | 2003 | 2002 | |||||||||
Investment banking fees |
$ | 3,537 | $ | 2,890 | $ | 2,763 | ||||||
Trading revenue |
3,612 | 4,427 | 2,675 | |||||||||
Lending & deposit related fees |
2,672 | 1,727 | 1,674 | |||||||||
Asset management, administration
and commissions |
7,967 | 5,906 | 5,754 | |||||||||
Securities/private equity gains |
1,874 | 1,479 | 817 | |||||||||
Mortgage fees and related income |
1,004 | 923 | 988 | |||||||||
Credit card income |
4,840 | 2,466 | 2,307 | |||||||||
Other income |
830 | 601 | 458 | |||||||||
Noninterest revenue |
26,336 | 20,419 | 17,436 | |||||||||
Net interest income |
16,761 | 12,965 | 12,178 | |||||||||
Total net revenue |
$ | 43,097 | $ | 33,384 | $ | 29,614 | ||||||
| (a) | 2004 results include six months of the combined Firm’s results and six months of heritage
JPMorgan Chase results. All other periods reflect the results of heritage JPMorgan Chase only. |
2004 compared with 2003
The increase in Investment banking fees was driven by significant gains in underwriting and advisory activities as a result of increased global market volumes and market share gains. Trading revenue declined by 18%, primarily due to lower portfolio management results in fixed income and equities. For a further discussion of Investment banking fees and Trading revenue, which are primarily recorded in the IB, see the IB segment results on pages 30-32 of this Annual Report.
Lending & deposit related fees were up from 2003 due to the Merger. The rise was partially offset by lower service charges on deposits, as clients paid for services with deposits, versus fees, due to rising interest rates. Throughout 2004, deposit balances grew in response to rising interest rates.
The increase in Asset management, administration and commissions was also driven by the full-year impact of other acquisitions - such as EFS in January 2004, Bank One’s Corporate Trust business in November 2003 and JPMorgan
Retirement Plan Services in June 2003 - as well as the effect of global equity market appreciation, net asset inflows and a better product mix. In addition, a more active market for trading activities in 2004 resulted in higher brokerage commissions. For additional information on these fees and commissions, see the segment discussions for AWM on pages 45-46, TSS on pages 43-44 and RFS on pages 33-38 of this Annual Report.
Securities/private equity gains for 2004 rose from the prior year, primarily fueled by the improvement in the Firm’s private equity investment results. This was offset by lower securities gains on the Treasury investment portfolio as a result of lower volumes of securities sold, and lower gains realized on sales due to higher interest rates; additionally, RFS’s Home Finance business reported losses in 2004 on available-for-sale (“AFS”) securities, as compared with gains in 2003. For a further discussion of securities gains, see the RFS and Corporate segment discussions on pages 33-38 and 47-48, respectively, of this Annual Report. For a further discussion of Private equity gains, which are primarily recorded in the Firm’s Private Equity business, see the Corporate segment discussion on pages 47-48 of this Annual Report.
Mortgage fees and related income rose as a result of higher servicing revenue; this improvement was partially offset by lower mortgage servicing rights (“MSRs”) asset risk management results and prime mortgage production revenue, and lower gains from sales and securitizations of subprime loans as a result of management’s decision in 2004 to retain these loans. Mortgage fees and related income excludes the impact of NII and securities gains related to home mortgage activities. For a discussion of Mortgage fees and related income, which is primarily recorded in RFS’s Home Finance business, see the Home Finance discussion on pages 34-36 of this Annual Report.
Credit card income increased from 2003 as a result of higher customer charge volume, which resulted in increased interchange income, and higher credit card servicing fees associated with the increase of $19.4 billion in average securitized loans. The increases were partially offset by higher volume-driven payments to partners and rewards expense. For a further discussion of Credit card income, see CS’s segment results on pages 39-40 of this Annual Report.
The increase in Other income from 2003 reflected gains on leveraged lease transactions and higher net results from corporate and bank-owned life insurance policies. These positive factors in 2004 were partially offset by gains on sales of several nonstrategic businesses and real estate properties in 2003.
Net interest income rose from 2003 as growth in volumes of consumer loans and deposits, as well as wider spreads on deposits, contributed to higher net interest income. These were partially offset by lower wholesale loan balances in the IB and tighter spreads on loans, investment securities and trading assets stemming from the rise in interest rates. The Firm’s total average interest-earning assets for 2004 were $744.1 billion, up $154.2 billion from 2003. Growth was also driven by higher levels of consumer loans. The net interest yield on these assets, on a fully taxable-equivalent basis, was 2.27% in 2004, an increase of 6 basis points from the prior year.
2003 compared with 2002
| 22 | JPMorgan Chase & Co./2004 Annual Report |
Table of Contents
Investment banking fees increased by $127 million, primarily due to growth in IB’s equity underwriting, which was up 49%, reflecting increases in market share and underwriting volumes. This increase was partially offset by lower advisory fees reflecting depressed levels of M&A activity. Trading revenue was up $1.8 billion, or 65%, primarily due to strong client and portfolio management revenue growth in fixed income and equity markets as a result of the low-interest rate environment, improvement in equity markets and volatility in credit markets. For a further discussion of Investment banking fees and Trading revenue, which are primarily recorded in the Investment Bank, see the IB segment results on pages 30-32 of this Annual Report.
Lending & deposit related fees rose, the result of higher fees on standby letters of credit, due to growth in transaction volume, and higher service charges on deposits. These charges were driven by an increase in the payment of services with fees, versus deposits, due to lower interest rates.
The increase in Asset management, administration and commissions was attributable to a more favorable environment for debt and equity activities, resulting in higher fees for the custody, institutional trust, brokerage and other processing-related businesses. Fees for investment management activities also increased as a result of acquisitions in AWM, but these increases were partially offset by institutional net fund outflows, which resulted in lower average assets under management.
Securities/private equity gains increased to $1.5 billion from $817 million in 2002, reflecting significant improvement in private equity gains. These gains were partially offset by lower gains realized from the sale of securities in Treasury and of AFS securities in RFS’s Home Finance business, driven by increasing interest rates beginning in the third quarter of 2003. For a further discussion of private equity gains (losses), see the Corporate segment discussion on pages 47-48 of this Annual Report.
Mortgage fees and related income declined by 7% in 2003, primarily due to a decline in revenue associated with risk management of the MSR asset, mortgage pipeline and mortgage warehouse; these were partially offset by higher fees from origination and sales activity and other fees derived from volume and market-share growth. For a discussion of Mortgage fees and related income, which is primarily recorded in RFS’s Home Finance business, see the Home Finance discussion on pages 34-36 of this Annual Report.
Credit card income rose as a result of higher credit card servicing fees associated with the $6.7 billion growth in average securitized credit card receivables. For a further discussion of Credit card income, see CS’s segment results on pages 39-40 of this Annual Report.
Other income rose, primarily from $200 million in gains on sales of securities acquired in loan workouts (compared with $26 million in 2002), as well as gains on the sale of several nonstrategic businesses and real estate properties; these were partly offset by lower net results from corporate and bank-owned life insurance policies. In addition, 2002 included $73 million of write-downs for several Latin American investments.
The increase in Net interest income reflected the positive impact of lower interest rates on consumer loan originations, such as mortgages and automobile loans and leases and related funding costs. Net interest income was partially reduced by a lower volume of wholesale loans and lower spreads on investment securities. The Firm’s total average interest-earning assets in 2003 were $590 billion, up 6% from the prior year. The net interest yield on these assets, on a fully taxable-equivalent basis, was 2.21%, the same as in the prior year.
Provision for credit losses
2004 compared with 2003
2003 compared with 2002
Noninterest expense
| Year ended December 31,(a) | ||||||||||||
| (in millions) | 2004 | 2003 | 2002 | |||||||||
Compensation expense |
$ | 14,506 | $ | 11,387 | $ | 10,693 | ||||||
Occupancy expense |
2,084 | 1,912 | 1,606 | |||||||||
Technology and communications
expense |
3,702 | 2,844 | 2,554 | |||||||||
Professional & outside services |
3,862 | 2,875 | 2,587 | |||||||||
Marketing |
1,335 | 710 | 689 | |||||||||
Other expense |
2,859 | 1,694 | 1,802 | |||||||||
Amortization of intangibles |
946 | 294 | 323 | |||||||||
Total noninterest expense
before merger costs and
litigation reserve charge |
29,294 | 21,716 | 20,254 | |||||||||
Merger costs |
1,365 | — | 1,210 | |||||||||
Litigation reserve charge |
3,700 | 100 | 1,300 | |||||||||
Total noninterest expense |
$ | 34,359 | $ | 21,816 | $ | 22,764 | ||||||
| (a) | 2004 results include six months of the combined Firm’s results and six months of heritage
JPMorgan Chase results. All other periods reflect the results of heritage JPMorgan Chase only. |
2004 compared with 2003
Compensation expense was up from 2003, primarily due to strategic investments in the IB and continuing expansion in RFS. These factors were partially offset by ongoing efficiency improvements and merger-related savings throughout the Firm, and a reduction in pension costs. The decline in pension costs was mainly attributable to the increase in the expected return on plan assets from a discretionary $1.1 billion contribution to the Firm’s pension
| JPMorgan Chase & Co./2004 Annual Report | 23 |
Table of Contents
Management’s discussion and analysis
plan in April 2004, partially offset by changes in actuarial assumptions for 2004 compared with 2003. For a detailed discussion of pension and other postretirement benefit costs, see Note 6 on pages 92-95 of this Annual Report.
The increase in Occupancy expense was partly offset by lower charges for excess real estate, which were $103 million in 2004, compared with $270 million in 2003.
Technology and communications expense was higher than in the prior year as a result of higher costs associated with greater use of outside vendors, primarily IBM, to support the global infrastructure requirements of the Firm. After the Merger, JPMorgan Chase decided to terminate its outsourcing agreement with IBM, effective December 31, 2004. For a further discussion regarding the IBM outsourcing agreement, see the Corporate segment discussion on page 47 of this Annual Report.
Professional & outside services rose due to higher legal costs associated with pending litigation matters, as well as outside services stemming from recent acquisitions, primarily EFS, and growth in business at TSS and CS.
Marketing expense rose as CS initiated a more robust marketing campaign during 2004.
Other expense was up due to software impairment write-offs of $224 million, primarily in TSS and Corporate, compared with $60 million in 2003; higher accruals for non-Enron-related litigation cases; and the impact of growth in business volume. These were partly offset by a $57 million settlement related to the Enron surety bond litigation.
For a discussion of Amortization of intangibles and Merger costs, refer to Note 15 and Note 8 on pages 109-111 and 98, respectively.
In June of 2004, JPMorgan Chase recorded a $3.7 billion (pre-tax) addition to the Litigation reserve. While the outcome of litigation is inherently uncertain, the addition reflected management’s assessment of the appropriate reserve level in light of all then-known information. By comparison, 2003 included a charge of $100 million for Enron-related litigation.
2003 compared with 2002
The increase in Compensation expense principally reflected higher performance-related incentives, as well as higher pension and other postretirement benefit costs, primarily as a result of changes in actuarial assumptions. The increase pertaining to incentives included $266 million as a result of adopting SFAS 123, and $120 million from the reversal in 2002 of previously accrued expenses for certain forfeitable key employee stock awards. Total compensation expenses declined as a result of the transfer, beginning April 1, 2003, of 2,800 employees to IBM in connection with the aforementioned technology outsourcing agreement.
The increase in Occupancy expense reflected costs of additional leased space in midtown Manhattan and in the South and Southwest regions of the United States, higher real estate taxes in New York City and the cost of enhanced
safety measures. Also contributing to the increase were charges for unoccupied excess real estate of $270 million; this compared with $120 million in 2002.
Technology and communications expense increased primarily due to a shift in expenses: costs that were previously associated with Compensation and Other expenses shifted, upon the commencement of the IBM outsourcing agreement, to Technology and communications expense. Also contributing to the increase were higher costs related to software amortization. For a further discussion of the IBM outsourcing agreement, see Corporate on page 47 of this Annual Report.
Professional & outside services rose, reflecting greater utilization of third-party vendors for processing activities and higher legal costs associated with various litigation and business-related matters.
Higher Marketing expense was driven by more robust campaigns for the Home Finance business.
The decrease in Other expense was due partly to expense management initiatives, such as reduced allowances to expatriates and recruitment costs.
There were no Merger costs in 2003. In 2002, merger and restructuring costs of $1.2 billion were for programs announced prior to January 1, 2002.
The Firm added $100 million to the Enron-related litigation reserve in 2003 to supplement a $1.3 billion reserve initially recorded in 2002. The 2002 reserve was established to cover Enron-related matters, as well as certain other material litigation, proceedings and investigations in which the Firm is involved.
Income tax expense
The Firm’s Income before income tax expense, Income tax expense and effective tax rate were as follows for each of the periods indicated:
| Year ended December 31,(a) | ||||||||||||
| (in millions, except rate) | 2004 | 2003 | 2002 | |||||||||
Income before income tax expense |
$ | 6,194 | $ | 10,028 | $ | 2,519 | ||||||
Income tax expense |
1,728 | 3,309 | 856 | |||||||||
Effective tax rate |
27.9 | % | 33.0 | % | 34.0 | % | ||||||
| (a) | 2004 results include six months of the combined Firm’s results and six months of
heritage JPMorgan Chase results. All other periods reflect the results of heritage
JPMorgan Chase only. |
2004 compared with 2003
2003 compared with 2002
| 24 | JPMorgan Chase & Co./2004 Annual Report |
Table of Contents
Explanation and reconciliation of the Firm’s use of non-GAAP financial measures
The Firm prepares its Consolidated financial statements using accounting principles generally accepted in the United States of America (“U.S. GAAP”); these financial statements appear on pages 84-87 of this Annual Report. That presentation, which is referred to as “reported basis,” provides the reader with an understanding of the Firm’s results that can be consistently tracked from year to year and enables a comparison of the Firm’s performance with other companies’ U.S. GAAP financial statements.
In addition to analyzing the Firm’s results on a reported basis, management reviews line-of-business results on an “operating basis,” which is a non-GAAP financial measure. The definition of operating basis starts with the reported U.S. GAAP results. In the case of the IB, operating basis noninterest revenue includes, in Trading revenue, net interest income related to trading activities. Trading activities generate revenues, which are recorded for U.S. GAAP purposes in two line items on the income statement: Trading revenue, which includes the mark-to-market gains or losses on trading positions, and Net interest income, which includes the interest income or expense related to those positions. Combining both the trading revenue and related net interest income enables management to evaluate the IB’s trading activities, by considering all revenue related to these activities, and facilitates operating comparisons to other competitors. The following table reclassifies the Firm’s trading-related Net interest income to Trading revenue.
Trading-related Net interest income reclassification
| Year ended December 31,(a) | ||||||||||||
| (in millions) | 2004 | 2003 | 2002 | |||||||||
Net interest income – reported |
$ | 16,761 | $ | 12,965 | $ | 12,178 | ||||||
Trading-related NII |
(1,950 | ) | (2,129 | ) | (1,880 | ) | ||||||
Net interest income – adjusted |
$ | 14,811 | $ | 10,836 | $ | 10,298 | ||||||
Trading revenue – reported (b) |
$ | 3,612 | $ | 4,427 | $ | 2,675 | ||||||
Trading-related NII |
1,950 | 2,129 | 1,880 | |||||||||
Trading revenue – adjusted (b) |
$ | 5,562 | $ | 6,556 | $ | 4,555 | ||||||
| (a) | 2004 results include six months of the combined Firm’s results and six months of
heritage JPMorgan Chase results. All other periods reflect the results of heritage
JPMorgan Chase only. |
|
| (b) | Reflects Trading revenue at the Firm level. The majority of Trading revenue is
recorded in
the Investment Bank. |
In addition, segment results reflect revenues on a tax-equivalent basis. The tax-equivalent gross-up for each business segment is based upon the level, type and tax jurisdiction of the earnings and assets within each business segment. Operating revenue for the Investment Bank includes tax-equivalent adjustments for income tax credits primarily related to affordable housing investments as well as tax-exempt income from municipal bond investments. Information prior to the Merger has not been restated to conform with this new presentation. The amount of the tax-equivalent gross-up for each business segment is eliminated within the Corporate segment. For a further discussion of trading-related revenue and tax-equivalent adjustments made to operating revenue, see the IB on pages 30-32 of this Annual Report.
In the case of Card Services, operating or managed basis excludes the impact of credit card securitizations on revenue, the Provision for credit losses, net charge-offs and loan receivables. Through securitization the Firm transforms a portion of its credit card receivables into securities, which are sold to investors. The credit card receivables are removed from the consolidated balance sheet through the transfer of principal credit card receivables to a trust, and the sale of undivided interests to investors that entitle the investors to specific cash flows generated from the credit card receivables. The Firm retains the remaining undivided interests as seller’s interests, which are recorded in Loans on the Consolidated balance sheet. A gain or loss on the sale of credit card receivables to investors is recorded in Other income. Securitization also affects the Firm’s consolidated income statement by reclassifying as credit card income, interest income, certain fee revenue, and recoveries in excess of interest paid to the investors, gross credit losses and other trust expenses related to the securitized receivables. For a reconciliation of reported to managed basis of Card Services results, see page 40 of this Annual Report. For information regarding loans and residual interests sold and securitized, see Note 13 on pages 103-106 of this Annual Report. JPMorgan Chase uses the concept of “managed receivables” to evaluate the credit performance and overall financial performance of the underlying credit card loans, both sold and not sold; as the same borrower is continuing to use the credit card for ongoing charges, a borrower’s credit performance will affect both the loan receivables sold under SFAS 140 and those not sold. Thus, in its disclosures regarding managed loan receivables, JPMorgan Chase treats the sold receivables as if they were still on the balance sheet in order to disclose the credit performance (such as net charge-off rates) of the entire managed credit card portfolio. In addition, Card Services operations are funded, operating results are evaluated and decisions about allocating resources such as employees and capital are based on managed financial information.
Finally, operating basis excludes Merger costs, the Litigation reserve charge and accounting policy conformity adjustments related to the Merger, as management believes these items are not part of the Firm’s normal daily business operations (and, therefore, are not indicative of trends) and do not provide meaningful comparisons with other periods.
Management uses certain non-GAAP financial measures at the segment level. Management believes these non-GAAP financial measures provide information to investors in understanding the underlying operational performance and trends of the particular business segment and facilitate a comparison of the business segment with the performance of competitors.
| JPMorgan Chase & Co./2004 Annual Report | 25 |
Table of Contents
Management’s discussion and analysis
The following summary table provides a reconciliation from the Firm’s reported GAAP results to operating results:
(Table continues on next page)
| Year ended December 31,(a) | 2004 | 2003 | ||||||||||||||||||||||||||||||
| (in millions, except | Reported | Credit | Special | Operating | Reported | Credit | Special | Operating | ||||||||||||||||||||||||
| per share and ratio data) | results | card (b) | items | basis | results | card (b) | items | basis | ||||||||||||||||||||||||
Revenue |
||||||||||||||||||||||||||||||||
Investment banking fees |
$ | 3,537 | $ | — | $ | — | $ | 3,537 | $ | 2,890 | $ | — | $ | — | $ | 2,890 | ||||||||||||||||
Trading revenue(c) |
5,562 | — | — | 5,562 | 6,556 | — | — | 6,556 | ||||||||||||||||||||||||
Lending & deposit
related fees |
2,672 | — | — | 2,672 | 1,727 | — | — | 1,727 | ||||||||||||||||||||||||
Asset management,
administration and
commissions |
7,967 | — | — | 7,967 | 5,906 | — | — | 5,906 | ||||||||||||||||||||||||
Securities/private
equity gains |
1,874 | — | — | 1,874 | 1,479 | — | — | 1,479 | ||||||||||||||||||||||||
Mortgage fees and
related income |
1,004 | — | — | 1,004 | 923 | — | — | 923 | ||||||||||||||||||||||||
Credit card income |
4,840 | (2,267 | ) | — | 2,573 | 2,466 | (1,379 | ) | — | 1,087 | ||||||||||||||||||||||
Other income |
830 | (86 | ) | 118 | (1) | 862 | 601 | (71 | ) | — | 530 | |||||||||||||||||||||
Noninterest revenue(c) |
28,286 | (2,353 | ) | 118 | 26,051 | 22,548 | (1,450 | ) | — | 21,098 | ||||||||||||||||||||||
Net interest income(c) |
14,811 | 5,251 | — | 20,062 | 10,836 | 3,320 | — | 14,156 | ||||||||||||||||||||||||
Total net revenue |
43,097 | 2,898 | 118 | 46,113 | 33,384 | 1,870 | — | 35,254 | ||||||||||||||||||||||||
Provision for credit losses |
2,544 | 2,898 | (858) | (2) | 4,584 | 1,540 | 1,870 | — | 3,410 | |||||||||||||||||||||||
Noninterest expense |
||||||||||||||||||||||||||||||||
Merger costs |
1,365 | — | (1,365) | (3) | — | — | — | — | — | |||||||||||||||||||||||
Litigation reserve charge |
3,700 | — | (3,700) | (4) | — | 100 | — | — | 100 | |||||||||||||||||||||||
All other noninterest
expense |
29,294 | — | — | 29,294 | 21,716 | — | — | 21,716 | ||||||||||||||||||||||||
Total noninterest
expense |
34,359 | — | (5,065 | ) | 29,294 | 21,816 | — | — | 21,816 | |||||||||||||||||||||||
Income before income
tax expense |
6,194 | — | 6,041 | 12,235 | 10,028 | — | — | 10,028 | ||||||||||||||||||||||||
Income tax expense |
1,728 | — | 2,296 | (6) | 4,024 | 3,309 | — | — | 3,309 | |||||||||||||||||||||||
Net income |
$ | 4,466 | $ | — | $ | 3,745 | $ | 8,211 | $ | 6,719 | $ | — | $ | — | $ | 6,719 | ||||||||||||||||
Earnings per
share — diluted |
$ | 1.55 | $ | — | $ | 1.31 | $ | 2.86 | $ | 3.24 | $ | — | $ | — | $ | 3.24 | ||||||||||||||||
Return on
common equity |
6 | % | — | 5 | % | 11 | % | 16 | % | — | — | 16 | % | |||||||||||||||||||
Return on
equity — goodwill(d) |
9 | — | 7 | 16 | 19 | — | — | 19 | ||||||||||||||||||||||||
Return on assets |
0.46 | NM | NM | 0.81 | 0.87 | NM | NM | 0.83 | ||||||||||||||||||||||||
Overhead ratio |
80 | % | NM | NM | 64 | % | 65 | % | NM | NM | 62 | % | ||||||||||||||||||||
| (a) | 2004 results include six months of the combined Firm’s results and six months of heritage JPMorgan Chase results. All other periods reflect the results of heritage JPMorgan Chase only. |
|
| (b) | The impact of credit card securitizations affects CS. See pages 39-40 of this Annual Report for further information. |
|
| (c) | Includes the reclassification of trading-related Net interest income to Trading revenue. See page 25 of this Annual Report for further information. |
|
| (d) | Net income applicable to common stock/Total average common equity (net of goodwill).
The Firm uses return on equity less goodwill, a non-GAAP financial
measure, to evaluate the operating performance of the Firm. The Firm
utilizes this measure to facilitate operating comparisons to other competitors. |
| Year ended December 31,(e) | 2004 | 2003 | ||||||||||||||||||||||
| (in millions) | Reported | Securitized | Managed | Reported | Securitized | Managed | ||||||||||||||||||
Loans — Period-end |
$ | 402,114 | $ | 70,795 | $ | 472,909 | $ | 214,766 | $ | 34,856 | $ | 249,622 | ||||||||||||
Total assets — average |
962,556 | 51,084 | 1,013,640 | 775,978 | 32,365 | 808,343 | ||||||||||||||||||
| (e) | 2004 results include six months of the combined Firm’s results and six months of
heritage JPMorgan Chase results. All other periods reflect the results of heritage JPMorgan Chase
only. |
| 26 | JPMorgan Chase & Co./2004 Annual Report |
Table of Contents
(Table continued from previous page)
| 2002 | |||||||||||||
| Reported | Credit | Special | Operating | ||||||||||
| results | card (b) | items | basis | ||||||||||
| $ | 2,763 |
$ | — | $ | — | $ | 2,763 | ||||||
4,555 |
— | — | 4,555 | ||||||||||
1,674 |
— | — | 1,674 | ||||||||||
5,754 |
— | — | 5,754 | ||||||||||
817 |
— | — | 817 | ||||||||||
988 |
— | — | 988 | ||||||||||
2,307 |
(1,341 | ) | — | 966 | |||||||||
458 |
(36 | ) | — | 422 | |||||||||
19,316 |
(1,377 | ) | — | 17,939 | |||||||||
10,298 |
2,816 | — | 13,114 | ||||||||||
29,614 |
1,439 | — | 31,053 | ||||||||||
4,331 |
1,439 | — | 5,770 | ||||||||||
1,210 |
— | (1,210 | )(3) | — | |||||||||
1,300 |
— | (1,300 | )(4) | — | |||||||||
20,254 |
— | (98 | )(5) | 20,156 | |||||||||
22,764 |
— | (2,608 | ) | 20,156 | |||||||||
2,519 |
— | 2,608 | 5,127 | ||||||||||
856 |
— | 887 | (6) | 1,743 | |||||||||
| $ | 1,663 |
$ | — | $ | 1,721 | $ | 3,384 | ||||||
| $ | 0.80 |
$ | — | $ | 0.86 | $ | 1.66 | ||||||
4 |
% | — | 4 | % | 8 | % | |||||||
5 |
— | 5 | 10 | ||||||||||
0.23 |
NM | NM | 0.45 | ||||||||||
77 |
% | NM | NM | 65 | % | ||||||||
| 2002 | ||||||||||
| Reported | Securitized | Managed | ||||||||
| $ | 216,364 |
$ | 30,722 | $ | 247,086 | |||||
733,357 |
26,519 | 759,876 | ||||||||
Special Items
| (1) | Other income in 2004 reflects $118 million of other accounting policy
conformity adjustments. |
|||
| (2) | The Provision for credit losses in 2004 reflects $858 million of
accounting policy conformity adjustments, consisting of a $1.4 billion
charge related to the decertification of the seller’s interest in credit
card securitizations, partially offset by a benefit of $584 million related to conforming wholesale and consumer credit provision methodologies for the combined Firm. |
|||
| (3) | Merger costs of $1.4 billion in 2004 reflect costs associated with the
Merger; the $1.2 billion of charges in 2002 reflect merger and
restructuring costs associated with programs announced prior to
January 1, 2002. |
|||
| (4) | Significant litigation charges of $3.7 billion and $1.3 billion were
taken in 2004 and 2002, respectively. |
|||
| (5) | All Other noninterest expense in 2002 reflects a $98 million charge
for excess real estate capacity related to facilities in the West Coast
region of the United States. |
|||
| (6) | Income tax expense in 2004 and 2002 of $2.3 billion and $887 mil
lion, respectively, represents the tax effect of the above items. |
|||
Formula Definitions for Non-GAAP Metrics
| Return on common equity | ||
Reported
|
Net income* /Average common equity | |
Operating
|
Operating earnings* /Average common equity | |
| Return on equity - goodwill | ||
Reported
|
Net income* /Average common equity less goodwill | |
Operating
|
Operating earnings* /Average common equity less goodwill | |
| Return on assets | ||
Reported
|
Net income / Average assets | |
Operating
|
Operating earnings /Average managed assets | |
| Overhead ratio | ||
Reported
|
Total noninterest expense / Total net revenue | |
Operating
|
Total noninterest expense / Total net revenue | |
* Represents earnings applicable to common stock
| JPMorgan Chase & Co./2004 Annual Report | 27 |
Table of Contents
Management’s discussion and analysis
Business segment results
The Firm is managed on a line-of-business basis. The business segment financial results presented reflect the current organization of JPMorgan Chase. There are six major reportable business segments: the Investment Bank, Retail Financial Services, Card Services, Commercial Banking, Treasury & Securities Services and Asset & Wealth Management, as well as a Corporate segment.
The segments are based on the products and services provided, or the type of customer served, and they reflect the manner in which financial information is currently evaluated by management. Results of these lines of business are presented on an operating basis.

| JPMorgan is the brand name. JPMorgan Chase Chase is the brand name. Retail Treasury &Asset & Investment Card Commercial Financial Securities Wealth Bank Services Banking Services Services Management Product types: Businesses: Businesses: Businesses: Businesses: Businesses: •Investment banking:• Home Finance• Credit Card• Middle Market• Treasury Services• Investment Banking• Investor Services Management — Advisory• Consumer & Small• Merchant Acquiring — Debt and equity Business Banking• Corporate Banking- Institutional • Institutional Trust underwriting• Auto & Education• Commercial RealServices- Retail •Market-makingFinanceEstate• Private Banking and trading:• Insurance• Business Credit • Private Client — Fixed income • Equipment LeasingServices — Equities — Credit •Corporate lending |
In connection with the Merger, business segment reporting was realigned to reflect the new business structure of the combined Firm. Treasury was transferred from the IB into Corporate. The segment formerly known as Chase Financial Services had been comprised of Chase Home Finance, Chase Cardmember Services, Chase Auto Finance, Chase Regional Banking and Chase Middle Market; as a result of the Merger, this segment is now called Retail Financial Services and is comprised of Home Finance, Auto & Education Finance, Consumer & Small Business Banking and Insurance. Chase Middle Market moved into Commercial Banking, and Chase Cardmember Services is now its own segment called Card Services. TSS remains unchanged. Investment Management & Private Banking has been renamed Asset &
Wealth Management. JPMorgan Partners, which formerly was a stand-alone business segment, was moved into Corporate. Corporate is currently comprised of Private Equity (JPMorgan Partners and ONE Equity Partners), Treasury, as well as corporate support areas, which include Central Technology and Operations, Internal Audit, Executive Office, Finance, General Services, Human Resources, Marketing & Communications, Office of the General Counsel, Real Estate and Business Services, Risk Management and Strategy and Development.
Segment results for periods prior to July 1, 2004, reflect heritage JPMorgan Chase-only results and have been restated to reflect the current business segment organization and reporting classifications.
Segment results — Operating basis (a)(b)
| Year ended December 31, | Total net revenue | Noninterest expense | ||||||||||||||||||||||
| (in millions, except ratios) | 2004 | 2003 | Change | 2004 | 2003 | Change | ||||||||||||||||||
Investment Bank |
$ | 12,605 | $ | 12,684 | (1 | )% | $ | 8,696 | $ | 8,302 | 5 | % | ||||||||||||
Retail Financial Services |
10,791 | 7,428 | 45 | 6,825 | 4,471 | 53 | ||||||||||||||||||
Card Services |
10,745 | 6,144 | 75 | 3,883 | 2,178 | 78 | ||||||||||||||||||
Commercial Banking |
2,374 | 1,352 | 76 | 1,343 | 822 | 63 | ||||||||||||||||||
Treasury & Securities Services |
4,857 | 3,608 | 35 | 4,113 | 3,028 | 36 | ||||||||||||||||||
Asset & Wealth Management |
4,179 | 2,970 | 41 | 3,133 | 2,486 | 26 | ||||||||||||||||||
Corporate |
562 | 1,068 | (47 | ) | 1,301 | 529 | 146 | |||||||||||||||||
Total |
$ | 46,113 | $ | 35,254 | 31 | % | $ | 29,294 | $ | 21,816 | 34 | % | ||||||||||||
| (a) | Represents the reported results excluding the impact of credit card securitizations and, in
2004, Merger costs, the significant litigation reserve charges and accounting policy
conformity adjustments
related to the Merger. |
|
| (b) | 2004 results include six months of the combined Firm’s results and six months of heritage
JPMorgan Chase results. 2003 reflects the results of heritage JPMorgan Chase only. |
|
| (c) | As a result of the Merger, new capital allocation methodologies were implemented during the
third quarter of 2004. The capital allocated to each line of business considers several
factors: stand-alone peer comparables, economic risk measures and regulatory capital requirements. In addition,
effective with the third quarter of 2004, goodwill, as well as the associated capital, is only
allocated
to the Corporate line of business. Prior periods have not been revised to reflect these new
methodologies and are not comparable to the presentation beginning in the third quarter of 2004. |
| 28 | JPMorgan Chase & Co./2004 Annual Report |
Table of Contents
Description of business segment reporting methodology
Revenue sharing
Funds transfer pricing
Expense allocation
with the third quarter of 2004, the cost allocation methodologies of the heritage firms were aligned to provide consistency across the business segments. In addition, expenses related to certain corporate functions, technology and operations ceased to be allocated to the business segments and are retained in Corporate. These retained expenses include parent company costs that would not be incurred if the segments were stand-alone businesses; adjustments to align certain corporate staff, technology and operations allocations with market prices; and other one-time items not aligned with the business segments.
Capital allocation
Credit reimbursement
Tax-equivalent adjustments
Segment results — Operating basis(a)(b)
| Year ended December 31, | Operating earnings | Return on common equity - goodwill(c) | ||||||||||||||||||
| (in millions, except ratios) | 2004 | 2003 | Change | 2004 | 2003 | |||||||||||||||
Investment Bank |
$ | 2,948 | $ | 2,805 | 5 | % | 17 | % | 15 | % | ||||||||||
Retail Financial Services |
2,199 | 1,547 | 42 | 24 | 37 | |||||||||||||||
Card Services |
1,274 | 683 | 87 | 17 | 20 | |||||||||||||||
Commercial Banking |
608 | 307 | 98 | 29 | 29 | |||||||||||||||
Treasury & Securities Services |
440 | 422 | 4 | 17 | 15 | |||||||||||||||
Asset & Wealth Management |
681 | 287 | 137 | 17 | 5 | |||||||||||||||
Corporate |
61 | 668 | (91 | ) | NM | NM | ||||||||||||||
Total |
$ | 8,211 | $ | 6,719 | 22 | % | 16 | % | 19 | % | ||||||||||
| JPMorgan Chase & Co./2004 Annual Report | 29 |
Table of Contents
JPMorgan Chase & Co.
Investment Bank
JPMorgan Chase is one of the world’s leading investment banks, as evidenced by the breadth of its client relationships and product capabilities. The Investment Bank has extensive relationships with corporations, financial institutions, governments and institutional investors worldwide. The Firm provides a full range of investment banking products and services, including advising on corporate strategy and structure, capital raising in equity and debt markets, sophisticated risk management, and market-making in cash securities and derivative instruments in all major capital markets. The Investment Bank also commits the Firm’s own capital to proprietary investing and trading activities.
As a result of the Merger, the Treasury business has been transferred to the Corporate sector, and prior periods have been restated to reflect the reorganization.
Selected income statement data
| Year ended December 31,(a) | ||||||||||||
| (in millions, except ratios) | 2004 | 2003 | 2002 | |||||||||
Revenue |
||||||||||||
Investment banking fees: |
||||||||||||
Advisory |
$ | 938 | $ | 640 | $ | 743 | ||||||
Equity underwriting |
781 | 699 | 470 | |||||||||
Debt underwriting |
1,853 | 1,532 | 1,494 | |||||||||
Total investment banking fees |
3,572 | 2,871 | 2,707 | |||||||||
Trading-related revenue:(b) |
||||||||||||
Fixed income and other |
5,008 | 6,016 | 4,607 | |||||||||
Equities |
427 | 556 | 20 | |||||||||
Credit portfolio |
6 | (186 | ) | (143 | ) | |||||||
Total trading-related revenue |
5,441 | 6,386 | 4,484 | |||||||||
Lending & deposit related fees |
539 | 440 | 394 | |||||||||
Asset management, administration and commissions |
1,400 | 1,217 | 1,244 | |||||||||
Other income |
328 | 103 | (125 | ) | ||||||||
Noninterest revenue |
11,280 | 11,017 | 8,704 | |||||||||
Net interest income(b) |
1,325 | 1,667 | 1,978 | |||||||||
Total net revenue(c) |
12,605 | 12,684 | 10,682 | |||||||||
Provision for credit losses |
(640 | ) | (181 | ) | 2,392 | |||||||
Credit reimbursement from (to) TSS(d) |
90 | (36 | ) | (82 | ) | |||||||
Noninterest expense |
||||||||||||
Compensation expense |
4,893 | 4,462 | 4,298 | |||||||||
Noncompensation expense |
3,803 | 3,840 | 3,500 | |||||||||
Total noninterest expense |
8,696 | 8,302 | 7,798 | |||||||||
Operating earnings before income tax expense |
4,639 | 4,527 | 410 | |||||||||
Income tax expense (benefit) |
1,691 | 1,722 | (3 | ) | ||||||||
Operating earnings |
$ | 2,948 | $ | 2,805 | $ | 413 | ||||||
Financial ratios |
||||||||||||
ROE |
17 | % | 15 | % | 2 | % | ||||||
ROA |
0.62 | 0.64 | 0.10 | |||||||||
Overhead ratio |
69 | 65 | 73 | |||||||||
Compensation expense as
% of total net revenue |
39 | 35 | 40 | |||||||||
| (a) | 2004 results include six months of the combined Firm’s results and six months of heritage
JPMorgan Chase results. All other periods reflect the results of heritage JPMorgan Chase only. |
|
| (b) | Trading revenue, on a reported basis, excludes the impact of Net interest income related to
IB’s trading activities; this income is recorded in Net interest income. However, in this
presentation, to assess the profitability of IB’s trading business, the Firm combines these
revenues for segment reporting purposes. The amount reclassified from Net interest income to
Trading |
revenue was $1.9 billion, $2.1 billion and $1.9 billion for 2004, 2003 and 2002,
respectively. |
||
| (c) | Total net revenue includes tax-equivalent adjustments, primarily due to tax-exempt income
from municipal bond investments, and income tax credits related to affordable housing investments
of $274 million, $117 million and $112 million for 2004, 2003, and 2002, respectively. |
|
| (d) | TSS is charged a credit reimbursement related to certain exposures managed within the IB credit
portfolio on behalf of clients shared with TSS. For a further discussion, see Credit reimbursement
on page 29 of this Annual Report. |
2004 compared with 2003
In 2004, Operating earnings of $2.9 billion were up 5% from the prior year. Increases in Investment
banking fees, a reduction in the Provision for credit losses and the impact of the Merger were
partially offset by decreases in trading revenues and net interest income. Return on equity was
17%.
Total net revenue of $12.6 billion was relatively flat from the prior year, primarily due to lower Fixed income markets revenues and total Credit portfolio revenues, offset by increases in Investment banking fees and the impact of the Merger. The decline in revenue from Fixed income markets was driven by weaker portfolio management trading results, mainly in the interest rate markets business. Total credit portfolio revenues were down due to lower net interest income and lending fees, primarily driven by lower loan balances; these were partially offset by higher trading revenue due to more severe credit spread tightening in 2003 relative to 2004. Investment banking fees increased by 24% over the prior year, driven by significant gains in advisory and debt underwriting. The advisory gains were a result of increased global market volumes and market share, while the higher underwriting fees were due to stronger client activity.
The Provision for credit losses was a benefit of $640 million, compared with a benefit of $181 million in 2003. The improvement in the provision was the result of a $633 million decline in net charge-offs, partially offset by lower reductions in the allowance for credit losses in 2004 relative to 2003. For additional information, see Credit risk management on pages 57-69 of this Annual Report.
For the year ended December 31, 2004, Noninterest expense was up 5% from the prior year. The increase from 2003 was driven by higher Compensation expense, including strategic investments and the impact of the Merger.
2003 compared with 2002
Operating earnings of $2.8 billion were up significantly over 2002. The increase in earnings was
driven by a significant decline in the Provision for credit losses, coupled with strong growth in
fixed income and equity markets revenues.
Total net revenue was $12.7 billion, an increase of $2.0 billion from the prior year. The low interest rate environment, improvement in equity markets and volatility in credit markets produced increased client and portfolio management revenue in fixed income and equities. Market share gains in equity underwriting contributed to the increase in Investment banking fees over 2002.
The Provision for credit losses was a benefit of $181 million in 2003, compared with a cost of $2.4 billion in 2002, reflecting improvement in the overall credit quality of the wholesale portfolio and the restructuring of several nonperforming wholesale loans.
Noninterest expense increased by 6% from 2002, reflecting higher incentives related to improved financial performance and the impact of expensing stock options. Noncompensation expenses were up 10% from the prior year due to increases in technology and occupancy costs.
| 30 | JPMorgan Chase & Co. / 2004 Annual Report |
Table of Contents
Selected metrics
| Year ended December 31,(a) | ||||||||||||
| (in millions, except headcount and ratios) | 2004 | 2003 | 2002 | |||||||||
Revenue by business |
||||||||||||
Investment banking fees |
$ | 3,572 | $ | 2,871 | $ | 2,707 | ||||||
Fixed income markets |
6,314 | 6,987 | 5,450 | |||||||||
Equities markets |
1,491 | 1,406 | 1,018 | |||||||||
Credit portfolio |
1,228 | 1,420 | 1,507 | |||||||||
Total net revenue |
$ | 12,605 | $ | 12,684 | $ | 10,682 | ||||||
Revenue by region |
||||||||||||
Americas |
$ | 6,870 | $ | 7,250 | $ | 6,360 | ||||||
Europe/Middle East/Africa |
4,082 | 4,331 | 3,215 | |||||||||
Asia/Pacific |
1,653 | 1,103 | 1,107 | |||||||||
Total net revenue |
$ | 12,605 | $ | 12,684 | $ | 10,682 | ||||||
Selected balance sheet (average) |
||||||||||||
Total assets |
$ | 473,121 | $ | 436,488 | $ | 429,866 | ||||||
Trading
assets – debt and equity instruments |
173,086 | 156,408 | 134,191 | |||||||||
Trading
assets – derivatives receivables |
58,735 | 83,361 | 70,831 | |||||||||
Loans(b) |
42,618 | 45,037 | 55,998 | |||||||||
Adjusted assets(c) |
393,646 | 370,776 | 359,324 | |||||||||
Equity |
17,290 | 18,350 | 19,134 | |||||||||
Headcount |
17,478 | 14,691 | 15,012 | |||||||||
Credit data and quality statistics |
||||||||||||
Net charge-offs |
$ | 47 | $ | 680 | $ | 1,627 | ||||||
Nonperforming assets: |
||||||||||||
Nonperforming loans(d)(e) |
954 | 1,708 | 3,328 | |||||||||
Other nonperforming assets |
242 | 370 | 408 | |||||||||
Allowance for loan losses |
1,547 | 1,055 | 1,878 | |||||||||
Allowance for lending related commitments |
305 | 242 | 324 | |||||||||
Net charge-off rate(b) |
0.13 | % | 1.65 | % | 3.15 | % | ||||||
Allowance for loan losses to average loans(b) |
4.27 | 2.56 | 3.64 | |||||||||
Allowance for loan losses to nonperforming loans(d) |
163 | 63 | 57 | |||||||||
Nonperforming loans to average loans |
2.24 | 3.79 | 5.94 | |||||||||
Market risk-average trading and credit portfolio VAR |
||||||||||||
Trading activities: |
||||||||||||
Fixed income(f) |
$ | 74 | $ | 61 | NA | |||||||
Foreign exchange |
17 | 17 | NA | |||||||||
Equities |
28 | 18 | NA | |||||||||
Commodities and other |
9 | 8 | NA | |||||||||
Diversification |
(43 | ) | (39 | ) | NA | |||||||
Total trading VAR |
85 | 65 | NA | |||||||||
Credit portfolio VAR(g) |
14 | 18 | NA | |||||||||
Diversification |
(9 | ) | (14 | ) | NA | |||||||
Total trading and credit portfolio VAR |
$ | 90 | $ | 69 | NA | |||||||
| (a) | 2004 results include six months of the combined Firm’s results and six months of heritage
JPMorgan Chase results. All other periods reflect the results of heritage JPMorgan Chase only. |
|
| (b) | The year-to-date average loans held for sale are $6.4 billion, $3.8 billion and $4.3 billion
for 2004, 2003 and 2002, respectively. These amounts are not included in the allowance coverage
ratios and net charge-off rates. The 2002 net charge-offs and net charge-off rate exclude
charge-offs of $212 million taken on lending-related commitments. |
|
| (c) | Adjusted assets equals total average assets minus (1) securities purchased under resale
agreements and securities borrowed less securities sold, not yet purchased; (2) assets of variable
interest entities (VIEs) consolidated under FIN 46R; (3) cash and securities segregated and on
deposit for regulatory and other purposes; and (4) goodwill and intangibles. |
The amount of adjusted assets is presented to assist the reader in comparing the IB’s asset and
capital levels to other investment banks in the securities industry. Asset-to-equity leverage
ratios are commonly used as one measure to assess a company’s capital adequacy. The IB believes
an adjusted asset amount, which excludes certain assets considered to have a low risk profile,
provides a more meaningful measure of balance sheet leverage in the securities industry. See
Capital management on pages 50-52 of this Annual Report for a discussion of the Firm’s overall
capital adequacy and capital management. |
||
| (d) | Nonperforming loans include loans held for sale of $2 million, $30 million and $16 million as
of December 31, 2004, 2003 and 2002, respectively. These amounts are not included in the allowance
coverage ratios. |
|
| (e) | Nonperforming loans exclude loans held for sale of $351 million, $22 million and $2 million as
of December 31, 2004, 2003, and 2002, respectively, that were purchased as part of the IB’s
proprietary investing activities. |
|
| (f) | Includes all mark-to-market trading activities, plus available-for-sale securities held for IB
investing purposes. |
|
| (g) | Includes VAR on derivative credit valuation adjustments, credit valuation adjustment hedges and
mark-to-market loan hedges, which are reported in Trading revenue. This VAR does not include the
accrual loan portfolio, which is not marked to market. |
According to Thomson Financial, in 2004, the Firm improved its ranking in U.S. announced M&A from #8 to #1, and Global announced M&A from #4 to #2, while increasing its market share significantly. The Firm’s U.S. initial public offerings ranking improved from #16 to #4, with the Firm moving to #6 from #4 in the U.S. Equity & Equity-related category. The Firm maintained its #1 ranking in U.S. syndicated loans, with a 32% market share, and its #3 position in Global Debt, Equity and Equity-related.
Market shares and rankings(a)
| 2004 | 2003 | 2002 | ||||||||||||||||||||||
| Market | Market | Market | ||||||||||||||||||||||
| December 31, | Share | Rankings | Share | Rankings | Share | Rankings | ||||||||||||||||||
Global debt, equity and equity-related |
7 | % | # 3 | 8 | % | # 3 | 8 | % | #3 | |||||||||||||||
Global syndicated loans |
20 | # 1 | 20 | # 1 | 26 | #1 | ||||||||||||||||||
Global long-term debt |
7 | # 2 | 8 | # 2 | 8 | #2 | ||||||||||||||||||
Global equity and equity-related |
6 | # 6 | 8 | # 4 | 4 | #8 | ||||||||||||||||||
Global announced M&A |
26 | # 2 | 16 | # 4 | 14 | #5 | ||||||||||||||||||
U.S. debt, equity and equity-related |
8 | # 5 | 9 | # 3 | 10 | #2 | ||||||||||||||||||
U.S. syndicated loans |
32 | # 1 | 35 | # 1 | 39 | #1 | ||||||||||||||||||
U.S. long-term debt |
12 | # 2 | 10 | # 3 | 13 | #2 | ||||||||||||||||||
U.S. equity and equity-related |
8 | # 6 | 11 | # 4 | 6 | #6 | ||||||||||||||||||
U.S. announced M&A |
33 | # 1 | 13 | # 8 | 14 | #7 | ||||||||||||||||||
| (a) | Sourced from Thomson Financial Securities data. Global announced M&A is based on rank value;
all other rankings are based on proceeds, with full credit to each book manager/equal if joint.
Because of joint assignments, market share of all participants will add up to more than 100%.
Market share and rankings are presented on a combined basis for all periods presented, reflecting
the merger of JPMorgan Chase and Bank One. |
| JPMorgan Chase & Co. / 2004 Annual Report | 31 |
Table of Contents
JPMorgan Chase & Co.
Composition of revenue
| Asset | ||||||||||||||||||||||||||||
| Year ended | Trading- | Lending & | management, | |||||||||||||||||||||||||
| December 31,(a) | Investment | related | deposit | administration | Other | Total net | ||||||||||||||||||||||
| (in millions) | banking fees | revenue | related fees | and commissions | income | NII | revenue | |||||||||||||||||||||
2004 |
||||||||||||||||||||||||||||
Investment banking fees |
$ | 3,572 | $ | — | $ | — | $ | — | $ | — | $ | — | $ | 3,572 | ||||||||||||||
Fixed income markets |
— | 5,008 | 191 | 287 | 304 | 524 | 6,314 | |||||||||||||||||||||
Equities markets |
— | 427 | — | 1,076 | (95 | ) | 83 | 1,491 | ||||||||||||||||||||
Credit portfolio |
— | 6 | 348 | 37 | 119 | 718 | 1,228 | |||||||||||||||||||||
Total |
$ | 3,572 | $ | 5,441 | $ | 539 | $ | 1,400 | $ | 328 | $ | 1,325 | $ | 12,605 | ||||||||||||||
2003 |
||||||||||||||||||||||||||||
Investment banking fees |
$ | 2,871 | $ | — | $ | — | $ | — | $ | — | $ | — | $ | 2,871 | ||||||||||||||
Fixed income markets |
— | 6,016 | 107 | 331 | 84 | 449 | 6,987 | |||||||||||||||||||||
Equities markets |
— | 556 | — | 851 | (85 | ) | 84 | 1,406 | ||||||||||||||||||||
Credit portfolio |
— | (186 | ) | 333 | 35 | 104 | 1,134 | 1,420 | ||||||||||||||||||||
Total |
$ | 2,871 | $ | 6,386 | $ | 440 | $ | 1,217 | $ | 103 | $ | 1,667 | $ | 12,684 | ||||||||||||||
2002 |
||||||||||||||||||||||||||||
Investment banking fees |
$ | 2,707 | $ | — | $ | — | $ | — | $ | — | $ | — | $ | 2,707 | ||||||||||||||
Fixed income markets |
— | 4,607 | 75 | 295 | (20 | ) | 493 | 5,450 | ||||||||||||||||||||
Equities markets |
— | 20 | — | 911 | (53 | ) | 140 | 1,018 | ||||||||||||||||||||
Credit portfolio |
— | (143 | ) | 319 | 38 | (52 | ) | 1,345 | 1,507 | |||||||||||||||||||
Total |
$ | 2,707 | $ | 4,484 | $ | 394 | $ | 1,244 | $ | (125 | ) | $ | 1,978 | $ | 10,682 | |||||||||||||
| (a) | 2004 results include six months of the combined Firm’s results and six months of heritage
JPMorgan Chase results. All other periods reflect the results of heritage JPMorgan Chase only. |
IB’s revenues are comprised of the following:
Investment banking fees includes advisory, equity underwriting, bond underwriting and loan syndication fees.
Fixed income markets includes client and portfolio management revenue related to both market-making and proprietary risk-taking across global fixed income markets, including government and corporate debt, foreign exchange, interest rate and commodities markets.
Equities markets includes client and portfolio management revenue related to market-making and proprietary risk-taking across global equity products, including cash instruments, derivatives and convertibles.
Credit portfolio revenue includes Net interest income, fees and loan sale activity for IB’s credit portfolio. Credit portfolio revenue also includes gains or losses on securities received as part of a loan restructuring, and changes in the credit valuation adjustment (“CVA”), which is the component of the fair value of a derivative that reflects the credit quality of the counterparty. See page 63 of the Credit risk management section of this Annual Report for a further discussion of the CVA. Credit portfolio revenue also includes the results of risk management related to the Firm’s lending and derivative activities. See pages 64-65 of the Credit risk management section of this Annual Report for a further discussion on credit derivatives.
| 32 | JPMorgan Chase & Co. / 2004 Annual Report |
Table of Contents
Retail Financial Services
RFS includes Home Finance, Consumer & Small Business Banking, Auto & Education Finance and Insurance. Through this group of businesses, the Firm provides consumers and small businesses with a broad range of financial products and services including deposits, investments, loans and insurance. Home Finance is a leading provider of consumer real estate loan products and is one of the largest originators and servicers of home mortgages. Consumer & Small Business Banking offers one of the largest branch networks in the United States, covering 17 states with 2,508 branches and 6,650 automated teller machines (“ATMs”). Auto & Education Finance is the largest bank originator of automobile loans as well as a top provider of loans for college students. Through its Insurance operations, the Firm sells and underwrites an extensive range of financial protection products and investment alternatives, including life insurance, annuities and debt protection products.
Selected income statement data
| Year ended December 31,(a) | ||||||||||||
| (in millions, except ratios) | 2004 | 2003 | 2002 | |||||||||
Revenue |
||||||||||||
Lending & deposit related fees |
$ | 1,013 | $ | 486 | $ | 509 | ||||||
Asset management, administration and commissions |
849 | 357 | 368 | |||||||||
Securities/private equity gains (losses) |
(83 | ) | 381 | 493 | ||||||||
Mortgage fees and related income |
1,037 | 905 | 982 | |||||||||
Credit card income |
230 | 107 | 91 | |||||||||
Other income |
31 | (28 | ) | 82 | ||||||||
Noninterest revenue |
3,077 | 2,208 | 2,525 | |||||||||
Net interest income |
7,714 | 5,220 | 3,823 | |||||||||
Total net revenue |
10,791 | 7,428 | 6,348 | |||||||||
Provision for credit losses |
449 | 521 | 334 | |||||||||
Noninterest expense |
||||||||||||
Compensation expense |
2,621 | 1,695 | 1,496 | |||||||||
Noncompensation expense |
3,937 | 2,773 | 2,234 | |||||||||
Amortization of intangibles |
267 | 3 | 3 | |||||||||
Total noninterest expense |
6,825 | 4,471 | 3,733 | |||||||||
Operating earnings before income tax expense |
3,517 | 2,436 | 2,281 | |||||||||
Income tax expense |
1,318 | 889 | 849 | |||||||||
Operating earnings |
$ | 2,199 | $ | 1,547 | $ | 1,432 | ||||||
Financial ratios |
||||||||||||
ROE |
24 | % | 37 | % | 37 | % | ||||||
ROA |
1.18 | 1.05 | 1.25 | |||||||||
Overhead ratio |
63 | 60 | 59 | |||||||||
| (a) | 2004 results include six months of the combined Firm’s results and six months of heritage
JPMorgan Chase results. All other periods reflect the results of heritage JPMorgan Chase only. |
2004 compared with 2003
Operating earnings were $2.2 billion, up from $1.5 billion a year ago. The increase was largely due
to the Merger. Excluding the benefit of the Merger, earnings declined as lower MSR risk management
results and reduced prime mortgage production revenue offset the benefits of growth in loan
balances, wider spreads on deposit products and improvement in credit costs.
Total net revenue increased to $10.8 billion, up 45% from the prior year. Net interest income increased by 48% to $7.7 billion, primarily due to the Merger, growth in retained loan balances and wider spreads on deposit products. Noninterest revenue increased to $3.1 billion, up 39%, due to the Merger and higher mortgage servicing income. Both components of total revenue included declines associated with risk managing the MSR asset and lower prime mortgage originations.
The Provision for credit losses was down 14% to $449 million, despite the influence of the Merger. The effect of the Merger was offset by a reduction in the allowance for loan losses, resulting from the sale of the manufactured home loan portfolio, and continued positive credit quality trends in the consumer lending businesses.
Noninterest expense totaled $6.8 billion, up 53% from the prior year, primarily due to the Merger and continued investments to expand the branch network. Partially offsetting the increase were merger-related expense savings in all businesses.
2003 compared with 2002
Total net revenue was $7.4 billion in 2003, an increase of 17% over 2002. Net interest income
increased by 37% to $5.2 billion, reflecting the positive impact of the low interest rate
environment on consumer loan originations, particularly in Home Finance, and on spreads earned on
retained loans.
The Provision for credit losses of $521 million increased by 56% compared with the prior year due to continued growth in the retained loan portfolios. Credit quality remained stable in 2003, as charge-offs decreased slightly, to $381 million.
Noninterest expense rose 20% to $4.5 billion. The increase reflected higher business volumes and compensation costs.
| JPMorgan Chase & Co. / 2004 Annual Report | 33 |
Table of Contents
JPMorgan Chase & Co.
Selected metrics
| Year ended December 31,(a) | ||||||||||||
| (in millions, except headcount and ratios) | 2004 | 2003 | 2002 | |||||||||
Selected balance sheet (ending) |
||||||||||||
Total assets |
$ | 226,560 | $ | 139,316 | NA | |||||||
Loans(b) |
202,473 | 121,921 | NA | |||||||||
Core deposits(c) |
157,256 | 75,850 | NA | |||||||||
Total deposits |
182,765 | 86,162 | NA | |||||||||
Selected balance sheet (average) |
||||||||||||
Total assets |
$ | 185,928 | $ | 147,435 | $ | 114,248 | ||||||
Loans(d) |
162,768 | 120,750 | 93,125 | |||||||||
Core deposits(c) |
121,121 | 80,116 | 68,551 | |||||||||
Total deposits |
137,796 | 89,793 | 79,348 | |||||||||
Equity |
9,092 | 4,220 | 3,907 | |||||||||
Headcount |
59,632 | 32,278 | 29,096 | |||||||||
Credit data and quality statistics |
||||||||||||
Net charge-offs(e) |
$ | 990 | $ | 381 | $ | 382 | ||||||
Nonperforming
loans(f) |
1,161 | 569 | 554 | |||||||||
Nonperforming assets |
1,385 | 775 | 730 | |||||||||
Allowance for loan losses |
1,228 | 1,094 | 955 | |||||||||
Net charge-off rate |
0.67 | % | 0.40 | % | 0.48 | % | ||||||
Allowance for loan losses to ending loans(b) |
0.67 | 1.04 | NA | |||||||||
Allowance for loan losses to nonperforming loans(f) |
107 | 209 | 181 | |||||||||
Nonperforming loans to total loans |
0.57 | 0.47 | NA | |||||||||
| (a) | 2004 results include six months of the combined Firm’s results and six months of heritage
JPMorgan Chase results. All other periods reflect the results of heritage JPMorgan Chase only. |
|
| (b) | End-of-period loans include loans held for sale of $18,022 million, $17,105 million and $19,948
million at December 31, 2004, 2003 and 2002, respectively. Those amounts are not included in the
allowance coverage ratios. |
|
| (c) | Includes demand and savings deposits. |
|
| (d) | Average loans include loans held for sale of $14,736 million, $25,293 million and $13,500
million for 2004, 2003 and 2002, respectively. These amounts are not included in the net charge-off
rate. |
|
| (e) | Includes $406 million of charge-offs related to the manufactured home loan portfolio in the
fourth quarter of 2004. |
|
| (f) | Nonperforming loans include loans held for sale of $13 million, $45 million and $25 million at
December 31, 2004, 2003 and 2002, respectively. These amounts are not included in the allowance
coverage ratios. |
Home Finance
Home Finance is comprised of two key business segments: Prime Production & Servicing and Consumer Real Estate Lending. The Prime Production & Servicing segment includes the operating results associated with the origination, sale and servicing of prime mortgages. Consumer Real Estate Lending reflects the operating results of consumer loans that are secured by real estate, retained by the Firm and held in the portfolio. This portfolio includes prime and subprime first mortgages, home equity lines and loans, and manufactured home loans. The Firm stopped originating manufactured home loans early in 2004 and sold substantially all of its remaining portfolio at the end of the year.
Selected income statement data by business
| Year ended December 31,(a) | ||||||||||||
| (in millions) | 2004 | 2003 | 2002 | |||||||||
Prime production and servicing |
||||||||||||
Production |
$ | 728 | $ | 1,339 | $ | 1,052 | ||||||
Servicing: |
||||||||||||
Mortgage
servicing revenue, net of amortization |
651 | 453 | 486 | |||||||||
MSR risk management results |
113 | 784 | 670 | |||||||||
Total net revenue |
1,492 | 2,576 | 2,208 | |||||||||
Noninterest expense |
1,115 | 1,124 | 921 | |||||||||
Operating earnings |
240 | 918 | 821 | |||||||||
Consumer real estate lending |
||||||||||||
Total net revenue |
2,376 | 1,473 | 712 | |||||||||
Provision for credit losses |
74 | 240 | 191 | |||||||||
Noninterest expense |
922 | 606 | 417 | |||||||||
Operating earnings |
881 | 414 | 81 | |||||||||
Total Home Finance |
||||||||||||
Total net revenue |
3,868 | 4,049 | 2,920 | |||||||||
Provision for credit losses |
74 | 240 | 191 | |||||||||
Noninterest expense |
2,037 | 1,730 | 1,338 | |||||||||
Operating earnings |
1,121 | 1,332 | 902 | |||||||||
| (a) | 2004 results include six months of the combined Firm’s results and six months of heritage
JPMorgan Chase results. All other periods reflect the results of heritage JPMorgan Chase only. |
2004 compared with 2003
Operating earnings in the Prime Production & Servicing segment dropped to $240 million from $918
million in the prior year. Results reflected a decrease in prime mortgage production revenue, to
$728 million from $1.3 billion, due to a decline in mortgage originations. Operating earnings were
also impacted by a drop in MSR risk management revenue, to $113 million from $784 million in the
prior year. Results in 2004 included realized losses of $89 million on the sale of AFS securities
associated with risk management of the MSR asset, compared with securities gains of $359 million in
the prior year. Noninterest expense was relatively flat at $1.1 billion.
| 34 | JPMorgan Chase & Co. / 2004 Annual Report |
Table of Contents
Operating earnings for the Consumer Real Estate Lending segment more than doubled to $881 million from $414 million in the prior year. The increase was largely due to the addition of the Bank One home equity lending business but also reflected growth in retained loan balances and a $95 million net benefit associated with the sale of the $4 billion manufactured home loan portfolio; partially offsetting these increases were lower subprime mortgage securitization gains. These factors contributed to total net revenue rising 61% to $2.4 billion. The provision for credit losses, at $74 million, decreased by 69% from a year ago. This was the result of an $87 million reduction in the allowance for loan losses associated with the manufactured home loan portfolio sale, improved credit quality and lower delinquencies, partially offset by the Merger. Noninterest expense totaled $922 million, up 52% from the year-ago period, largely due to the Merger.
2003 compared with 2002
Home Finance achieved record financial performance in 2003, as operating earnings of $1.3 billion
increased by 48% from 2002.
Total net revenue of $4.0 billion increased by 39% over 2002, given record production revenue, improved margins and higher home equity revenue.
The provision for credit losses of $240 million for 2003 increased by 26% over 2002, primarily due to higher retained loan balances. Credit quality continued to be strong relative to 2002, as evidenced by a lower net charge-off ratio and reduced delinquencies.
Noninterest expense of $1.7 billion increased by 29% from 2002, primarily a result of growth in origination volume. The increase in expenses was also a result of higher performance-related incentives and strategic investments made to further expand certain distribution channels. These were partially offset by production-related expense reduction efforts initiated in the fourth quarter of 2003.
Selected metrics
| Year ended December 31,(a) | ||||||||||||
| (in millions, except ratios and where otherwise noted) | 2004 | 2003 | 2002 | |||||||||
Origination volume by channel (in billions) |
||||||||||||
Retail |
$ | 74.2 | $ | 90.8 | $ | 56.3 | ||||||
Wholesale |
48.5 | 65.6 | 36.2 | |||||||||
Correspondent |
22.8 | 44.5 | 20.6 | |||||||||
Correspondent negotiated transactions |
41.5 | 83.3 | 42.6 | |||||||||
Total |
187.0 | 284.2 | 155.7 | |||||||||
Origination volume by business (in billions) |
||||||||||||
Mortgage |
$ | 144.6 | $ | 259.5 | $ | 141.8 | ||||||
Home equity |
42.4 | 24.7 | 13.9 | |||||||||
Total |
187.0 | 284.2 | 155.7 | |||||||||
Business metrics (in billions) |
||||||||||||
Loans serviced (ending) |
$ | 562.0 | $ | 470.0 | $ | 426.0 | ||||||
MSR net carrying value (ending) |
5.1 | 4.8 | 3.2 | |||||||||
End of period loans owned |
||||||||||||
Mortgage loans held for sale |
14.2 | 15.9 | 18.8 | |||||||||
Mortgage loans retained |
42.6 | 34.5 | 26.9 | |||||||||
Home equity and other loans |
67.9 | 24.1 | 18.5 | |||||||||
Total end of period loans owned |
124.7 | 74.5 | 64.2 | |||||||||
Average loans owned |
||||||||||||
Mortgage loans held for sale |
12.1 | 23.5 | 12.0 | |||||||||
Mortgage loans retained |
40.7 | 32.0 | 27.7 | |||||||||
Home equity and other loans |
47.0 | 19.4 | 17.2 | |||||||||
Total average loans owned |
99.8 | 74.9 | 56.9 | |||||||||
Overhead ratio |
53 | % | 43 | % | 46 | % | ||||||
Credit quality statistics |
||||||||||||
30+ day delinquency rate |
1.27 | % | 1.81 | % | 3.07 | % | ||||||
Net charge-offs |
||||||||||||
Mortgage |
$ | 19 | $ | 26 | $ | 50 | ||||||
Home equity and other loans(b) |
554 | 109 | 93 | |||||||||
Total net charge-offs |
573 | 135 | 143 | |||||||||
Net charge-off rate |
||||||||||||
Mortgage |
0.05 | % | 0.08 | % | 0.18 | % | ||||||
Home equity and other loans |
1.18 | 0.56 | 0.53 | |||||||||
Total net charge-off rate(c) |
0.65 | 0.26 | 0.32 | |||||||||
Nonperforming assets |
$ | 844 | $ | 546 | $ | 518 | ||||||
| (a) | 2004 results include six months of the combined Firm’s results and six months of heritage
JPMorgan Chase results. All other periods reflect the results of heritage JPMorgan Chase only. |
|
| (b) | Includes $406 million of charge-offs related to the manufactured home loan portfolio in the
fourth quarter of 2004. |
|
| (c) | Excludes mortgage loans held for sale. |
Home Finance’s origination channels are comprised of the following:
Retail - A mortgage banker employed by the Firm directly contacts borrowers who are buying or refinancing a home through a branch office, through the Internet or by phone. Borrowers are frequently referred to a mortgage banker by real estate brokers, home builders or other third parties.
Wholesale - A third-party mortgage broker refers loans to a mortgage banker at the Firm. Brokers are independent loan originators that specialize in finding and counseling borrowers but do not provide funding for loans.
Correspondent - Banks, thrifts, other mortgage banks and other financial institutions sell closed loans to the Firm.
Correspondent negotiated transactions (“CNT”) - Mid- to large-sized mortgage lenders, banks and bank-owned mortgage companies sell servicing to the Firm on an as-originated basis. These transactions supplement traditional production channels and provide growth opportunities in the servicing portfolio in stable and rising-rate periods.
| JPMorgan Chase & Co. / 2004 Annual Report | 35 |
Table of Contents
JPMorgan Chase & Co.
The table below reconciles management’s disclosure of Home Finance’s revenue into the reported U.S. GAAP line items shown on the Consolidated statement of income and in the related Notes to Consolidated financial statements:
| Year ended December 31,(a) | Prime production and servicing | Consumer real estate lending | Total revenue | |||||||||||||||||||||||||||||||||
| (in millions) | 2004 | 2003 | 2002 | 2004 | 2003 | 2002 | 2004 | 2003 | 2002 | |||||||||||||||||||||||||||
Net interest income |
$ | 700 | $ | 1,556 | $ | 727 | $ | 2,245 | $ | 1,226 | $ | 712 | $ | 2,945 | $ | 2,782 | $ | 1,439 | ||||||||||||||||||
Securities / private equity gains (losses) |
(89 | ) | 359 | 498 | — | — | — | (89 | ) | 359 | 498 | |||||||||||||||||||||||||
Mortgage fees and related income(b) |
881 | 661 | 983 | 131 | 247 | — | 1,012 | 908 | 983 | |||||||||||||||||||||||||||
Total |
$ | 1,492 | $ | 2,576 | $ | 2,208 | $ | 2,376 | $ | 1,473 | $ | 712 | $ | 3,868 | $ | 4,049 | $ | 2,920 | ||||||||||||||||||
| (a) | 2004 results include six months of the combined Firm’s results and six months of heritage
JPMorgan Chase results. All other periods reflect the results of heritage JPMorgan Chase only. |
|
| (b) | Includes activity reported elsewhere as Other income. |
The following table details the MSR risk management results in the Home Finance business:
MSR risk management results
| Year ended December 31,(a) | ||||||||||||
| (in millions) | 2004 | 2003 | 2002 | |||||||||
Reported amounts: |
||||||||||||
MSR valuation adjustments(b) |
$ | (248 | ) | $ | (253 | ) | $ | (4,040 | ) | |||
Derivative valuation adjustments and other risk management gains (losses)(c) |
361 | 1,037 | 4,710 | |||||||||
MSR risk management results |
$ | 113 | $ | 784 | $ | 670 | ||||||
| (a) | 2004 results include six months of the combined Firm’s results and six months of heritage
JPMorgan Chase results. All other periods reflect the results of heritage JPMorgan Chase only. |
|
| (b) | Excludes subprime loan MSR activity of $(2) million and $(13) million in 2004 and 2002,
respectively. There was no subprime loan MSR activity in 2003. |
|
| (c) | Includes gains, losses and interest income associated with derivatives both designated and not
designated as a SFAS 133 hedge, and securities classified as both trading and available-for-sale. |
Home Finance uses a combination of derivatives, AFS securities and trading securities to manage changes in the fair value of the MSR asset. These risk management activities are intended to protect the economic value of the MSR asset by providing offsetting changes in the fair value of related risk management instruments. The type and amount of hedging instruments used in this risk management activity change over time as market conditions and approach dictate.
During 2004, negative MSR valuation adjustments of $248 million were more than offset by $361 million of aggregate risk management gains, including net interest earned on AFS securities. In 2003, negative MSR valuation adjustments of $253 million were more than offset by $1.0 billion of aggregate risk management gains, including net interest earned on AFS securities. Unrealized gains/(losses) on AFS securities were $(3) million, $(144) million and $377 million at December 31, 2004, 2003 and 2002, respectively. For a further discussion of MSRs, see Critical accounting estimates on page 79 and Note 15 on pages 109-111 of this Annual Report.
Consumer & Small Business Banking
Consumer & Small Business Banking offers a full array of financial services through a branch network spanning 17 states as well as through the Internet. Product offerings include checking and savings accounts, mutual funds and annuities, credit cards, mortgages and home equity loans, and loans for small business customers (generally with annual sales less than $10 million). This segment also includes community development loans.
Selected income statement data
| Year ended December 31,(a) | ||||||||||||
| (in millions) | 2004 | 2003 | 2002 | |||||||||
Total net revenue |
$ | 5,385 | $ | 2,422 | $ | 2,648 | ||||||
Provision for credit losses |
165 | 76 | (31 | ) | ||||||||
Noninterest expense |
3,981 | 2,358 | 2,055 | |||||||||
Operating earnings |
760 | (4 | ) | 361 | ||||||||
| (a) | 2004 results include six months of the combined Firm’s results and six months of heritage
JPMorgan Chase results. All other periods reflect the results of heritage JPMorgan Chase only. |
2004 compared with 2003
Operating earnings totaled $760 million, up from a loss of $4 million in the prior-year period. The
increase was largely due to the Merger but also reflected wider spreads on deposits and lower
expenses. These benefits were partially offset by a higher Provision for credit losses.
Total net revenue was $5.4 billion, compared with $2.4 billion in the prior year. While the increase is primarily attributable to the Merger, total net revenue also benefited from wider spreads on deposits.
The Provision for credit losses increased to $165 million from $76 million in the prior year. The increase was in part due to the Merger but also reflected an increase in the Allowance for credit losses to cover high-risk portfolio segments.
The increase in noninterest expense to $4.0 billion was largely attributable to the Merger. Incremental expense from investments in the branch distribution network was also a contributing factor.
2003 compared with 2002
Total net revenue of $2.4 billion decreased by 9% compared with 2002. Net interest income
declined by 10% to $1.6 billion, primarily due to the low-interest rate environment. Noninterest
revenue decreased by 5% to $828 million given lower deposit fee income, decreased debit card fees
and one-time gains in 2002.
Noninterest expense of $2.4 billion increased by 15% from 2002. The increase was largely due to investments in technology within the branch network and higher compensation expenses related to increased staff levels.
The Provision for credit losses of $76 million increased by $107 million compared with 2002. This reflected a reduction in the allowance for loan losses in 2002.
| 36 | JPMorgan Chase & Co. / 2004 Annual Report |
Table of Contents
Selected metrics
| Year ended December 31,(a) | ||||||||||||
| (in millions, except ratios and where otherwise noted) | 2004 | 2003 | 2002 | |||||||||
Business metrics (in billions) |
||||||||||||
End-of-period balances |
||||||||||||
Small business loans |
$ | 12.5 | $ | 2.2 | NA | |||||||
Consumer and other loans(b) |
2.2 | 2.0 | NA | |||||||||
Total loans |
14.7 | 4.2 | NA | |||||||||
Core deposits(c) |
146.7 | 66.4 | NA | |||||||||
Total deposits |
172.2 | 76.7 | NA | |||||||||
Average balances |
||||||||||||
Small business loans |
$ | 7.3 | $ | 2.1 | $ | 1.9 | ||||||
Consumer and other loans(b) |
2.1 | 2.0 | 2.6 | |||||||||
Total loans |
9.4 | 4.1 | 4.5 | |||||||||
Core deposits(c) |
110.0 | 64.8 | 57.9 | |||||||||
Total deposits |
126.6 | 74.4 | 68.7 | |||||||||
Number of: |
||||||||||||
Branches |
2,508 | 561 | 560 | |||||||||
ATMs |
6,650 | 1,931 | 1,876 | |||||||||
Personal bankers |
5,324 | 1,820 | 1,587 | |||||||||
Personal checking accounts (in thousands) |
7,286 | 1,984 | 2,037 | |||||||||
Business checking accounts (in thousands) |
894 | 347 | 345 | |||||||||
Online customers (in thousands) |
6,587 | NA | NA | |||||||||
Debit cards issued (in thousands) |
8,392 | 2,380 | 2,352 | |||||||||
Overhead ratio |
74 | % | 97 | % | 78 | % | ||||||
Retail brokerage business metrics |
||||||||||||
Investment sales volume |
$ | 7,324 | $ | 3,579 | NA | |||||||
Number of dedicated investment sales representatives |
1,364 | 349 | 291 | |||||||||
Credit quality statistics |
||||||||||||
Net charge-offs |
||||||||||||
Small business |
$ | 77 | $ | 35 | $ | 24 | ||||||
Consumer and other loans |
77 | 40 | 51 | |||||||||
Total net charge-offs |
154 | 75 | 75 | |||||||||
Net charge-off rate |
||||||||||||
Small business |
1.05 | % | 1.67 | % | 1.26 | % | ||||||
Consumer and other loans |
3.67 | 2.00 | 1.96 | |||||||||
Total net charge-off rate |
1.64 | 1.83 | 1.67 | |||||||||
Nonperforming assets |
$ | 299 | $ | 72 | $ | 94 | ||||||
| (a) | 2004 results include six months of the combined Firm’s results and six months of heritage
JPMorgan Chase results. All other periods reflect the results of heritage JPMorgan Chase only. |
|
| (b) | Primarily community development loans. |
|
| (c) | Includes demand and savings deposits. |
Auto & Education Finance
Auto & Education Finance provides automobile loans and leases to consumers and loans to commercial clients, primarily through a national network of automotive dealers. The segment also offers loans to students via colleges and universities across the United States.
Selected income statement data
| Year ended December 31,(a) | ||||||||||||
| (in millions) | 2004 | 2003 | 2002 | |||||||||
Total net revenue |
$ | 1,145 | $ | 842 | $ | 683 | ||||||
Provision for credit losses |
210 | 205 | 174 | |||||||||
Noninterest expense |
490 | 291 | 247 | |||||||||
Operating earnings |
270 | 206 | 166 | |||||||||
| (a) | 2004 results include six months of the combined Firm’s results and six months of heritage
JPMorgan Chase results. All other periods reflect the results of heritage JPMorgan Chase only. |
2004 compared with 2003
Operating earnings totaled $270 million, up 31% from the prior year. While the increase was
reflective of the Merger, performance for the year was moderated by narrower spreads and reduced
origination volumes arising from a competitive operating environment.
Total net revenue increased by 36% to $1.1 billion from the prior year. This increase reflected the Merger but included a decline in net interest income, given the competitive operating environment in 2004 and incremental charges associated with the Firm’s lease residual exposure.
The Provision for credit losses totaled $210 million, up 2% from the prior year. The increase was due to the Merger but was largely offset by a lower provision for credit losses, reflecting favorable credit trends.
Noninterest expense increased by 68% to $490 million, largely due to the Merger.
The following is a brief description of selected business metrics within Consumer & Small Business Banking.
| • | Personal bankers — Retail branch office personnel who acquire, retain and expand new and existing
customer relationships by assessing customer needs and recommending and selling appropriate banking
products and services. |
| • | Investment sales representatives — Licensed retail branch sales personnel, assigned to support
several branches, who assist with the sale of investment products including college planning
accounts, mutual funds, annuities and retirement accounts. |
| JPMorgan Chase & Co. / 2004 Annual Report | 37 |
Table of Contents
JPMorgan Chase & Co.
2003 compared with 2002
In 2003, operating earnings were $206 million, 24% higher than in 2002. Total net revenue grew by
23% to $842 million. Net interest income grew by 33% in comparison to 2002, driven by higher
average loans and leases outstanding and wider spreads.
The Provision for credit losses increased by 18% to $205 million, primarily reflecting a 32% increase in average loan and lease receivables. Credit quality continued to be strong relative to 2002, as evidenced by a lower net charge-off ratio and a reduced delinquency rate.
Noninterest expense of $291 million increased by 18% compared with 2002. The increase in expenses was driven by higher origination volume and higher performance-based incentives.
Selected metrics
| Year ended December 31,(a) | ||||||||||||
| (in millions, except ratios and where otherwise noted) | 2004 | 2003 | 2002 | |||||||||
Business metrics (in billions) |
||||||||||||
End of period loans and lease receivables |
||||||||||||
Loans receivables |
$ | 54.6 | $ | 33.7 | $ | 28.0 | ||||||
Lease receivables |
8.0 | 9.5 | 9.4 | |||||||||
Total end-of-period loans and lease receivables |
62.6 | 43.2 | 37.4 | |||||||||
Average loans and lease receivables |
||||||||||||
Loans outstanding (average)(b) |
$ | 44.3 | $ | 32.0 | $ | 23.3 | ||||||
Lease receivables (average) |
9.0 | 9.7 | 8.4 | |||||||||
Total average loans and lease receivables(b) |
53.3 | 41.7 | 31.7 | |||||||||
Overhead ratio |
43 | % | 35 | % | 36 | % | ||||||
Credit quality statistics |
||||||||||||
30+ day delinquency rate |
1.55 | % | 1.42 | % | 1.49 | % | ||||||
Net charge-offs |
||||||||||||
Loans |
$ | 219 | $ | 130 | $ | 126 | ||||||
Lease receivables |
44 | 41 | 38 | |||||||||
Total net charge-offs |
263 | 171 | 164 | |||||||||
Net charge off rate |
||||||||||||
Loans(b) |
0.52 | % | 0.43 | % | 0.58 | % | ||||||
Lease receivables |
0.49 | 0.42 | 0.45 | |||||||||
Total net charge-off rate(b) |
0.52 | 0.43 | 0.54 | |||||||||
Nonperforming assets |
$ | 242 | $ | 157 | $ | 118 | ||||||
| (a) | 2004 results include six months of the combined Firm’s results and six months of heritage
JPMorgan Chase results. All other periods reflect the results of heritage JPMorgan Chase only. |
|
| (b) | Average loans include loans held for sale of $2.3 billion, $1.8 billion and $1.5 billion for,
2004, 2003 and 2002, respectively. These are not included in the net charge-off rate. |
Insurance
Insurance is a provider of financial protection products and services, including life insurance, annuities and debt protection. Products and services are distributed through both internal lines of business and external markets.
Selected income statement data
| Year ended December 31,(a) | ||||||||||||
| (in millions) | 2004 | 2003 | 2002 | |||||||||
Total net revenue |
$ | 393 | $ | 115 | $ | 97 | ||||||
Noninterest expense |
317 | 92 | 93 | |||||||||
Operating earnings |
48 | 13 | 3 | |||||||||
Memo: Consolidated gross insurance-related revenue(b) |
1,191 | 611 | 536 | |||||||||
| (a) | 2004 results include six months of the combined Firm’s results and six months of heritage
JPMorgan Chase results. All other periods reflect the results of heritage JPMorgan Chase only. |
|
| (b) | Includes revenue reported in the results of other businesses. |
2004 compared with 2003
Insurance operating earnings totaled $48 million on total net revenue of $393 million in 2004. The
increases in total net revenue and noninterest expense over the prior year were almost entirely due
to the Merger.
2003 compared with 2002
Operating earnings in 2003 reflected a 19% increase in Total net revenue, while expenses were
essentially flat.
Selected metrics
| Year ended December 31,(a) | ||||||||||||
| (in millions, except where otherwise noted) | 2004 | 2003 | 2002 | |||||||||
Business metrics — ending balances |
||||||||||||
Invested assets |
$ | 7,368 | $ | 1,559 | $ | 919 | ||||||
Policy loans |
397 | — | — | |||||||||
Insurance policy and claims reserves |
7,279 | 1,096 | 535 | |||||||||
Term premiums — first year annualized |
28 | — | — | |||||||||
Proprietary annuity sales |
208 | 548 | 490 | |||||||||
Number of policies in force — direct/assumed (in thousands) |
2,611 | 631 | NA | |||||||||
Insurance in force — direct/assumed |
$ | 277,827 | $ | 31,992 | NA | |||||||
Insurance in force — retained |
80,691 | 31,992 | NA | |||||||||
A.M. Best rating |
A | A | A | |||||||||
| (a) | 2004 results include six months of the combined Firm’s results and six months of heritage
JPMorgan Chase results. All other periods reflect the results of heritage JPMorgan Chase only. |
The following is a brief description of selected business metrics within Insurance.
| • | Proprietary annuity sales represent annuity contracts marketed through and issued by subsidiaries
of the Firm. |
| • | Insurance in force — direct/assumed includes the aggregate face amount of insurance policies
directly underwritten and assumed through reinsurance. |
| • | Insurance in force — retained includes the aggregate face amounts of insurance policies directly
underwritten and assumed through reinsurance, after reduction for face amounts ceded to reinsurers. |
| 38 | JPMorgan Chase & Co. / 2004 Annual Report |
Table of Contents
Card Services
Card Services is the largest issuer of general purpose credit cards in the United States, with approximately 94 million cards in circulation, and is the largest merchant acquirer. CS offers a wide variety of products to satisfy the needs of its cardmembers, including cards issued on behalf of many well-known partners, such as major airlines, hotels, universities, retailers and other financial institutions.
JPMorgan Chase uses the concept of “managed receivables” to evaluate the credit performance of the underlying credit card loans, both sold and not sold: as the same borrower is continuing to use the credit card for ongoing charges, a borrower’s credit performance will affect both the receivables sold under SFAS 140 and those not sold. Thus, in its disclosures regarding managed receivables, JPMorgan Chase treats the sold receivables as if they were still on the balance sheet in order to disclose the credit performance (such as net charge-off rates) of the entire managed credit card portfolio. Operating results exclude the impact of credit card securitizations on revenue, the provision for credit losses, net charge-offs and receivables. Securitization does not change reported net income versus operating earnings; however, it does affect the classification of items on the Consolidated statements of income.
Selected income statement data – managed basis
| Year ended December 31,(a) | ||||||||||||
| (in millions, except ratios) | 2004 | 2003 | 2002 | |||||||||
Revenue |
||||||||||||
Asset management,
administration and commissions |
$ | 75 | $ | 108 | $ | 126 | ||||||
Credit card income |
2,179 | 930 | 826 | |||||||||
Other income |
117 | 54 | 31 | |||||||||
Noninterest revenue |
2,371 | 1,092 | 983 | |||||||||
Net interest income |
8,374 | 5,052 | 4,930 | |||||||||
Total net revenue |
10,745 | 6,144 | 5,913 | |||||||||
Provision for credit losses |
4,851 | 2,904 | 2,751 | |||||||||
Noninterest expense |
||||||||||||
Compensation expense |
893 | 582 | 523 | |||||||||
Noncompensation expense |
2,485 | 1,336 | 1,320 | |||||||||
Amortization of intangibles |
505 | 260 | 286 | |||||||||
Total noninterest expense |
3,883 | 2,178 | 2,129 | |||||||||
Operating earnings before
income tax expense |
2,011 | 1,062 | 1,033 | |||||||||
Income tax expense |
737 | 379 | 369 | |||||||||
Operating earnings |
$ | 1,274 | $ | 683 | $ | 664 | ||||||
Financial metrics |
||||||||||||
ROE |
17 | % | 20 | % | 19 | % | ||||||
Overhead ratio |
36 | 35 | 36 | |||||||||
| (a) | 2004 results include six months of the combined Firm’s results and six months of heritage
JPMorgan Chase results. All other periods reflect the results of heritage JPMorgan Chase only. |
2004 compared with 2003
Operating earnings of $1.3 billion increased by $591 million compared with the prior year,
primarily due to the Merger. In addition, earnings benefited from higher loan balances and charge
volume, partially offset by a higher provision for credit losses and higher expenses.
Total net revenue of $10.7 billion increased by $4.6 billion. Net interest income of $8.4 billion increased by $3.3 billion, primarily due to the Merger and higher loan balances. Noninterest revenue of $2.4 billion increased by $1.3 billion, primarily due to the Merger and higher charge volume, which generated increased interchange income. This was partially offset by higher volume-driven payments to partners, reflecting the sharing of income and increased rewards expense.
The Provision for credit losses of $4.9 billion increased by $1.9 billion, primarily due to the Merger and growth in credit card receivables. Credit ratios remained strong, benefiting from reduced contractual and bankruptcy charge-offs. The net charge-off ratio was 5.27%. The 30-day delinquency ratio was 3.70%.
Noninterest expense of $3.9 billion increased by $1.7 billion, primarily related to the Merger. In addition, expenses increased due to higher marketing expenses and volume-based processing expenses, partially offset by lower compensation expenses.
2003 compared with 2002
Operating earnings of $683 million increased by $19 million or 3% compared with the prior year.
Earnings benefited from higher revenue, partially offset by a higher provision for credit losses
and expenses.
Total net revenue of $6.1 billion increased by 4%. Net interest income of $5.1 billion increased by 2% due to higher spread and loan balances. Noninterest revenue of $1.1 billion increased by 11% due to higher charge volume, which generated increased interchange income. This was partially offset by higher rewards expense.
The Provision for credit losses was $2.9 billion, an increase of 6%, primarily due to the higher provision for credit losses and higher losses due to loan growth. Conservative risk management and rigorous collection practices contributed to stable credit quality.
Noninterest expense was $2.2 billion, an increase of 2%, due to volume-based processing expenses, partially offset by disciplined expense management.
| JPMorgan Chase & Co./2004 Annual Report | 39 |
Table of Contents
Management’s discussion and analysis
Selected metrics
| Year ended December 31,(a) | ||||||||||||
| (in millions, except headcount, ratios | ||||||||||||
| and where otherwise noted) | 2004 | 2003 | 2002 | |||||||||
Memo: Net securitization
gains (amortization) |
$ | (8 | ) | $ | 1 | $ | 16 | |||||
% of average managed outstandings: |
||||||||||||
Net interest income |
9.16 | % | 9.95 | % | 10.08 | % | ||||||
Provision for credit losses |
5.31 | 5.72 | 5.62 | |||||||||
Noninterest revenue |
2.59 | 2.15 | 2.01 | |||||||||
Risk adjusted margin(b) |
6.45 | 6.38 | 6.46 | |||||||||
Noninterest expense |
4.25 | 4.29 | 4.35 | |||||||||
Pre-tax income |
2.20 | 2.09 | 2.11 | |||||||||
Operating earnings |
1.39 | 1.35 | 1.36 | |||||||||
Business metrics |
||||||||||||
Charge volume (in billions) |
$ | 193.6 | $ | 88.2 | $ | 79.0 | ||||||
Net accounts opened (in thousands) |
7,523 | 4,177 | 3,680 | |||||||||
Credit cards issued (in thousands) |
94,285 | 35,103 | 33,488 | |||||||||
Number of registered
internet customers (in millions) |
13.6 | 3.7 | 2.2 | |||||||||
Merchant acquiring business |
||||||||||||
Bank card volume (in billions) |
$ | 396.2 | $ | 261.2 | $ | 226.1 | ||||||
Total transactions (in millions) |
12,066 | 7,154 | 6,509 | |||||||||
Selected ending balances |
||||||||||||
Loans: |
||||||||||||
Loans on balance sheet |
$ | 64,575 | $ | 17,426 | $ | 20,101 | ||||||
Securitized loans |
70,795 | 34,856 | 30,722 | |||||||||
Managed loans |
$ | 135,370 | $ | 52,282 | $ | 50,823 | ||||||
Selected average balances |
||||||||||||
Managed assets |
$ | 94,741 | $ | 51,406 | $ | 49,648 | ||||||
Loans: |
||||||||||||
Loans on balance sheet |
$ | 38,842 | $ | 17,604 | $ | 22,410 | ||||||
Securitized loans |
52,590 | 33,169 | 26,519 | |||||||||
Managed loans |
$ | 91,432 | $ | 50,773 | $ | 48,929 | ||||||
Equity |
7,608 | 3,440 | 3,444 | |||||||||
Headcount |
19,598 | 10,612 | 10,885 | |||||||||
Credit quality statistics – managed |
||||||||||||
Net charge-offs |
$ | 4,821 | $ | 2,996 | $ | 2,887 | ||||||
Net charge-off rate |
5.27 | % | 5.90 | % | 5.90 | % | ||||||
Delinquency ratios – managed |
||||||||||||
30+ days |
3.70 | % | 4.68 | % | 4.69 | % | ||||||
90+ days |
1.72 | 2.19 | 2.16 | |||||||||
Allowance for loan losses |
$ | 2,994 | $ | 1,225 | $ | 1,459 | ||||||
Allowance for loan losses to
period-end loans |
4.64 | % | 7.03 | % | 7.26 | % | ||||||
| (a) | 2004 results include six months of the combined Firm’s results and six months of heritage
JPMorgan Chase results. All other periods reflect the results of heritage JPMorgan Chase only. |
|
| (b) | Represents Total net revenue less Provision for credit losses. |
The financial information presented below reconciles reported basis and managed basis to disclose the effect of securitizations.
| Year ended December 31,(a) | ||||||||||||
| (in millions) | 2004 | 2003 | 2002 | |||||||||
Income statement data |
||||||||||||
Credit card income |
||||||||||||
Reported data for the period |
$ | 4,446 | $ | 2,309 | $ | 2,167 | ||||||
Securitization adjustments |
(2,267 | ) | (1,379 | ) | (1,341 | ) | ||||||
Managed credit card income |
$ | 2,179 | $ | 930 | $ | 826 | ||||||
Other income |
||||||||||||
Reported data for the period |
$ | 203 | $ | 125 | $ | 67 | ||||||
Securitization adjustments |
(86 | ) | (71 | ) | (36 | ) | ||||||
Managed other income |
$ | 117 | $ | 54 | $ | 31 | ||||||
Net interest income |
||||||||||||
Reported data for the period |
$ | 3,123 | $ | 1,732 | $ | 2,114 | ||||||
Securitization adjustments |
5,251 | 3,320 | 2,816 | |||||||||
Managed net interest income |
$ | 8,374 | $ | 5,052 | $ | 4,930 | ||||||
Total net revenue(b) |
||||||||||||
Reported data for the period |
$ | 7,847 | $ | 4,274 | $ | 4,474 | ||||||
Securitization adjustments |
2,898 | 1,870 | 1,439 | |||||||||
Managed total net revenue |
$ | 10,745 | $ | 6,144 | $ | 5,913 | ||||||
Provision for credit losses |
||||||||||||
Reported data for the period |
$ | 1,953 | $ | 1,034 | $ | 1,312 | ||||||
Securitization adjustments |
2,898 | 1,870 | 1,439 | |||||||||
Managed provision for credit losses |
$ | 4,851 | $ | 2,904 | $ | 2,751 | ||||||
Balance sheet – average balances |
||||||||||||
Total average assets |
||||||||||||
Reported data for the period |
$ | 43,657 | $ | 19,041 | $ | 23,129 | ||||||
Securitization adjustments |
51,084 | 32,365 | 26,519 | |||||||||
Managed average assets |
$ | 94,741 | $ | 51,406 | $ | 49,648 | ||||||
Credit quality statistics |
||||||||||||
Net charge-offs |
||||||||||||
Reported net charge-offs data
for the period |
$ | 1,923 | $ | 1,126 | $ | 1,448 | ||||||
Securitization adjustments |
2,898 | 1,870 | 1,439 | |||||||||
Managed net charge-offs |
$ | 4,821 | $ | 2,996 | $ | 2,887 | ||||||
| (a) | 2004 results include six months of the combined Firm’s results and six months of heritage
JPMorgan Chase results. All other periods reflect the results of heritage JPMorgan Chase only. |
|
| (b) | Includes Credit card income, Other income and Net interest income. |
The following is a brief description of selected business metrics within Card Services.
| • | Charge volume – Represents the dollar amount of cardmember purchases, balance transfers and cash
advance activity. |
|||
| • | Net accounts opened – Includes originations, purchases and sales. |
|||
| • | Merchant acquiring business – Represents an entity that processes payments for merchants.
JPMorgan Chase is a majority owner of Paymentech, Inc. and a 50% owner of Chase Merchant Services. |
|||
| • | Bank card volume – Represents the dollar amount of transactions processed for the merchants. |
|||
| • | Total transactions – Represents the number of transactions and authorizations processed for
the merchants. |
|||
| 40 | JPMorgan Chase & Co./2004 Annual Report |
Table of Contents
Commercial Banking
Commercial Banking serves more than 25,000 corporations, municipalities, financial institutions and not-for-profit entities, with annual revenues generally ranging from $10 million to $2 billion. A local market presence and a strong customer service model, coupled with a focus on risk management, provide a solid infrastructure for Commercial Banking to provide the Firm’s complete product set – lending, treasury services, investment banking and investment management – for both corporate clients and their executives. Commercial Banking’s clients benefit greatly from the Firm’s extensive branch network and often use the Firm exclusively to meet their financial services needs.
Commercial Banking operates in 10 of the top 15 major U.S. metropolitan areas. Within this network, Commercial Banking is divided into three customer coverage segments. General coverage for corporate clients is done by Middle Market Banking, which generally covers clients up to $500 million, and Corporate Banking, which generally covers clients over $500 million. Corporate Banking typically focuses on clients that have broader investment banking needs. The third segment, Commercial Real Estate, serves investors in and developers of for-sale housing, multifamily rental, retail, office and industrial properties. In addition to these three customer groupings, Commercial Banking offers several products to the Firm’s entire customer base. Chase Business Credit is a leading national provider of highly structured asset-based financing, syndications and collateral analysis. Chase Equipment Leasing finances a variety of equipment types and offers vendor programs for leading capital and technology equipment manufacturers. Given this structure, Commercial Banking manages a customer base and loan portfolio that is highly diversified across a broad range of industries and geographic locations.
Commercial Banking was known prior to the Merger as Chase Middle Market and was a business within the former Chase Financial Services.
Selected income statement data
| Year ended December 31,(a) | ||||||||||||
| (in millions, except ratios) | 2004 | 2003 | 2002 | |||||||||
Revenue |
||||||||||||
Lending & deposit related fees |
$ | 441 | $ | 301 | $ | 285 | ||||||
Asset management, administration
and commissions |
32 | 19 | 16 | |||||||||
Other income(b) |
209 | 73 | 65 | |||||||||
Noninterest revenue |
682 | 393 | 366 | |||||||||
Net interest income |
1,692 | 959 | 999 | |||||||||
Total net revenue |
2,374 | 1,352 | 1,365 | |||||||||
Provision for credit losses |
41 | 6 | 72 | |||||||||
Noninterest expense |
||||||||||||
Compensation expense |
465 | 285 | 237 | |||||||||
Noncompensation expense |
843 | 534 | 565 | |||||||||
Amortization of intangibles |
35 | 3 | 7 | |||||||||
Total noninterest expense |
1,343 | 822 | 809 | |||||||||
Operating earnings before income
tax expense |
990 | 524 | 484 | |||||||||
Income tax expense |
382 | 217 | 201 | |||||||||
Operating earnings |
$ | 608 | $ | 307 | $ | 283 | ||||||
Financial ratios |
||||||||||||
ROE |
29 | % | 29 | % | 24 | % | ||||||
ROA |
1.67 | 1.87 | 1.77 | |||||||||
Overhead ratio |
57 | 61 | 59 | |||||||||
| (a) | 2004 results include six months of the combined Firm’s results and six months of heritage
JPMorgan Chase results. All other periods reflect the results of heritage JPMorgan Chase only. |
|
| (b) | IB-related and commercial card revenues are included in Other income. |
2004 compared with 2003
Operating earnings were $608 million, an increase of 98%, primarily due to the Merger.
Total net revenue was $2.4 billion, an increase of 76%, primarily due to the Merger. In addition to the overall increase related to the Merger, Net interest income of $1.7 billion was positively affected by higher deposit balances, partially offset by lower lending-related revenue. Noninterest revenue of $682 million was positively affected by higher investment banking fees and higher gains on the sale of loans and securities acquired in satisfaction of debt, partially offset by lower service charges on deposits, which often decline as interest rates rise.
The Provision for credit losses was $41 million, an increase of $35 million, primarily due to the Merger. Excluding the impact of the Merger, the provision was higher in 2004. Lower net charge-offs in 2004 were partially offset by lower reductions in the Allowance for credit losses in 2004 relative to 2003.
Noninterest expense was $1.3 billion, an increase of $521 million, or 63%, primarily related to the Merger.
| JPMorgan Chase & Co./2004 Annual Report | 41 |
Table of Contents
Management’s discussion and analysis
2003 compared with 2002
Operating earnings were $307 million, an increase of 8% compared with 2002.
Total net revenue of $1.4 billion decreased by 1% compared with 2002. Net interest income of $1.0 billion decreased by 4% compared with the prior year, primarily due to lower deposit and loan spreads, partially offset by higher deposit and loan balances. Noninterest revenue was $393 million, an increase of 7%, primarily reflecting higher service charges on deposits and investment banking fees.
The Provision for credit losses was $6 million, a decrease of $66 million, which resulted from a larger reduction in the Allowance for credit losses and lower net charge-offs in 2003, reflecting an improvement in credit quality.
Noninterest expense was $822 million, an increase of 2% compared with 2002. The increase was the result of higher severance costs and performance-based incentives, partially offset by a decrease in other expenses.
Selected metrics
| Year ended December 31,(a) | ||||||||||||
| (in millions, except headcount and ratios) | 2004 | 2003 | 2002 | |||||||||
Revenue by product: |
||||||||||||
Lending |
$ | 764 | $ | 396 | $ | 414 | ||||||
Treasury services |
1,467 | 896 | 925 | |||||||||
Investment banking |
120 | 66 | 51 | |||||||||
Other |
23 | (6 | ) | (25 | ) | |||||||
Total Commercial Banking revenue |
2,374 | 1,352 | 1,365 | |||||||||
Selected balance sheet (average) |
||||||||||||
Total assets |
$ | 36,435 | $ | 16,460 | $ | 15,973 | ||||||
Loans and leases |
32,417 | 14,049 | 13,642 | |||||||||
Deposits |
51,620 | 32,880 | 29,403 | |||||||||
Equity |
2,093 | 1,059 | 1,199 | |||||||||
Headcount |
4,555 | 1,730 | 1,807 | |||||||||
Credit data and quality statistics: |
||||||||||||
Net charge-offs |
$ | 61 | $ | 76 | $ | 107 | ||||||
Nonperforming loans |
527 | 123 | 198 | |||||||||
Allowance for loan losses |
1,322 | 122 | 182 | |||||||||
Allowance for lending-related commitments(b) |
169 | 26 | — | |||||||||
Net charge-off rate |
0.19 | % | 0.54 | % | 0.78 | % | ||||||
Allowance for loan losses to average loans |
4.08 | 0.87 | 1.33 | |||||||||
Allowance for loan losses to
nonperforming loans |
251 | 99 | 92 | |||||||||
Nonperforming loans to average loans |
1.63 | 0.88 | 1.45 | |||||||||
| (a) | 2004 results include six months of the combined Firm’s results and six months of heritage
JPMorgan Chase results. All other periods reflect the results of heritage JPMorgan Chase only. |
|
| (b) | In 2002, the Allowance for lending-related commitments was allocated to the IB. Had the amount
been allocated to CB, the allowance would have been $24 million. |
Commercial Banking revenues are comprised of the following:
Lending incorporates a variety of financing alternatives, such as term loans, revolving lines of credit and asset-based structures and leases, which are often secured by receivables, inventory, equipment or real estate.
Treasury services incorporates a broad range of products and services to help clients manage short-term liquidity through deposits and sweeps, and longer-term investment needs through money market accounts, certificates of deposit and mutual funds; manage working capital through lockbox, global trade, global clearing and commercial card products; and have ready access to information to manage their business through online reporting tools.
Investment banking products provide clients with more sophisticated capital-raising alternatives, through loan syndications, investment-grade debt, asset-backed securities, private placements, high-yield bonds and equity underwriting, and balance sheet and risk management tools through foreign exchange, derivatives, M&A and advisory services.
| 42 | JPMorgan Chase & Co./2004 Annual Report |
Table of Contents
Treasury & Securities Services
Treasury & Securities Services is a global leader in providing transaction, investment and information services to support the needs of corporations, issuers and institutional investors worldwide. TSS is the largest cash management provider in the world and one of the top three global custodians. The Treasury Services business provides clients with a broad range of capabilities, including U.S. dollar and multi-currency clearing, ACH, trade, and short-term liquidity and working capital tools. The Investor Services business provides a wide range of capabilities, including custody, funds services, securities lending, and performance measurement and execution products. The Institutional Trust Services business provides trustee, depository and administrative services for debt and equity issuers. Treasury Services partners with the Commercial Banking, Consumer & Small Business Banking and Asset & Wealth Management segments to serve clients firmwide. As a result, certain Treasury Services revenues are included in other segments’ results.
Selected income statement data
| Year ending December 31,(a) | ||||||||||||
| (in millions, except ratios) | 2004 | 2003 | 2002 | |||||||||
Revenue |
||||||||||||
Lending & deposit related fees |
$ | 647 | $ | 470 | $ | 445 | ||||||
Asset management, administration
and commissions |
2,445 | 1,903 | 1,800 | |||||||||
Other income |
382 | 288 | 328 | |||||||||
Noninterest revenue |
3,474 | 2,661 | 2,573 | |||||||||
Net interest income |
1,383 | 947 | 962 | |||||||||
Total net revenue |
4,857 | 3,608 | 3,535 | |||||||||
Provision for credit losses |
7 | 1 | 3 | |||||||||
Credit reimbursement (to) from IB(b) |
(90 | ) | 36 | 82 | ||||||||
Noninterest expense |
||||||||||||
Compensation expense |
1,629 | 1,257 | 1,131 | |||||||||
Noncompensation expense |
2,391 | 1,745 | 1,616 | |||||||||
Amortization of intangibles |
93 | 26 | 24 | |||||||||
Total noninterest expense |
4,113 | 3,028 | 2,771 | |||||||||
Operating earnings before income
tax expense |
647 | 615 | 843 | |||||||||
Income tax expense |
207 | 193 | 294 | |||||||||
Operating earnings |
$ | 440 | $ | 422 | $ | 549 | ||||||
Financial ratios |
||||||||||||
ROE |
17 | % | 15 | % | 20 | % | ||||||
Overhead ratio |
85 | 84 | 78 | |||||||||
Memo |
||||||||||||
Treasury Services firmwide overhead ratios(c) |
62 | 62 | 62 | |||||||||
Treasury & Securities Services
firmwide overhead ratio(c) |
74 | 76 | 72 | |||||||||
| (a) | 2004 results include six months of the combined Firm’s results and six months of heritage
JPMorgan Chase results. All other periods reflect the results of heritage JPMorgan Chase only. |
|
| (b) | TSS is charged a credit reimbursement related to certain exposures managed within the IB credit
portfolio on behalf of clients shared with TSS. For a further discussion, see Credit reimbursement
on page 29 of this Annual Report. |
|
| (c) | TSS and TS firmwide overhead ratios have been calculated based on the firmwide revenues
described in footnote (b) on page 44 of this Annual Report and TSS or TS expenses, respectively,
including those allocated to certain other lines of business. |
2004 compared with 2003
TSS net revenue improved by 35% to $4.9 billion. This revenue growth reflected the benefit of the Merger and the acquisitions noted above and improved product revenues across TSS. Net interest income grew to $1.4 billion from $947 million as a result of average deposit balance growth of 44%, to $128 billion, a change in the corporate deposit pricing methodology in 2004 and wider deposit spreads. Growth in fees and commissions was driven by a 20% increase in assets under custody to $9.1 trillion as well as new business growth in trade, commercial card, global equity products, securities lending, fund services, clearing and ACH. Partially offsetting these improvements were lower service charges on deposits, which often decline as interest rates rise, and a soft municipal bond market.
Treasury Services (“TS”) net revenue grew to $2.0 billion, Investor Services (“IS”) to $1.7 billion and Institutional Trust Services (“ITS”) to $1.2 billion. TSS firmwide net revenue grew 41% to $6.5 billion. TSS firmwide net revenues include Treasury Services net revenues recorded in other lines of business.
Credit reimbursement to the Investment Bank was $90 million, compared with a credit from the Investment Bank of $36 million in the prior year, principally due to the Merger and a change in methodology. TSS is charged a credit reimbursement related to certain exposures managed within the Investment Bank credit portfolio on behalf of clients shared with TSS.
Noninterest expense totaled $4.1 billion, up from $3.0 billion, reflecting the Merger and the acquisitions noted above, $155 million of software impairment charges, upfront transition expenses related to on-boarding new custody and fund accounting clients, and legal and technology-related expenses.
On January 7, 2005, JPMorgan Chase agreed to acquire Vastera, a provider of global trade management solutions, for a total transaction value of approximately $129 million. Vastera’s business will be combined with the Logistics and Trade Services businesses of the Treasury Services unit. The transaction is expected to close in the first half of 2005.
2003 compared with 2002
Total net revenue increased by 2%, with growth at ITS of 11%. ITS revenue growth was the result of debt product lines, increased volume in asset servicing, a pre-tax gain of $36 million on the sale of an Institutional Trust Services business in 2003, and the result of acquisitions which generated $29 million of new revenue in 2003. TS’s revenue rose by 8% on higher trade and commercial payment card revenue and increased balance-related earnings, including
| JPMorgan Chase & Co. / 2004 Annual Report | 43 |
Table of Contents
Management’s discussion and analysis
higher balance-deficiency fees resulting from the lower interest rate environment. IS’s revenue contracted by 7%, the result of lower NII due to lower interest rates, lower foreign exchange and securities lending revenue, and a pre-tax gain of $50 million on the sale of the Firm’s interest in a non-U.S. securities clearing firm in 2002.
Noninterest expense increased by 9%, attributable to higher severance, the impact of acquisitions, the cost associated with expensing of options, increased pension costs and charges to provide for losses on subletting unoccupied excess real estate.
TSS was assigned a credit reimbursement of pre-tax earnings and the associated capital related to certain credit exposures managed within IB’s credit portfolio on behalf of clients shared with TSS. For 2003, the impact to TSS was to increase pre-tax operating earnings by $36 million and average allocated capital by $712 million.
Treasury & Securities Services firmwide metrics include certain TSS product revenues and deposits reported in other lines of business for customers who are also customers of those lines of business. In order to capture the firmwide impact of TS and TSS products and revenues, management reviews firmwide metrics such as firmwide deposits, firmwide revenue and firmwide overhead ratios in assessing financial performance for TSS. Firmwide metrics are necessary in order to understand the aggregate TSS business.
Selected metrics
| Year ending December 31,(a) | ||||||||||||
| (in millions, except headcount and where | ||||||||||||
| otherwise noted) | 2004 | 2003 | 2002 | |||||||||
Revenue by business |
||||||||||||
Treasury Services(b) |
$ | 1,994 | $ | 1,200 | $ | 1,111 | ||||||
Investor Services |
1,709 | 1,448 | 1,561 | |||||||||
Institutional Trust Services |
1,154 | 960 | 863 | |||||||||
Total net revenue |
$ | 4,857 | $ | 3,608 | $ | 3,535 | ||||||
Memo |
||||||||||||
Treasury Services firmwide revenue(b) |
$ | 3,665 | $ | 2,214 | $ | 2,125 | ||||||
Treasury & Securities Services
firmwide revenue(b) |
6,528 | 4,622 | 4,549 | |||||||||
Business metrics |
||||||||||||
Assets under custody (in billions) |
$ | 9,137 | $ | 7,597 | $ | 6,336 | ||||||
Corporate trust securities
under administration (in billions)(c) |
6,676 | 6,127 | NA | |||||||||
Selected balance sheet (average) |
||||||||||||
Total assets |
$ | 23,430 | $ | 18,379 | $ | 17,239 | ||||||
Loans |
7,849 | 6,009 | 5,972 | |||||||||
Deposits |
||||||||||||
U.S. deposits |
82,928 | 54,116 | $ | 32,698 | ||||||||
Non-U.S. deposits |
45,022 | 34,518 | 34,919 | |||||||||
Total deposits |
127,950 | 88,634 | 67,617 | |||||||||
Equity |
2,544 | 2,738 | 2,700 | |||||||||
Memo |
||||||||||||
Treasury Services firmwide deposits(d) |
$ | 99,587 | $ | 65,194 | $ | 41,508 | ||||||
Treasury & Securities Services
firmwide deposits(d) |
175,327 | 119,245 | 88,865 | |||||||||
Headcount |
22,612 | 15,145 | 14,810 | |||||||||
| (a) | 2004 results include six months of the combined Firm’s results and six months of heritage
JPMorgan Chase results. All other periods reflect the results of heritage JPMorgan Chase only. |
|
| (b) | TSS and Treasury Services firmwide revenues include TS revenues recorded in certain other lines
of business. Revenue associated with Treasury Services customers who are also customers of the
Commercial Banking, Consumer & Small Business Banking and Asset & Wealth Management lines of
business are reported in these other lines of business and are excluded from Treasury Services, as
follows: |
| (in millions) | 2004 | 2003 | 2002 | |||||||||
Treasury Services revenue reported in
Commercial Banking |
$ | 1,467 | $ | 896 | $ | 925 | ||||||
Treasury Services revenue reported in
other lines of business |
204 | 118 | 89 | |||||||||
Note: Foreign exchange revenues are apportioned between TSS and the IB, and only TSS’s share is
included in TSS firmwide revenue. |
||
| (c) | Corporate trust securities under administration include debt held in trust on behalf of third
parties and debt serviced as agent. |
|
| (d) | TSS and TS firmwide deposits include TS’s deposits recorded in certain other lines of business.
Deposits associated with Treasury Services customers who are also customers of the Commercial
Banking line of business are reported in that line of business and are excluded from Treasury
Services. |
|
| NA | — | Data for 2002 is not available on a comparable basis. |
| 44 | JPMorgan Chase & Co. / 2004 Annual Report |
Table of Contents
Asset & Wealth Management
Asset & Wealth Management provides investment management to retail and institutional investors, financial intermediaries and high-net-worth families and individuals globally. For retail investors, AWM provides investment management products and services, including a global mutual fund franchise, retirement plan administration, and consultation and brokerage services. AWM delivers investment management to institutional investors across all asset classes. The Private bank and Private client services businesses provide integrated wealth management services to ultra-high-net-worth and high-net-worth clients, respectively.
Selected income statement data
| Year ended December 31,(a) | ||||||||||||
| (in millions, except ratios) | 2004 | 2003 | 2002 | |||||||||
Revenue |
||||||||||||
Lending & deposit related fees |
$ | 28 | $ | 19 | $ | 21 | ||||||
Asset management, administration
and commissions |
3,140 | 2,258 | 2,228 | |||||||||
Other income |
215 | 205 | 216 | |||||||||
Noninterest revenue |
3,383 | 2,482 | 2,465 | |||||||||
Net interest income |
796 | 488 | 467 | |||||||||
Total net revenue |
4,179 | 2,970 | 2,932 | |||||||||
Provision for credit losses |
(14 | ) | 35 | 85 | ||||||||
Noninterest expense |
||||||||||||
Compensation expense |
1,579 | 1,213 | 1,141 | |||||||||
Noncompensation expense |
1,502 | 1,265 | 1,261 | |||||||||
Amortization of intangibles |
52 | 8 | 6 | |||||||||
Total noninterest expense |
3,133 | 2,486 | 2,408 | |||||||||
Operating earnings before
income tax expense |
1,060 | 449 | 439 | |||||||||
Income tax expense |
379 | 162 | 161 | |||||||||
Operating earnings |
$ | 681 | $ | 287 | $ | 278 | ||||||
Financial ratios |
||||||||||||
ROE |
17 | % | 5 | % | 5 | % | ||||||
Overhead ratio |
75 | 84 | 82 | |||||||||
Pre-tax margin ratio(b) |
25 | 15 | 15 | |||||||||
| (a) | 2004 results include six months of the combined Firm’s results and six months of heritage
JPMorgan Chase results. All other periods reflect the results of heritage JPMorgan Chase only. |
|
| (b) | Pre-tax margin represents Operating earnings before income taxes / Total net revenue, which is
a comprehensive measure of pre-tax performance and is another basis by which AWM management
evaluates its performance and that of its competitors. Pre-tax margin is an effective measure of
AWM’s earnings, after all costs are taken into consideration. |
2004 compared with 2003
Total net revenue was $4.2 billion, up 41%, primarily due to the Merger. Additionally, fees and
commissions increased due to global equity market appreciation, net asset inflows and the
acquisition of JPMorgan Retirement Plan Services (“RPS”) in the second quarter of 2003. Fees and
commissions also increased due to an improved product mix, with an increased percentage of assets
in higher-yielding products. Net interest income increased due to deposit and loan growth.
The Provision for credit losses was a benefit of $14 million, a decrease of $49 million, due to an improvement in credit quality.
Noninterest expense was $3.1 billion, up 26%, due to the Merger as well as increased Compensation expense and the impact of increased technology and marketing initiatives.
2003 compared with 2002
Total net revenue was $3.0 billion, up 1% from the prior year. The increase in fees and commissions reflected the acquisition of RPS and increased average equity market valuations in client portfolios, partly offset by institutional net outflows. Net interest income increased due to higher brokerage account balances and spreads. The decline in Other income primarily reflected non-recurring items in 2002.
The Provision for credit losses decreased by 59%, due to an improvement in credit quality and recoveries.
Noninterest expense was $2.5 billion, up $78 million from 2002, reflecting the acquisition of RPS, higher Compensation expense, and real estate and software write-offs, partly offset by the continued impact of expense-management programs.
Selected metrics
| Year ended December 31,(a) | ||||||||||||
| (in millions, except headcount and ratios) | 2004 | 2003 | 2002 | |||||||||
Revenue by client segment |
||||||||||||
Private bank |
$ | 1,554 | $ | 1,437 | $ | 1,467 | ||||||
Retail |
1,081 | 732 | 695 | |||||||||
Institutional |
994 | 723 | 688 | |||||||||
Private client services |
550 | 78 | 82 | |||||||||
Total net revenue |
$ | 4,179 | $ | 2,970 | $ | 2,932 | ||||||
Business metrics |
||||||||||||
Number of: |
||||||||||||
Client advisors |
1,226 | 615 | 673 | |||||||||
Brown Co. average daily trades |
29,901 | 27,150 | 24,584 | |||||||||
Retirement Plan Services
participants |
918,000 | 756,000 | — | |||||||||
Star rankings(b) |
||||||||||||
% of customer assets in funds
ranked 4 or better |
48 | % | 48 | % | NA | |||||||
% of customer assets in funds
ranked 3 or better |
81 | 69 | NA | |||||||||
Selected balance sheet (average) |
||||||||||||
Total assets |
$ | 37,751 | $ | 33,780 | $ | 35,813 | ||||||
Loans |
21,545 | 16,678 | 18,926 | |||||||||
Deposits |
32,039 | 20,249 | 19,329 | |||||||||
Equity |
3,902 | 5,507 | 5,649 | |||||||||
Headcount |
12,287 | 8,520 | 8,546 | |||||||||
| JPMorgan Chase & Co. / 2004 Annual Report | 45 |
Table of Contents
Management’s discussion and analysis
| Year ended December 31,(a) | ||||||||||||
| (in millions, except ratios) | 2004 | 2003 | 2002 | |||||||||
Credit data and quality statistics |
||||||||||||
Net charge-offs |
$ | 72 | $ | 9 | $ | 112 | ||||||
Nonperforming loans |
79 | 173 | 139 | |||||||||
Allowance for loan losses |
216 | 130 | 97 | |||||||||
Allowance for lending-related commitments |
5 | 4 | — | |||||||||
Net charge-off rate |
0.33 | % | 0.05 | % | 0.59 | % | ||||||
Allowance for loan losses to average loans |
1.00 | 0.78 | 0.51 | |||||||||
Allowance for loan losses to nonperforming
loans |
273 | 75 | 70 | |||||||||
Nonperforming loans to average loans |
0.37 | 1.04 | 0.73 | |||||||||
| (a) | 2004 results include six months of the combined Firm’s results and six months of heritage
JPMorgan Chase results. All other periods reflect the results of heritage JPMorgan Chase only. |
|
| (b) | Derived from Morningstar for the United States; Micropal for the United Kingdom, Luxembourg,
Hong Kong and Taiwan; and Nomura for Japan. |
|
NA-Data for 2002 is not available on a comparable basis. |
||
AWM’s client segments are comprised of the following:
The Private bank addresses every facet of wealth management for ultra-high-net-worth individuals and families worldwide, including investment management, capital markets and risk management, tax and estate planning, banking, capital raising and specialty wealth advisory services.
Retail provides more than 2 million customers worldwide with investment management, retirement planning and administration, and brokerage services through third-party and direct distribution channels.
Institutional serves more than 3,000 large and mid-size corporate and public institutions, endowments and foundations, and governments globally. AWM offers institutions comprehensive global investment services, including investment management across asset classes, pension analytics, asset-liability management, active risk budgeting and overlay strategies.
Private client services offers high-net-worth individuals, families and business owners comprehensive wealth management solutions that include financial planning, personal trust, investment and banking products and services.
Assets under supervision
2004 compared with 2003
2003 compared with 2002
The diversification of AUS across product classes, client segments and geographic regions helped to mitigate the impact of market volatility on revenue. The Firm also had a 44% interest in American Century Companies, Inc., whose AUM totaled $87 billion and $72 billion at December 31, 2003 and 2002, respectively.
| Assets under supervision(a)(b) | ||||||||
| (in billions) | 2004 | 2003 | ||||||
Asset class |
||||||||
Liquidity |
$ | 232 | $ | 156 | ||||
Fixed income |
171 | 118 | ||||||
Equities, balanced and other |
388 | 287 | ||||||
Assets under management |
791 | 561 | ||||||
Custody/brokerage/administration/deposits |
478 | 203 | ||||||
Total Assets under supervision |
$ | 1,269 | $ | 764 | ||||
Client segment |
||||||||
Private bank |
||||||||
Assets under management |
$ | 139 | $ | 138 | ||||
Custody/brokerage/administration/deposits |
165 | 128 | ||||||
Assets under supervision |
304 | 266 | ||||||
Retail |
||||||||
Assets under management |
133 | 93 | ||||||
Custody/brokerage/administration/deposits |
88 | 71 | ||||||
Assets under supervision |
221 | 164 | ||||||
Institutional |
||||||||
Assets under management |
466 | 322 | ||||||
Custody/brokerage/administration/deposits |
184 | — | ||||||
Assets under supervision |
650 | 322 | ||||||
Private client services |
||||||||
Assets under management |
53 | 8 | ||||||
Custody/brokerage/administration/deposits |
41 | 4 | ||||||
Assets under supervision |
94 | 12 | ||||||
Total Assets under supervision |
$ | 1,269 | $ | 764 | ||||
Geographic region |
||||||||
Americas |
||||||||
Assets under management |
$ | 562 | $ | 365 | ||||
Custody/brokerage/administration/deposits |
444 | 168 | ||||||
Assets under supervision |
1,006 | 533 | ||||||
International |
||||||||
Assets under management |
229 | 196 | ||||||
Custody/brokerage/administration/deposits |
34 | 35 | ||||||
Assets under supervision |
263 | 231 | ||||||
Total Assets under supervision |
$ | 1,269 | $ | 764 | ||||
Memo: |
||||||||
Mutual fund assets: |
||||||||
Liquidity |
$ | 183 | $ | 103 | ||||
Fixed income |
41 | 27 | ||||||
Equity, balanced and other |
104 | 83 | ||||||
Total mutual funds assets |
$ | 328 | $ | 213 | ||||
Assets under supervision rollforward(b) |
||||||||
Beginning balance |
$ | 764 | $ | 642 | ||||
Net asset flows |
25 | (16 | ) | |||||
Acquisitions(c) |
383 | 41 | ||||||
Market/other impact |
97 | 97 | ||||||
Ending balance |
$ | 1,269 | $ | 764 | ||||
| (a) | Excludes Assets under management of American Century. |
|
| (b) | 2004 results include six months of the combined Firm’s results and six months of heritage
JPMorgan Chase results. 2003 reflects the results of heritage JPMorgan Chase only. |
|
| (c) | Reflects the Merger with Bank One ($376 billion) in the third quarter of 2004, the acquisition
of a majority interest in Highbridge Capital Management ($7 billion) in the fourth quarter of 2004
and the acquisition of RPS in the second quarter of 2003. |
| 46 | JPMorgan Chase & Co. / 2004 Annual Report |
Table of Contents
Corporate
The Corporate sector is comprised of Private Equity, Treasury, and corporate staff and other centrally managed expenses. Private Equity includes JPMorgan Partners and ONE Equity Partners businesses. Treasury manages the structural interest rate risk and investment portfolio for the Firm. The corporate staff areas include Central Technology and Operations, Internal Audit, Executive Office, Finance, General Services, Human Resources, Marketing & Communications, Office of the General Counsel, Real Estate and Business Services, Risk Management, and Strategy and Development. Other centrally managed expenses include items such as the Firm’s occupancy and pension expense, net of allocations to the business.
Selected income statement data
| Year ended December 31,(a) | ||||||||||||
| (in millions) | 2004 | 2003 | 2002 | |||||||||
Revenue |
||||||||||||
Securities / private equity gains |
$ | 1,786 | $ | 1,031 | $ | 334 | ||||||
Other income |
(2 | ) | 214 | (11 | ) | |||||||
Noninterest revenue |
1,784 | 1,245 | 323 | |||||||||
Net interest income |
(1,222 | ) | (177 | ) | (45 | ) | ||||||
Total net revenue |
562 | 1,068 | 278 | |||||||||
Provision for credit losses |
(110 | ) | 124 | 133 | ||||||||
Noninterest expense |
||||||||||||
Compensation expense |
2,426 | 1,893 | 1,867 | |||||||||
Noncompensation expense |
4,088 | 3,216 | 2,711 | |||||||||
Net expenses allocated to other businesses |
(5,213 | ) | (4,580 | ) | (4,070 | ) | ||||||
Total noninterest expense |
1,301 | 529 | 508 | |||||||||
Operating earnings before income
tax expense |
(629 | ) | 415 | (363 | ) | |||||||
Income tax expense (benefit) |
(690 | ) | (253 | ) | (128 | ) | ||||||
Operating earnings |
$ | 61 | $ | 668 | $ | (235 | ) | |||||
| (a) | 2004 results include six months of the combined Firm’s results and six months of heritage
JPMorgan Chase results. All other periods reflect the results of heritage JPMorgan Chase only. |
2004 compared with 2003
Noninterest revenue was $1.8 billion, up 43% from the prior year. The primary component of noninterest revenue is Securities/private equity gains, which totaled $1.8 billion, up 73% from the prior year. The increase was a result of net gains in the Private Equity portfolio of $1.4 billion in 2004, compared with $27 million in net gains in 2003. Partially offsetting these gains were lower investment securities gains in Treasury.
Net interest income was a negative $1.2 billion, compared with a negative $177 million in the prior year. The decline was driven primarily by actions and policies adopted in conjunction with the Merger.
Noninterest expense of $1.3 billion was up $772 million from the prior year due to the Merger. The Merger resulted in higher gross compensation and noncompensation expenses, which were partially offset by higher allocation of these expenses to the businesses. Incremental allocations to the businesses were lower than the gross expense increase due to certain policies adopted in conjunction with the Merger. These policies retain overhead costs that would not be incurred by the lines of business if operated on a stand-alone basis, as well as costs in excess of the market price for services provided by the corporate staff and technology and operations areas.
On September 15, 2004, JPMorgan Chase and IBM announced the Firm’s plans to reintegrate the portions of its technology infrastructure – including data centers, help desks, distributed computing, data networks and voice networks – that were previously outsourced to IBM. In January 2005, approximately 3,100 employees and 800 contract employees were transferred to the Firm.
2003 compared with 2002
Selected metrics
| Year ended December 31,(a) | ||||||||||||
| (in millions, except headcount) | 2004 | 2003 | 2002 | |||||||||
Selected average balance sheet |
||||||||||||
Short-term investments(b) |
$ | 14,590 | $ | 4,076 | $ | 7,691 | ||||||
Investment portfolio(c) |
63,475 | 63,506 | 61,816 | |||||||||
Goodwill(d) |
21,773 | 293 | 1,166 | |||||||||
Total assets |
162,234 | 104,395 | 97,089 | |||||||||
Headcount |
24,806 | 13,391 | 16,960 | |||||||||
Treasury |
||||||||||||
Securities gains (losses)(e) |
$ | 347 | $ | 999 | $ | 1,073 | ||||||
Investment portfolio (average) |
57,776 | 56,299 | 54,197 | |||||||||
| (a) | 2004 results include six months of the combined Firm’s results and six months of heritage
JPMorgan Chase results. All other periods reflect the results of heritage JPMorgan Chase only. |
|
| (b) | Represents Federal funds sold, Securities borrowed, Trading assets – debt and equity
instruments and Trading assets – derivative receivables. |
|
| (c) | Represents Investment securities and private equity investments. |
|
| (d) | As of July 1, 2004, the Firm changed the allocation methodology of goodwill to retain all
goodwill in Corporate. |
|
| (e) | Excludes gains/losses on securities used to manage risk associated with MSRs. |
| JPMorgan Chase & Co. / 2004 Annual Report | 47 |
Table of Contents
Management’s discussion and analysis
Selected income statement and
balance sheet data – Private equity
| Year ended December 31,(a) | ||||||||||||
| (in millions) | 2004 | 2003 | 2002 | |||||||||
Private equity gains (losses) |
||||||||||||
Direct investments |
||||||||||||
Realized gains |
$ | 1,423 | $ | 535 | $ | 452 | ||||||
Write-ups / write-downs |
(192 | ) | (404 | ) | (825 | ) | ||||||
Mark-to-market gains (losses) |
164 | 215 | (210 | ) | ||||||||
Total direct investments |
1,395 | 346 | (583 | ) | ||||||||
Third-party fund investments |
34 | (319 | ) | (150 | ) | |||||||
Total private equity gains (losses) |
1,429 | 27 | (733 | ) | ||||||||
Other income |
53 | 47 | 59 | |||||||||
Net interest income |
(271 | ) | (264 | ) | (302 | ) | ||||||
Total net revenue |
1,211 | (190 | ) | (976 | ) | |||||||
Total noninterest expense |
288 | 268 | 296 | |||||||||
Operating earnings (loss) before income
tax expense |
923 | (458 | ) | (1,272 | ) | |||||||
Income tax expense (benefit) |
321 | (168 | ) | (466 | ) | |||||||
Operating earnings (losses) |
$ | 602 | $ | (290 | ) | $ | (806 | ) | ||||
Private equity portfolio information(b) |
||||||||||||
Direct investments |
||||||||||||
Public securities |
||||||||||||
Carrying value |
$ | 1,170 | $ | 643 | $ | 520 | ||||||
Cost |
744 | 451 | 663 | |||||||||
Quoted public value |
1,758 | 994 | 761 | |||||||||
Private direct securities |
||||||||||||
Carrying value |
5,686 | 5,508 | 5,865 | |||||||||
Cost |
7,178 | 6,960 | 7,316 | |||||||||
Third-party fund investments(c) |
||||||||||||
Carrying value |
641 | 1,099 | 1,843 | |||||||||
Cost |
1,042 | 1,736 | 2,333 | |||||||||
Total private equity portfolio |
||||||||||||
Carrying value |
$ | 7,497 | $ | 7,250 | $ | 8,228 | ||||||
Cost |
$ | 8,964 | $ | 9,147 | $ | 10,312 | ||||||
| (a) | 2004 results include six months of the combined Firm’s results and six months of heritage
JPMorgan Chase results. All other periods reflect the results of heritage JPMorgan Chase only. |
|
| (b) | For further information on the Firm’s policies regarding the valuation of the private equity
portfolio, see Note 9 on pages 98–100 of this Annual Report. |
|
| (c) | Unfunded commitments to private third-party equity funds were $563 million, $1.3 billion and
$2.0 billion at December 31, 2004, 2003 and 2002, respectively. |
2004 compared with 2003
The carrying value of the Private Equity portfolio at December 31, 2004, was $7.5 billion, an increase of $247 million from December 31, 2003. The increase was primarily the result of the Merger. Otherwise, the portfolio declined as a result of sales of investments, consistent with management’s intention to reduce over time the capital committed to private equity. Sales of third-party fund investments resulted in a decrease in carrying value of $458 million, to $641 million at December 31, 2004, compared with $1.1 billion at December 31, 2003.
2003 compared with 2002
Private equity gains totaled $27 million in 2003, compared with losses of $733 million in 2002. Private equity recognized gains of $346 million on direct investments and losses of $319 million on sales and writedowns of private third-party fund investments.
| 48 | JPMorgan Chase & Co. / 2004 Annual Report |
Table of Contents
Balance sheet analysis
Selected balance sheet data
| December 31, (in millions) | 2004 | 2003(a) | ||||||
Assets |
||||||||
Trading assets – debt and equity instruments |
$ | 222,832 | $ | 169,120 | ||||
Trading assets – derivative receivables |
65,982 | 83,751 | ||||||
Securities: |
||||||||
Available-for-sale |
94,402 | 60,068 | ||||||
Held-to-maturity |
110 | 176 | ||||||
Loans, net of allowance |
394,794 | 210,243 | ||||||
Goodwill and other intangible assets |
57,887 | 14,991 | ||||||
All other assets |
321,241 | 232,563 | ||||||
Total assets |
$ | 1,157,248 | $ | 770,912 | ||||
Liabilities |
||||||||
Deposits |
$ | 521,456 | $ | 326,492 | ||||
Trading liabilities –
debt and equity instruments |
87,942 | 78,222 | ||||||
Trading liabilities – derivative payables |
63,265 | 71,226 | ||||||
Long-term debt |
95,422 | 48,014 | ||||||
All other liabilities |
283,510 | 200,804 | ||||||
Total liabilities |
1,051,595 | 724,758 | ||||||
Stockholders’ equity |
105,653 | 46,154 | ||||||
Total liabilities and stockholders’ equity |
$ | 1,157,248 | $ | 770,912 | ||||
| (a) | Heritage JPMorgan Chase only. |
Balance sheet overview
At December 31, 2004, the Firm’s total liabilities were $1.1 trillion, an increase of $327 billion, or 45%, from the prior year, again primarily as a result of the Merger. Merger-related growth in liabilities was primarily in interest-bearing U.S. deposits, long-term debt, trust preferred securities and beneficial interests issued by consolidated variable interest entities. Nonmerger-related growth in liabilities was primarily driven by increases in noninterest-bearing U.S. deposits and the IB’s trading activity, which is reflected in securities sold under repurchase agreements, partially offset by reductions in federal funds purchased.
Trading assets – debt and equity instruments
Trading assets and liabilities – derivative receivables and payables
Securities
Loans
Goodwill and other intangible assets
Deposits
Long-term debt
Stockholders’ equity
| JPMorgan Chase & Co. / 2004 Annual Report | 49 |
Table of Contents
Management’s discussion and analysis
Capital management
The Firm’s capital management framework is intended to ensure that there is capital sufficient to support the underlying risks of the Firm’s business activities, measured by economic risk capital, and to maintain “well-capitalized” status under regulatory requirements. In addition, the Firm holds capital above these requirements in amounts deemed appropriate to achieve management’s debt rating objectives. The Firm’s capital framework is integrated into the process of assigning equity to the lines of business. The Firm may refine its methodology for assigning equity to the lines of business as the merger integration process continues.
Line of business equity
The Firm’s framework for allocating capital is based on the following objectives:
| • | Integrate firmwide capital management activities with capital management activities within each
of the lines of business. |
|||
| • | Measure performance in each business segment consistently across all lines of business. |
|||
| • | Provide comparability with peer firms for each of the lines of business. |
|||
Equity for a line of business represents the amount the Firm believes the business would require if it were operating independently, incorporating sufficient capital to address economic risk measures, regulatory capital requirements, and capital levels for similarly rated peers. Return on equity is measured and internal targets for expected returns are established as a primary measure of a business segment’s performance.
For performance management purposes, the Firm does not allocate goodwill to the lines of business because it believes that the accounting-driven allocation of goodwill could distort assessment of relative returns. In management’s view, this approach fosters better comparison of line of business returns with other internal business segments, as well as with peers. The Firm assigns an amount of equity capital equal to the then current book value of its goodwill to the Corporate segment. The return on invested capital related to the Firm’s goodwill assets is managed within this segment. In accordance with SFAS 142, the Firm allocates goodwill to the lines of business based on the underlying fair values of the businesses and then performs the required impairment testing. For a further discussion of goodwill and impairment testing, see Critical accounting estimates and Note 15 on pages 77–79 and 109–111 respectively, of this Annual Report.
This integrated approach to assigning equity to the lines of business is a new methodology resulting from the Merger. Therefore, current year line of business equity is not comparable to equity assigned to the lines of business in prior years. The increase in average common equity in the table below for 2004 was primarily attributable to the Merger.
| (in billions) | Yearly Average | |||||||||||
| Line of business equity(a) | 2004 | 2003 | ||||||||||
Investment Bank |
$ | 17.3 | $ | 18.4 | ||||||||
Retail Financial Services |
9.1 | 4.2 | ||||||||||
Card Services |
7.6 | 3.4 | ||||||||||
Commercial Banking |
2.1 | 1.1 | ||||||||||
Treasury & Securities Services |
2.5 | 2.7 | ||||||||||
Asset & Wealth Management |
3.9 | 5.5 | ||||||||||
Corporate(b) |
33.1 | 7.7 | ||||||||||
Total common stockholders’ equity |
$ | 75.6 | $ | 43.0 | ||||||||
| (a) | 2004 results include six months of the combined Firm’s results and six months of
heritage JPMorgan Chase results. 2003 reflects the results of heritage JPMorgan Chase only. |
|
| (b) | 2004 includes $25.9 billion of equity to offset goodwill and $7.2 billion of equity primarily
related to Treasury, Private Equity and the Corporate Pension Plan. |
Economic risk capital
JPMorgan Chase assesses its capital adequacy relative to the underlying risks of the Firm’s business activities, utilizing internal risk-assessment methodologies. The Firm assigns economic capital based primarily on five risk factors: credit risk, market risk, operational risk and business risk for each business; and private equity risk, principally for the Firm’s private equity business.
| (in billions) | Yearly Average | |||||||||||
| Economic risk capital(a) | 2004 | 2003 | ||||||||||
Credit risk |
$ | 16.5 | $ | 13.1 | ||||||||
Market risk |
7.5 | 4.5 | ||||||||||
Operational risk |
4.5 | 3.5 | ||||||||||
Business risk |
1.9 | 1.7 | ||||||||||
Private equity risk |
4.5 | 5.4 | ||||||||||
Economic risk capital |
34.9 | 28.2 | ||||||||||
Goodwill |
25.9 | 8.1 | ||||||||||
Other(b) |
14.8 | 6.7 | ||||||||||
Total common stockholders’ equity |
$ | 75.6 | $ | 43.0 | ||||||||
| (a) | 2004 results include six months of the combined Firm’s results and six months of
heritage JPMorgan Chase results. 2003 reflects the results of heritage JPMorgan Chase only. |
|
| (b) | Additional capital required to meet internal regulatory/debt rating objectives. |
Credit risk capital
Credit risk capital for the overall wholesale credit portfolio is defined in terms of unexpected credit losses, from both defaults and declines in market value due to credit deterioration, measured over a one-year period at a confidence level consistent with the level of capitalization necessary to achieve a targeted ‘AA’ solvency standard. Unexpected losses are in excess of those for which provisions for credit losses are maintained. In addition to maturity and correlations, capital allocation is differentiated by several principal drivers of credit risk: exposure at default (or loan equivalent amount), likelihood of default, loss severity, and market credit spread.
| • | Loan equivalent amount for counterparty exposures in an over-the-counter derivative transaction
is represented by the expected positive exposure based on potential movements of underlying
market rates. Loan equivalents for unused revolving credit facilities represent the portion of an
unused commitment likely, based on the Firm’s average portfolio historical experience, to become
outstanding in the event an obligor defaults. |
|||
| • | Default likelihood is closely aligned with current market conditions for all publicly traded
names or investment banking clients, yielding a forward-looking measure of credit risk. This
facilitates more active risk management by utilizing the growing market in credit derivatives and
secondary market loan sales. For privately-held firms in the commercial banking portfolio, default
likelihood is based on longer term averages over an entire credit cycle. |
|||
| • | Loss severity of exposure is based on the Firm’s average historical experience during workouts,
with adjustments to account for collateral or subordination. |
|||
| • | Market credit spreads are used in the evaluation of changes in exposure value due to credit
deterioration. |
|||
| 50 | JPMorgan Chase & Co. / 2004 Annual Report |
Table of Contents
Credit risk capital for the consumer portfolio is intended to represent a capital level sufficient to support an ‘AA’ rating, and its allocation is based on product and other relevant risk segmentation. Actual segment level default and severity experience are used to estimate unexpected losses for a one-year horizon at a confidence level equivalent to the ‘AA’ solvency standard. Statistical results for certain segments or portfolios are adjusted upward to ensure that capital is consistent with external benchmarks, including subordination levels on market transactions and capital held at representative monoline competitors, where appropriate.
Market risk capital
Operational risk capital
Business risk capital
Private equity risk capital
Regulatory capital
The Firm’s federal banking regulator, the FRB, establishes capital requirements, including well-capitalized standards for the consolidated financial holding company. The Office of the Comptroller of the Currency (“OCC”) establishes similar capital requirements and standards for the Firm’s national
banks, including JPMorgan Chase Bank, National Association (“JPMorgan Chase Bank”) and Chase Bank USA, National Association.
On March 1, 2005, the FRB issued a final rule that continues the inclusion of trust preferred securities in Tier 1 capital, subject to stricter quantitative limits. The rule provides for a five-year transition period. The Firm is currently assessing the impact of the final rule. The effective date of the final rule is dependent on the date of publication in the Federal Register.
On July 20, 2004, the federal banking regulatory agencies issued a final rule that excludes assets of asset-backed commercial paper programs that are consolidated as a result of FIN 46R from risk-weighted assets for purposes of computing Tier 1 and Total risk-based capital ratios. The final rule also requires that capital be held against short-term liquidity facilities supporting asset-backed commercial paper programs. The final rule became effective September 30, 2004. Adoption of the rule did not have a material effect on the capital ratios of the Firm. In addition, under the final rule, both short- and long-term liquidity facilities will be subject to certain asset quality tests effective September 30, 2005.
The following tables show that JPMorgan Chase maintained a well-capitalized position based on Tier 1 and Total capital ratios at December 31, 2004 and 2003.
Capital ratios
| Well- | ||||||||||||
| capitalized | ||||||||||||
| December 31, | 2004 | 2003(a) | ratios | |||||||||
Tier 1 capital ratio |
8.7 | % | 8.5 | % | 6.0 | % | ||||||
Total capital ratio |
12.2 | 11.8 | 10.0 | |||||||||
Tier 1 leverage ratio |
6.2 | 5.6 | NA | |||||||||
Total stockholders’ equity to assets |
9.1 | 6.0 | NA | |||||||||
| (a) | Heritage JPMorgan Chase only. |
Risk-based capital components and assets
| December 31, (in millions) | 2004 | 2003 | (a) | |||||||||
Total Tier 1 capital |
$ | 68,621 | $ | 43,167 | ||||||||
Total Tier 2 capital |
28,186 | 16,649 | ||||||||||
Total capital |
$ | 96,807 | $ | 59,816 | ||||||||
Risk-weighted assets |
$ | 791,373 | $ | 507,456 | ||||||||
Total adjusted average assets |
1,102,456 | 765,910 | ||||||||||
| (a) | Heritage JPMorgan Chase only. |
Tier 1 capital was $68.6 billion at December 31, 2004, compared with $43.2 billion at December 31, 2003, an increase of $25.4 billion. The increase was due to an increase in common stockholders’ equity of $60.2 billion, primarily driven by stock issued in connection with the Merger of $57.3 billion and net income of $4.5 billion; these were partially offset by dividends paid of $3.9 billion and common share repurchases of $738 million. The Merger added Tier 1 components such as $3.0 billion of additional qualifying trust preferred securities and $493 million of minority interests in consolidated subsidiaries; Tier 1 deductions resulting from the Merger included $34.1 billion of merger-related goodwill, and $3.4 billion of nonqualifying intangibles.
Additional information regarding the Firm’s capital ratios and the associated components and assets, and a more detailed discussion of federal regulatory capital standards are presented in Note 24 on pages 116–117 of this Annual Report.
| JPMorgan Chase & Co. / 2004 Annual Report | 51 |
Table of Contents
Management’s discussion and analysis
Basel II
The Basel Committee on Banking Supervision published the new Basel II Framework in 2004 in an effort to update the original international bank capital accord (“Basel I”), in effect since 1988. The goal of the Basel II Framework is to improve the consistency of capital requirements internationally, make regulatory capital more risk sensitive, and promote enhanced risk management practices among large, internationally active banking organizations. JPMorgan Chase supports the overall objectives of the Basel II Framework.
U.S. banking regulators are in the process of incorporating the Basel II Framework into the existing risk-based capital requirements. JPMorgan Chase will be required to implement advanced measurement techniques employing its internal estimates of certain key risk drivers to derive capital requirements. Prior to implementation of the new Basel II Framework, JPMorgan Chase will be required to demonstrate to the FRB that its internal criteria meet the relevant supervisory standards. The Basel II Framework will be fully effective in January 2008. JPMorgan Chase expects to implement the Basel II Framework within this timeframe.
JPMorgan Chase is currently analyzing local Basel II requirements in major jurisdictions outside the U.S. where it operates. Based on the results of this analysis, different approaches may be implemented in various jurisdictions.
Dividends
The Firm’s common stock dividend policy reflects its earnings outlook, desired payout ratios, the need to maintain an adequate capital level and alternative investment opportunities. In 2004, JPMorgan Chase declared a quarterly cash dividend on its common stock of $0.34 per share. The Firm anticipates a dividend payout ratio in 2005 of 30-40% of operating earnings.
Stock repurchases
On July 20, 2004, the Board of Directors approved an initial stock repurchase program in the
aggregate amount of $6.0 billion. This amount includes shares to be repurchased to offset issuances
under the Firm’s employee equity-based plans. The actual amount of shares repurchased will be
subject to various factors, including market conditions; legal considerations affecting the amount
and timing of repurchase activity; the Firm’s capital position (taking into account purchase
accounting adjustments); internal capital generation; and alternative potential investment
opportunities. During 2004, under the stock repurchase program, the Firm repurchased 19.3 million
shares for $738 million at an average price per share of $38.27. The Firm did not repurchase any
shares of its common stock during 2003.
Off–balance sheet arrangements and contractual cash obligations
Special-purpose entities
JPMorgan Chase is involved with several types of off-balance sheet arrangements including special purpose entities (“SPEs”), lines of credit and loan commitments. The principal uses of SPEs are to obtain sources of liquidity for JPMorgan Chase and its clients by securitizing their financial assets, and to create other investment products for clients. These arrangements are an important part of the financial markets, providing market liquidity by facilitating investors’ access to specific portfolios of assets and risks. For example, SPEs are integral to the markets for mortgage-backed securities, commercial paper, and other asset-backed securities.
The basic SPE structure involves a company selling assets to the SPE. The SPE funds the purchase of those assets by issuing securities to investors. To insulate investors from creditors of other entities, including the seller of assets, SPEs are often structured to be bankruptcy-remote.
JPMorgan Chase is involved with SPEs in three broad categories of transactions: loan securitizations, multi-seller conduits and client intermediation. Capital is held, as appropriate, against all SPE-related transactions and related exposures, such as derivative transactions and lending-related commitments. For a further discussion of SPEs and the Firm’s accounting for them, see Note 1 on page 88, Note 13 on pages 103–106 and Note 14 on pages 106–109 of this Annual Report.
The Firm has no commitments to issue its own stock to support any SPE transaction, and its policies require that transactions with SPEs be conducted at arm’s length and reflect market pricing. Consistent with this policy, no JPMorgan Chase employee is permitted to invest in SPEs with which the Firm is involved where such investment would violate the Firm’s Worldwide Rules
of Conduct. These rules prohibit employees from self-dealing and prohibit employees from acting on behalf of the Firm in transactions with which they or their family have any significant financial interest.
For certain liquidity commitments to SPEs, the Firm could be required to provide funding if the credit rating of JPMorgan Chase Bank were downgraded below specific levels, primarily P-1, A-1 and F1 for Moody’s, Standard & Poor’s and Fitch, respectively. The amount of these liquidity commitments was $79.4 billion and $34.0 billion at December 31, 2004 and 2003, respectively. Alternatively, if JPMorgan Chase Bank were downgraded, the Firm could be replaced by another liquidity provider in lieu of funding under the liquidity commitment, or, in certain circumstances, could facilitate the sale or refinancing of the assets in the SPE in order to provide liquidity.
Of its $79.4 billion in liquidity commitments to SPEs at December 31, 2004, $47.7 billion is included in the Firm’s total other unfunded commitments to extend credit, included in the table below (compared with $27.7 billion at December 31, 2003). As a result of the Firm’s consolidation of multi-seller conduits in accordance with FIN 46R, $31.7 billion of these commitments are excluded from the table (compared with $6.3 billion at December 31, 2003), as the underlying assets of the SPEs have been included on the Firm’s Consolidated balance sheets.
The revenue reported in the table below primarily represents servicing and custodial fee income. The Firm also has exposure to certain SPEs arising from derivative transactions; these transactions are recorded at fair value on the Firm’s Consolidated balance sheets with changes in fair value (i.e., MTM gains and losses) recorded in Trading revenue. Such MTM gains and losses are not included in the revenue amounts reported in the table below.
| 52 | JPMorgan Chase & Co. / 2004 Annual Report |
Table of Contents
The following table summarizes certain revenue information related to variable interest entities (“VIEs”) with which the Firm has significant involvement, and qualifying SPEs (“QSPEs”). For a further discussion of VIEs and QSPEs, see Note 1 on page 88 of this Annual Report.
Revenue from VIEs and QSPEs
| Year ended December 31,(a) | ||||||||||||
| (in millions) | VIEs(b) | QSPEs | Total | |||||||||
2004 |
$ | 154 | $ | 1,438 | $ | 1,592 | ||||||
2003 |
79 | 979 | 1,058 | |||||||||
| (a) | 2004 results include six months of the combined Firm’s results and six months of heritage
JPMorgan Chase results. 2003 reflects the results of heritage JPMorgan Chase only. |
|
| (b) | Includes VIE-related revenue (i.e., revenue associated with consolidated and significant
nonconsolidated VIEs). |
Contractual cash obligations
instruments and significant contractual cash obligations, by remaining maturity, at December 31, 2004. For a discussion regarding Long-term debt and trust preferred capital securities, see Note 17 on pages 112–113 of this Annual Report. For a discussion regarding operating leases, see Note 25 on page 117 of this Annual Report.
Contractual purchases include commitments for future cash expenditures, primarily related to services. Capital expenditures primarily represent future cash payments for real estate–related obligations and equipment. Contractual purchases and capital expenditures at December 31, 2004, reflect the minimum contractual obligation under legally enforceable contracts with contract terms that are both fixed and determinable. Excluded from the following table are a number of obligations to be settled in cash, primarily in under one year. These obligations are reflected on the Firm’s Consolidated balance sheets and include Federal funds purchased and securities sold under repurchase agreements; Other borrowed funds; purchases of Debt and equity instruments that settle within standard market timeframes (e.g., regular-way); Derivative payables that do not require physical delivery of the underlying instrument; and certain purchases of instruments that resulted in settlement failures.
Off–balance sheet lending-related financial instruments
| By remaining maturity at December 31, 2004 | Under | 1–3 | 3–5 | After | ||||||||||||||||
| (in millions) | 1 year | years | years | 5 years | Total | |||||||||||||||
Consumer |
$ | 552,748 | $ | 3,603 | $ | 2,799 | $ | 42,046 | $ | 601,196 | ||||||||||
Wholesale: |
||||||||||||||||||||
Other unfunded commitments to extend credit(a)(b) |
114,555 | 57,183 | 48,987 | 4,427 | 225,152 | |||||||||||||||
Standby letters of credit and guarantees(a) |
22,785 | 30,805 | 21,387 | 3,107 | 78,084 | |||||||||||||||
Other letters of credit(a) |
4,631 | 1,297 | 190 | 45 | 6,163 | |||||||||||||||
Total wholesale |
141,971 | 89,285 | 70,564 | 7,579 | 309,399 | |||||||||||||||
Total lending-related commitments |
$ | 694,719 | $ | 92,888 | $ | 73,363 | $ | 49,625 | $ | 910,595 | ||||||||||
Contractual cash obligations |
||||||||||||||||||||
By remaining maturity at December 31, 2004 (in millions) |
||||||||||||||||||||
Certificates of deposit of $100,000 and over |
$ | 38,946 | $ | 7,941 | $ | 1,176 | $ | 1,221 | $ | 49,284 | ||||||||||
Long-term debt |
15,833 | 30,890 | 23,527 | 25,172 | 95,422 | |||||||||||||||
Trust preferred capital securities |
— | — | — | 10,296 | 10,296 | |||||||||||||||
FIN 46R long-term beneficial interests(c) |
3,072 | 708 | 203 | 2,410 | 6,393 | |||||||||||||||
Operating leases(d) |
1,060 | 1,878 | 1,614 | 5,301 | 9,853 | |||||||||||||||
Contractual purchases and capital expenditures |
1,791 | 518 | 252 | 181 | 2,742 | |||||||||||||||
Obligations under affinity and co-brand programs |
868 | 2,442 | 1,086 | 6 | 4,402 | |||||||||||||||
Other liabilities(e) |
968 | 1,567 | 1,885 | 6,546 | 10,966 | |||||||||||||||
Total |
$ | 62,538 | $ | 45,944 | $ | 29,743 | $ | 51,133 | $ | 189,358 | ||||||||||
| (a) | Represents contractual amount net of risk participations totaling $26 billion at December
31, 2004. |
|
| (b) | Includes unused advised lines of credit totaling $23 billion at December 31, 2004, which are
not legally binding. In regulatory filings with the FRB, unused advised lines are not reportable. |
|
| (c) | Included on the Consolidated balance sheets in Beneficial interests issued by consolidated
variable interest entities. |
|
| (d) | Excludes benefit of noncancelable sublease rentals of $689 million at December 31, 2004. |
|
| (e) | Includes deferred annuity contracts and expected funding for pension and other postretirement
benefits for 2005. Funding requirements for pension and postretirement benefits after 2005 are excluded due to the significant variability in the assumptions required to project the timing of future cash payments. |
| JPMorgan Chase & Co. / 2004 Annual Report | 53 |
Table of Contents
Management’s discussion and analysis
Risk management
The Firm’s ability to properly identify, measure, monitor and report risk is critical to its soundness and profitability.
| • | Risk identification: The Firm identifies risk by dynamically assessing
the potential impact of internal and external factors on transactions and
positions. Business and risk professionals develop appropriate mitigation
strategies for the identified risks. |
| • | Risk measurement: The
Firm measures risk using a variety of methodologies,
including calculating probable loss, unexpected loss and
value-at-risk,
and by conducting stress tests and making comparisons to external
benchmarks. Measurement models and related assumptions are routinely
reviewed to ensure that the Firm’s risk estimates are reasonable and reflective of underlying positions. |
| • | Risk monitoring/Control: The Firm establishes risk management policies
and procedures. These policies contain approved limits by customer, product and business that are monitored on a daily, weekly and monthly basis
as appropriate. |
| • | Risk reporting: Risk reporting covers all lines of business and is provided to management on a
daily, weekly and monthly basis as appropriate. |
Risk governance
In addition to the Risk Committees, there is an Asset & Liability Committee (“ALCO”), which oversees structural interest rate and liquidity risk as well as the Firm’s funds transfer pricing policy, through which lines of business transfer market-hedgable interest rate risk to Treasury. Treasury also has responsibility for decisions relating to its risk strategy, policies and control. There is also an Investment Committee, which reviews key aspects of the Firm’s global M&A activities that are undertaken for its own account and that fall outside the scope of established private equity and other principal finance activities.

Overlaying risk management within the lines of business is the corporate function of Risk Management which, under the direction of the Chief Risk Officer reporting to the President and Chief Operating Officer, provides an independent firmwide function for control and management of risk. Within
Risk Management are those units responsible for credit risk, market risk, operational risk, fiduciary risk, principal risk, and risk technology and operations, as well as Risk Management Services, which is responsible for credit risk policy and methodology, risk reporting and risk education.
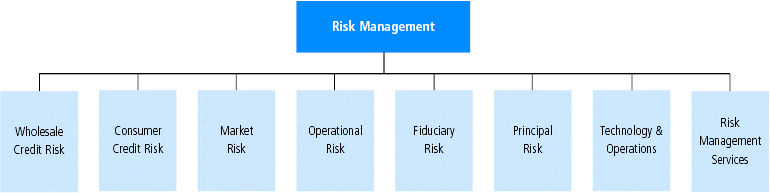
| 54 | JPMorgan Chase & Co./2004 Annual Report |
Table of Contents
The Board of Directors exercises oversight of risk management as a whole and through the Board’s Audit Committee and the Risk Policy Committee. The Audit Committee is responsible for oversight of guidelines and policies to govern the process by which risk assessment and management is undertaken. In addition, the Audit Committee reviews with management the system of internal controls and financial reporting that is relied upon to provide reasonable assurance of compliance with the Firm’s operational risk management processes. The Risk Policy Committee is responsible for oversight of management’s
responsibilities to assess and manage the Firm’s credit risk, market risk, interest rate risk, investment risk and liquidity risk, and is also responsible for review of the Firm’s fiduciary and asset management activities. Both committees are responsible for oversight of reputational risk. The Chief Risk Officer and other management report on the risks of the Firm to the Board of Directors, particularly through the Board’s Audit Committee and Risk Policy Committee.
The major risk types identified by the Firm are discussed in the following sections.
Liquidity risk management
Risk identification and measurement
The Firm’s three primary measures of liquidity are:
| • | Holding company short-term position: Measures the parent holding
company’s ability to repay all obligations with a maturity less than one
year at a time when the ability of the Firm’s banks to pay dividends to
the parent holding company is constrained. |
|||
| • | Cash capital surplus: Measures the Firm’s ability to fund assets on a
fully collateralized basis, assuming access to unsecured funding is lost. |
|||
| • | Basic surplus: Measures JPMorgan Chase Bank’s ability to sustain a
90-day stress event that is specific to the Firm where no new funding
can be raised to meet obligations as they come due. |
|||
All three primary liquidity measures are managed to provide sufficient surplus in the Firm’s liquidity position.
Risk monitoring and reporting
downgrade at both the parent and bank level, and calculates the estimated loss of funding as well as the increase in annual funding costs in both scenarios. A trigger-risk funding analysis considers the impact of a bank downgrade below A-1/P-1, including the funding requirements that would be required if such an event were to occur. These liquidity analytics rely on management’s judgment about JPMorgan Chase’s ability to liquidate assets or use them as collateral for borrowings and take into account credit risk management’s historical data on the funding of loan commitments (e.g., commercial paper back-up facilities), liquidity commitments to SPEs, commitments with rating triggers and collateral posting requirements. For a further discussion of SPEs and other off-balance sheet arrangements, see Off-balance sheet arrangements and contractual cash obligations on pages 52-53, as well as Note 1, Note 13, Note 14 and Note 27 on pages 88, 103-106, 106-109, and 119-120, respectively, of this Annual Report.
Funding
Sources of funds
Additional funding flexibility is provided by the Firm’s ability to access the repurchase and asset securitization markets. At December 31, 2004, $72 billion of securities were available for repurchase agreements, and $36 billion of credit card, automobile and mortgage loans were available for securitizations. These alternatives are evaluated on an ongoing basis to achieve an appropriate balance of secured and unsecured funding. The ability to securitize loans, and the associated gains on those securitizations, are principally dependent on the credit quality and yields of the assets securitized and are generally not dependent on the credit ratings of the issuing entity. Transactions between the Firm and its securitization structures are reflected in JPMorgan Chase’s consolidated financial statements; these relationships include retained interests in securitization trusts, liquidity facilities and derivative transactions. For further details, see Notes 13 and 14 on pages 103-106 and 106-109, respectively, of this Annual Report.
| JPMorgan Chase & Co./2004 Annual Report | 55 |
Table of Contents
Management’s discussion and analysis
The Firm is an active participant in the global financial markets. These markets serve as a cost-effective source of funds and are a critical component of the Firm’s liquidity management. Decisions concerning the timing and tenor of accessing these markets are based on relative costs, general market conditions, prospective views of balance sheet growth and a targeted liquidity profile.
Issuance
company sufficient to cover maturing obligations over the next 12 months and to support the less liquid assets on its balance sheet. High investor cash positions and increased foreign investor participation in the corporate markets allowed JPMorgan Chase to diversify further its funding across the global markets while decreasing funding costs and lengthening maturities.
During 2004, JPMorgan Chase issued approximately $25.3 billion of long-term debt and capital securities. These issuances were partially offset by $ 16.0 billion of long-term debt and capital securities that matured or were redeemed, and the Firm’s redemption of $670 million of preferred stock. In addition, in 2004 the Firm securitized approximately $6.5 billion of residential mortgage loans, $8.9 billion of credit card loans and $1.6 billion of automobile loans, resulting in pre-tax gains (losses) on securitizations of $47 million, $52 million and $(3) million, respectively. For a further discussion of loan securitizations, see Note 13 on pages 103-106 of this Annual Report.
Credit ratings
The credit ratings of JPMorgan Chase’s parent holding company and each of its significant banking subsidiaries, as of December 31, 2004, were as follows:
| Short-term debt | Senior long-term debt | ||||||||||||
| Moody's | S&P | Fitch | Moody's | S&P | Fitch | ||||||||
JPMorgan Chase & Co.
|
P-1 | A-1 | F1 | Aa3 | A+ | A+ | |||||||
JPMorgan Chase Bank, N.A.
|
P-1 | A-1 + | F1 + | Aa2 | AA- | A+ | |||||||
Chase Bank USA, N.A.
|
P-1 | A-1 + | F1 + | Aa2 | AA- | A+ | |||||||
The Firm’s principal insurance subsidiaries had the following financial strength ratings as of December 31, 2004:
| Moody's | S&P | A.M. Best | ||||
Chase Insurance Life and Annuity Company
|
A2 | A+ | A | |||
Chase Insurance Life Company
|
A2 | A+ | A | |||
In connection with the Merger, Moody’s upgraded the ratings of the Firm by one notch, moving the parent holding company’s senior long-term debt rating to Aa3 and JPMorgan Chase Bank’s senior long-term debt rating to Aa2; and changed its outlook to stable. Also at that time, Fitch affirmed its ratings and changed its outlook to positive, while S&P affirmed all its ratings and kept its outlook stable.
The cost and availability of unsecured financing are influenced by credit ratings. A reduction in these ratings could adversely affect the Firm’s access to
liquidity sources, increase the cost of funds, trigger additional collateral requirements and decrease the number of investors and counterparties willing to lend. Critical factors in maintaining high credit ratings include a stable and diverse earnings stream; strong capital ratios; strong credit quality and risk management controls; diverse funding sources; and strong liquidity monitoring procedures.
If the Firm’s ratings were downgraded by one notch, the Firm estimates the incremental cost of funds and the potential loss of funding to be negligible. Additionally, the Firm estimates the additional funding requirements for VIEs and other third-party commitments would not be material. In the current environment, the Firm believes a downgrade is unlikely. For additional information on the impact of a credit ratings downgrade on funding requirements for VIEs, and on derivatives and collateral agreements, see Off-balance Sheet Arrangements on pages 52-53 and Ratings profile of derivative receivables mark-to-market (“MTM”) on page 64, of this Annual Report.
| 56 | JPMorgan Chase & Co./2004 Annual Report |
Table of Contents
Credit risk management
loan originations (primarily to IB clients) continue to be distributed into the marketplace, with residual holds by the Firm averaging less than 10%. With regard to the prime consumer credit market, the Firm focuses on creating a portfolio that is diversified from both a product and a geographical perspective.
The Firm’s credit risk management governance structure consists of the primary functions as described in the organizational chart below.
Credit risk organization

| JPMorgan Chase & Co./2004 Annual Report | 57 |
Table of Contents
Management’s discussion and analysis
In 2004, the Firm continued to enhance its risk management discipline, managing wholesale single-name and industry concentration through its threshold and limit structure and using credit derivatives and loan sales in its portfolio management activity. The Firm manages wholesale exposure concentrations by obligor, risk rating, industry and geography. In addition, the Firm continued to make progress under its multi-year initiative to reengineer specific components of the credit risk infrastructure. The goal is to enhance the Firm’s ability to provide immediate and accurate risk and exposure information; actively manage credit risk in the retained portfolio; support client relationships; more quickly manage the allocation of economic capital; and comply with Basel II initiatives.
In 2004, the Firm continued to grow its consumer loan portfolio, focusing on businesses providing the most appropriate risk/reward relationship while keeping within the Firm’s desired risk tolerance. During the past year, the Firm also completed a strategic review of all consumer lending portfolio segments. This action resulted in the sale of the $4 billion manufactured home loan portfolio, de-emphasizing vehicle leasing and, subsequent to year-end 2004, the sale of a $2 billion recreational vehicle portfolio. Continued growth in the core consumer lending product set (residential real estate, auto and education finance, credit cards and small business) reflected a focus on the prime credit quality segment of the market.
Risk identification
Risk measurement
Credit risk measurement is based on the amount of exposure should the obligor or the counterparty default, and the loss severity given a default event. Based on these factors and related market-based inputs, the Firm estimates both probable and unexpected losses for the wholesale and consumer portfolios. Probable losses, reflected in the Provision for credit losses, are statistically-based estimates of credit losses over time, anticipated as a result of obligor or counterparty default. However, probable losses are not the sole indicators of risk. If losses were entirely predictable, the probable loss rate could be factored into pricing and covered as a normal and recurring cost of doing business. Unexpected losses, reflected in the allocation of credit risk capital, represent the potential volatility of actual losses relative to the probable level of losses (refer to Capital management on pages 50-51 of this Annual Report for a further discussion of the credit risk capital methodology). Risk measurement for the wholesale portfolio is primarily based on risk-rated exposure; and for the consumer portfolio it is based on credit-scored exposure.
Risk-rated exposure
Credit-scored exposure
Risk monitoring
In order to meet its credit risk management objectives, the Firm seeks to maintain a risk profile that is diverse in terms of borrower, product type, industry and geographic concentration. Additional diversification of the Firm’s exposure is accomplished through syndication of credits, participations, loan sales, securitizations, credit derivatives and other risk-reduction techniques.
Risk reporting
| 58 | JPMorgan Chase & Co./2004 Annual Report |
Table of Contents
Credit portfolio
Wholesale and consumer credit portfolio
| As of or for the | ||||||||||||||||||||||||||||||||
| year ended | Nonperforming | Average annual | ||||||||||||||||||||||||||||||
| December 31,(a) | Credit exposure | assets(t)(u) | Net charge-offs | net charge-off rate | ||||||||||||||||||||||||||||
| (in millions, except ratios) | 2004 | 2003 | 2004 | 2003 | 2004 | 2003 | 2004 | 2003 | ||||||||||||||||||||||||
Wholesale(b)(c)(d) |
||||||||||||||||||||||||||||||||
Loans – reported(e) |
$ | 135,067 | $ | 75,419 | $ | 1,574 | $ | 2,004 | $ | 186 | $ | 765 | 0.19 | % | 0.97 | % | ||||||||||||||||
Derivative receivables(f)(g) |
65,982 | 83,751 | 241 | 253 | NA | NA | NA | NA | ||||||||||||||||||||||||
Interests in purchased receivables |
31,722 | 4,752 | — | — | NA | NA | NA | NA | ||||||||||||||||||||||||
Other receivables |
— | 108 | — | 108 | NA | NA | NA | NA | ||||||||||||||||||||||||
Total wholesale credit-related assets(e) |
232,771 | 164,030 | 1,815 | 2,365 | 186 | 765 | 0.19 | 0.97 | ||||||||||||||||||||||||
Lending-related commitments(h)(i) |
309,399 | 211,483 | NA | NA | NA | NA | NA | NA | ||||||||||||||||||||||||
Total wholesale credit exposure(e)(j) |
$ | 542,170 | $ | 375,513 | $ | 1,815 | $ | 2,365 | $ | 186 | $ | 765 | 0.19 | % | 0.97 | % | ||||||||||||||||
Consumer(c)(k)(l) |
||||||||||||||||||||||||||||||||
Loans – reported(m) |
$ | 267,047 | $ | 139,347 | $ | 1,169 | $ | 580 | $ | 2,913 | $ | 1,507 | 1.56 | % | 1.33 | % | ||||||||||||||||
Loans – securitized(m)(n) |
70,795 | 34,856 | — | — | 2,898 | 1,870 | 5.51 | 5.64 | ||||||||||||||||||||||||
Total managed consumer loans(m) |
$ | 337,842 | $ | 174,203 | $ | 1,169 | $ | 580 | $ | 5,811 | $ | 3,377 | 2.43 | % | 2.31 | % | ||||||||||||||||
Lending-related commitments |
601,196 | 181,198 | NA | NA | NA | NA | NA | NA | ||||||||||||||||||||||||
Total consumer credit exposure(o) |
$ | 939,038 | $ | 355,401 | $ | 1,169 | $ | 580 | $ | 5,811 | $ | 3,377 | 2.43 | % | 2.31 | % | ||||||||||||||||
Total credit portfolio |
||||||||||||||||||||||||||||||||
Loans – reported |
$ | 402,114 | $ | 214,766 | $ | 2,743 | $ | 2,584 | $ | 3,099 | $ | 2,272 | 1.08 | % | 1.19 | % | ||||||||||||||||
Loans – securitized(n) |
70,795 | 34,856 | — | — | 2,898 | 1,870 | 5.51 | 5.64 | ||||||||||||||||||||||||
Total managed loans |
472,909 | 249,622 | 2,743 | 2,584 | 5,997 | 4,142 | 1.76 | 1.84 | ||||||||||||||||||||||||
Derivative receivables(f)(g) |
65,982 | 83,751 | 241 | 253 | NA | NA | NA | NA | ||||||||||||||||||||||||
Interests in purchased receivables |
31,722 | 4,752 | — | — | NA | NA | NA | NA | ||||||||||||||||||||||||
Other receivables |
— | 108 | — | 108 | NA | NA | NA | NA | ||||||||||||||||||||||||
Total managed credit-related assets |
570,613 | 338,233 | 2,984 | 2,945 | 5,997 | 4,142 | 1.76 | 1.84 | ||||||||||||||||||||||||
Wholesale lending-related commitments(h)(i) |
309,399 | 211,483 | NA | NA | NA | NA | NA | NA | ||||||||||||||||||||||||
Consumer lending-related commitments |
601,196 | 181,198 | NA | NA | NA | NA | NA | NA | ||||||||||||||||||||||||
Assets acquired in loan satisfactions(p) |
NA | NA | 247 | 216 | NA | NA | NA | NA | ||||||||||||||||||||||||
Total credit portfolio(q) |
$ | 1,481,208 | $ | 730,914 | $ | 3,231 | $ | 3,161 | $ | 5,997 | $ | 4,142 | 1.76 | % | 1.84 | % | ||||||||||||||||
Purchased held-for-sale wholesale loans(r) |
$ | 351 | $ | 22 | $ | 351 | $ | 22 | NA | NA | NA | NA | ||||||||||||||||||||
Credit derivative hedges notional(s) |
(37,200 | ) | (37,282 | ) | (15 | ) | (123 | ) | NA | NA | NA | NA | ||||||||||||||||||||
Collateral held against derivatives |
(9,301 | ) | (36,214 | ) | NA | NA | NA | NA | NA | NA | ||||||||||||||||||||||
| (a) | 2004 results include six months of the combined Firm’s results and six months of heritage
JPMorgan Chase results. 2003 reflects the results of heritage JPMorgan Chase only. |
|
| (b) | Includes Investment Bank, Commercial Banking, Treasury & Securities Services and Asset & Wealth
Management. |
|
| (c) | Amounts are presented gross of the Allowance for loan losses. |
|
| (d) | Net charge-off rates exclude year-to-date average wholesale loans HFS of $6.4 billion and $3.8
billion for 2004 and 2003, respectively. |
|
| (e) | Wholesale loans past-due 90 days and over and accruing were $8 million and $42 million
at December 31, 2004 and 2003, respectively. |
|
| (f) | The 2004 amount includes the effect of legally enforceable master netting agreements.
Effective January 1, 2004, the Firm elected to report the fair value of derivative assets and
liabilities net of cash
received and paid, respectively, under legally enforceable master netting agreements. As of
December 31, 2004, derivative receivables were $98 billion before netting of $32 billion
of cash collateral held. |
|
| (g) | The Firm also views its credit exposure on an economic basis. For derivative receivables,
economic credit exposure is the three-year averages of a measure known as Average exposure
(which is the expected
MTM value of derivative receivables at future time periods, including the benefit of collateral).
Average exposure was $38 billion and $34 billion at December 31, 2004 and December 31, 2003,
respectively.
See pages 62-64 of this Annual Report for a further discussion of the Firm’s derivative
receivables. |
|
| (h) | The Firm also views its credit exposure on an economic basis. For lending-related
commitments, economic credit exposure is represented by a “loan equivalent,” which is the
portion of the unused commitments or other contingent exposure that is expected, based on average portfolio historical
experience, to become outstanding in the event of a default by the obligor. Loan equivalents
were $162 billion and $104 billion at December 31, 2004 and 2003, respectively.
See page 65 of this Annual Report for a further discussion of this measure. |
|
| (i) | Includes unused advised lines of credit totaling $23 billion and $19 billion at December
31, 2004 and 2003, respectively, which are not legally binding. In regulatory filings with the
FRB, unused advised lines are not reportable. |
|
| (j) | Represents Total wholesale loans, Derivative receivables, Interests in purchased receivables,
Other receivables and Wholesale lending-related commitments. |
|
| (k) | Net charge-off rates exclude year-to-date average HFS consumer loans (excluding Card) in the
amount of $14.7 billion and $25.3 billion for 2004 and 2003, respectively. |
|
| (l) | Includes Retail Financial Services and Card Services. |
|
| (m) | Past-due loans 90 days and over and accruing includes credit card receivables of $998
million and $273 million, and related credit card securitizations of $1.3 billion and $879
million, at December 31, 2004 and 2003, respectively. |
|
| (n) | Represents securitized credit cards. For a further discussion of credit card securitizations,
see Card Services on pages 39-40 of this Annual Report. |
|
| (o) | Represents Total consumer loans, Credit card securitizations and Consumer lending-related
commitments. |
|
| (p) | At December 31, 2004 and 2003, includes $23 million and $10 million, respectively, of
wholesale assets acquired in loan satisfactions, and $224 million and $206 million,
respectively, of consumer assets acquired in loan satisfactions. |
|
| (q) | At December 31, 2004 and 2003, excludes $1.5 billion and $2.3 billion, respectively, of
residential mortgage receivables in foreclosure status that are insured by government
agencies. These amounts are excluded as reimbursement is proceeding normally. |
|
| (r) | Represents distressed wholesale loans purchased as part of IB’s proprietary investing
activities. |
|
| (s) | Represents the notional amount of single-name and portfolio credit derivatives used to manage
the credit risk of wholesale credit exposure; these derivatives do not qualify for hedge accounting
under SFAS 133. |
|
| (t) | Excludes purchased held-for-sale (“HFS”) wholesale loans. |
|
| (u) | Nonperforming assets include wholesale HFS loans of $2 million and $30 million for 2004 and
2003, respectively, and consumer HFS loans of $13 million and $45 million for 2004 and 2003,
respectively. HFS loans are carried at the lower of cost or market, and declines in value
are recorded in Other income. |
|
NA — Not applicable. |
||
| JPMorgan Chase & Co./2004 Annual Report | 59 |
Table of Contents
Management’s discussion and analysis
JPMorgan Chase & Co.
Wholesale credit portfolio
The increase in total wholesale exposure was almost entirely due to the Merger. Derivative receivables declined by $18 billion, primarily because, effective January 1, 2004, the Firm elected to report the fair value of derivative assets and liabilities net of cash received and paid, respectively, under legally enforceable master netting agreements. Loans, lending-related commitments
and interests in purchased receivables increased by $60 billion, $98 billion and $27 billion, respectively, primarily as a result of the Merger.
Below are summaries of the maturity and ratings profiles of the wholesale portfolio as of December 31, 2004 and 2003. The ratings scale is based on the Firm’s internal risk ratings and is presented on an S&P-equivalent basis.
| Wholesale exposure | Maturity profile(a) | Ratings profile | ||||||||||||||||||||||||||||||||||||||||||
| Investment-grade ("IG") | Noninvestment-grade | |||||||||||||||||||||||||||||||||||||||||||
| At December 31, 2004 | AAA | A+ | BBB+ | BB+ | CCC+ | Total % | ||||||||||||||||||||||||||||||||||||||
| (in billions, except ratios) | <1 year | 1-5 years | > 5 years | Total | to AA- | to A- | to BBB | to B- | & below | Total | of IG | |||||||||||||||||||||||||||||||||
Loans |
43 | % | 43 | % | 14 | % | 100 | % | $ | 31 | $ | 20 | $ | 36 | $ | 43 | $ | 5 | $ | 135 | 64 | % | ||||||||||||||||||||||
Derivative receivables(b) |
19 | 39 | 42 | 100 | 34 | 12 | 11 | 9 | — | 66 | 86 | |||||||||||||||||||||||||||||||||
Interests in purchased
receivables |
37 | 61 | 2 | 100 | 3 | 24 | 5 | — | — | 32 | 100 | |||||||||||||||||||||||||||||||||
Lending-related
commitments(b)(c) |
46 | 52 | 2 | 100 | 124 | 68 | 74 | 40 | 3 | 309 | 86 | |||||||||||||||||||||||||||||||||
Total exposure(d) |
42 | % | 49 | % | 9 | % | 100 | % | $ | 192 | $ | 124 | $ | 126 | $ | 92 | 8 | $ | 542 | 82 | % | |||||||||||||||||||||||
Credit derivative hedges
notional(e) |
18 | % | 77 | % | 5 | % | 100 | % | $ | (11 | ) | $ | (11 | ) | $ | (13 | ) | $ | (2 | ) | $ | — | $ | (37 | ) | 95 | % | |||||||||||||||||
| Maturity profile(a) | Ratings profile | |||||||||||||||||||||||||||||||||||||||||||
| Investment-grade ("IG") | Noninvestment-grade | |||||||||||||||||||||||||||||||||||||||||||
| At December 31, 2003(f) | AAA | A+ | BBB+ | BB+ | CCC+ | Total % | ||||||||||||||||||||||||||||||||||||||
| (in billions, except ratios) | <1 year | 1-5 years | > 5 years | Total | to AA- | to A- | to BBB | to B- | & below | Total | of IG | |||||||||||||||||||||||||||||||||
Loans |
50 | % | 35 | % | 15 | % | 100 | % | $ | 14 | $ | 13 | $ | 20 | $ | 22 | $ | 6 | $ | 75 | 63 | % | ||||||||||||||||||||||
Derivative receivables(b) |
20 | 41 | 39 | 100 | 47 | 15 | 12 | 9 | 1 | 84 | 88 | |||||||||||||||||||||||||||||||||
Interests in purchased
receivables |
27 | 71 | 2 | 100 | 5 | — | — | — | — | 5 | 100 | |||||||||||||||||||||||||||||||||
Lending-related
commitments(b)(c) |
52 | 45 | 3 | 100 | 79 | 57 | 48 | 26 | 2 | 212 | 87 | |||||||||||||||||||||||||||||||||
Total exposure(d) |
44 | % | 43 | % | 13 | % | 100 | % | $ | 145 | $ | 85 | $ | 80 | $ | 57 | $ | 9 | $ | 376 | 83 | % | ||||||||||||||||||||||
Credit derivative hedges notional(e) |
16 | % | 74 | % | 10 | % | 100 | % | $ | (10 | ) | $ | (12 | ) | $ | (12 | ) | $ | (12 | ) | $ | (1 | ) | $ | (37 | ) | 92 | % | ||||||||||||||||
| (a) | The maturity profile of loans and lending-related commitments is based upon the remaining
contractual maturity. The maturity profile of derivative receivables is based upon the
maturity profile of
Average exposure. See page 63 of this Annual Report for a further discussion of Average exposure. |
|
| (b) | Based on economic credit exposure, the total percentage of Investment grade for derivative
receivables was 92% and 91% as of December 31, 2004 and 2003, respectively, and for
lending-related
commitments was 85% and 88% as of December 31, 2004 and 2003,
respectively. See footnotes (g) and (h) on page 59 of this Annual Report for a further discussion of economic credit exposure. |
|
| (c) | Based on economic credit exposure, the maturity profile for the <1 year, 1-5 years and
>5 years categories would have been 31%, 65% and 4%, respectively, as of December 31, 2004,
and 38%,
58% and 4%, respectively, as of December 31, 2003. See footnote (h) on page 59 of this Annual
Report for a further discussion of economic credit exposure. |
|
| (d) | Based on economic credit exposure, the maturity profile for <1 year, 1-5 years and >5
years categories would have been 35%, 54% and 11%, respectively, as of December 31, 2004, and
36%, 46% and 18%, respectively, as of December 31, 2003. See footnotes (g) and (h) on page 59 of this
Annual Report for a further discussion of economic credit exposure. |
|
| (e) | Ratings are based on the underlying referenced assets. |
|
| (f) | Heritage JPMorgan Chase only. |
Wholesale credit exposure — selected industry concentration
trations at December 31, 2004: Banks and finance companies (consists of the industries termed
Commercial banks and Finance companies and lessors at year-end 2003) and Retail and consumer
services (previously separate industries at December 31, 2003). The Merger resulted in increases in
nearly every top 10 industry concentration. Exposures to Banks and finance companies and Asset
managers declined, primarily as a result of the Firm’s election to report fair value of derivative
assets and liabilities net of cash received and paid, respectively, under legally enforceable
master netting agreements, which affected derivative receivables. A significant portion of the
Firm’s derivatives portfolio is transacted with customers in these industries.
| 60 | JPMorgan Chase & Co./2004 Annual Report |
Table of Contents
| Collateral | ||||||||||||||||||||||||||||||||
| Noninvestment-grade(d) | Net | Credit | held against | |||||||||||||||||||||||||||||
| As of December 31, 2004 | Credit | Investment | Criticized | Criticized | charge-offs | derivative | derivative | |||||||||||||||||||||||||
| (in millions, except ratios) | exposure | (c) | grade | Noncriticized | performing | nonperforming | (recoveries) | hedges | (e) | receivables | (c) | |||||||||||||||||||||
Top 10 industries(a) |
||||||||||||||||||||||||||||||||
Banks and finance companies |
$ | 56,184 | 90 | % | $ | 5,419 | $ | 132 | $ | 55 | $ | 6 | $ | (11,695 | ) | $ | (3,464 | ) | ||||||||||||||
Real estate |
28,230 | 64 | 9,264 | 609 | 156 | 9 | (800 | ) | (45 | ) | ||||||||||||||||||||||
Healthcare |
22,003 | 79 | 4,381 | 204 | 45 | 1 | (741 | ) | (13 | ) | ||||||||||||||||||||||
Retail and consumer services |
21,732 | 76 | 4,871 | 285 | 108 | — | (1,767 | ) | (42 | ) | ||||||||||||||||||||||
Consumer products |
21,427 | 68 | 6,382 | 408 | 71 | 85 | (1,189 | ) | (50 | ) | ||||||||||||||||||||||
Utilities |
21,262 | 85 | 2,339 | 504 | 386 | 63 | (2,247 | ) | (27 | ) | ||||||||||||||||||||||
Asset managers |
20,389 | 79 | 4,225 | 111 | 4 | (15 | ) | (80 | ) | (655 | ) | |||||||||||||||||||||
State and municipal governments |
19,794 | 97 | 599 | 13 | 1 | — | (394 | ) | (18 | ) | ||||||||||||||||||||||
Securities firms and exchanges |
18,176 | 87 | 2,278 | 4 | 13 | 1 | (1,398 | ) | (2,068 | ) | ||||||||||||||||||||||
Media |
15,314 | 64 | 4,937 | 198 | 311 | (5 | ) | (1,600 | ) | (45 | ) | |||||||||||||||||||||
All other |
297,659 | 83 | 47,261 | 4,001 | 665 | 41 | (15,289 | ) | (2,874 | ) | ||||||||||||||||||||||
Total |
$ | 542,170 | 82 | % | $ | 91,956 | $ | 6,469 | $ | 1,815 | $ | 186 | $ | (37,200 | ) | $ | (9,301 | ) | ||||||||||||||
| Collateral | ||||||||||||||||||||||||||||||||
| Noninvestment-grade(d) | Net | Credit | held against | |||||||||||||||||||||||||||||
| As of December 31, 2003(b) | Credit | Investment | Criticized | Criticized | charge-offs | derivative | derivative | |||||||||||||||||||||||||
| (in millions, except ratios) | exposure | (c) | grade | Noncriticized | performing | nonperforming | (recoveries) | hedges | (e) | receivables | (c) | |||||||||||||||||||||
Top 10 industries(a) |
||||||||||||||||||||||||||||||||
Banks and finance companies |
$ | 62,652 | 96 | % | $ | 2,633 | $ | 107 | $ | 23 | $ | 15 | $ | (12,538 | ) | $ | (24,822 | ) | ||||||||||||||
Real estate |
14,544 | 70 | 4,058 | 232 | 49 | 29 | (718 | ) | (182 | ) | ||||||||||||||||||||||
Healthcare |
11,332 | 86 | 1,403 | 139 | 44 | 12 | (467 | ) | (35 | ) | ||||||||||||||||||||||
Retail and consumer services |
14,451 | 73 | 3,615 | 224 | 83 | 64 | (1,637 | ) | (17 | ) | ||||||||||||||||||||||
Consumer products |
13,774 | 71 | 3,628 | 313 | 103 | 6 | (1,104 | ) | (122 | ) | ||||||||||||||||||||||
Utilities |
15,296 | 82 | 1,714 | 415 | 583 | 129 | (1,960 | ) | (176 | ) | ||||||||||||||||||||||
Asset managers |
21,794 | 82 | 3,899 | 76 | 13 | 14 | (245 | ) | (1,133 | ) | ||||||||||||||||||||||
State and municipal governments |
14,354 | 100 | 36 | 14 | 1 | — | (405 | ) | (12 | ) | ||||||||||||||||||||||
Securities firms and exchanges |
15,599 | 83 | 2,582 | 9 | 13 | 4 | (1,369 | ) | (4,168 | ) | ||||||||||||||||||||||
Media |
14,075 | 65 | 3,285 | 1,307 | 358 | 151 | (1,678 | ) | (186 | ) | ||||||||||||||||||||||
All other |
177,642 | 80 | 30,002 | 3,652 | 1,095 | 341 | (15,161 | ) | (5,361 | ) | ||||||||||||||||||||||
Total |
$ | 375,513 | 83 | % | $ | 56,855 | $ | 6,488 | $ | 2,365 | $ | 765 | $ | (37,282 | ) | $ | (36,214 | ) | ||||||||||||||
| (a) | Based on December 31, 2004, determination of Top 10 industries. |
|
| (b) | Heritage JPMorgan Chase only. |
|
| (c) | Credit exposure is net of risk participations and excludes the benefit of credit
derivative hedges and collateral held against derivative receivables or loans. For 2004,
collateral held against derivative
receivables excludes $32 billion of cash collateral as a result of the Firm electing to
report the fair value of derivative assets and liabilities net of cash received and paid,
respectively, under legally
enforceable master netting agreements. |
|
| (d) | Excludes purchased nonaccrual loans held for sale of $351 million and $22 million at December
31, 2004 and 2003, respectively. |
|
| (e) | Represents notional amounts only; these credit derivatives do not qualify for hedge accounting
under SFAS 133. |
Selected industry discussion
| • | Banks and finance companies: This industry group, primarily consisting
of exposure to commercial banks, is the largest segment of the Firm’s
wholesale credit portfolio. Credit quality is high, as 90% of the exposure
in this category is rated investment-grade. |
|||
| • | Real estate: Wholesale real estate grew considerably as a result of the
Merger. The resulting exposure is diversified by transaction type, borrower
base, geography and property type. In 2004, the portfolio continued to
benefit from disciplined underwriting, low interest rates, high liquidity
and increased capital demand. |
|||
| • | All other: All other at December 31, 2004, included $298 billion of credit exposure to 21
industry segments. Exposures related to SPEs and high-net-worth individuals totaled 45% of this
category. SPEs provide secured financing (generally backed by receivables, loans or bonds on a
bankruptcy-remote, non-recourse or limited-recourse basis) originated by companies in a diverse
group of industries that are not highly correlated. The remaining All other exposure is well
diversified across other industries, none of which comprises more than 3% of total exposure. |
Wholesale criticized exposure
| JPMorgan Chase & Co./2004 Annual Report | 61 |
Table of Contents
Management’s discussion and analysis
facility upgrades as a result of client recapitalizations; additional security and collateral taken in refinancings; client upgrades from improved financial performance; gross charge-offs; and a lack of migration of new exposures into the portfolio.
Criticized exposure — industry concentrations
| As of December 31, 2004 (in millions) | ||||||||
Utilities |
$ | 890 | 10.7 | % | ||||
Real estate |
765 | 9.2 | ||||||
Media |
509 | 6.1 | ||||||
Chemicals/plastics |
488 | 5.9 | ||||||
Consumer products |
479 | 5.8 | ||||||
Machinery and equipment manufacturing |
459 | 5.6 | ||||||
Airlines |
450 | 5.4 | ||||||
Business services |
444 | 5.4 | ||||||
Metals/mining |
438 | 5.3 | ||||||
Building materials/construction |
430 | 5.2 | ||||||
All other |
2,932 | 35.4 | ||||||
Total |
$ | 8,284 | 100 | % | ||||
Wholesale nonperforming assets (excluding purchased held-for-sale wholesale loans) decreased from December 31, 2003, as a result of gross charge-offs of $543 million taken during 2004. Wholesale net charge-offs improved significantly compared with 2003, as a result of lower gross charge-offs and slightly higher recoveries. The 2004 wholesale net charge-off rate was 0.19%, compared with 0.97% in 2003.
Although future charge-offs in the wholesale portfolio and overall credit quality are subject to uncertainties, which may cause actual results to differ from historic performance, the Firm anticipates that the wholesale provision for credit losses will be higher in 2005 than it was in 2004, as the provision for credit losses moves to more normal levels over time.
Derivative contracts
The following table summarizes the aggregate notional amounts and the reported derivative receivables (i.e., the MTM or fair value of the derivative contracts after taking into account the effects of legally enforceable master netting agreements) at each of the dates indicated:
Notional amounts and derivative receivables marked to market (“MTM”)
| As of December 31, | Notional amounts(a) | Derivative receivables MTM | ||||||||||||||
| (in billions) | 2004 | 2003(b) | 2004 | 2003(b) | ||||||||||||
Interest rate |
$ | 37,022 | $ | 31,252 | $ | 46 | $ | 60 | ||||||||
Foreign exchange |
1,886 | 1,545 | 8 | 10 | ||||||||||||
Equity |
434 | 328 | 6 | 9 | ||||||||||||
Credit derivatives |
1,071 | 578 | 3 | 3 | ||||||||||||
Commodity |
101 | 61 | 3 | 2 | ||||||||||||
Total |
40,514 | 33,764 | 66 | 84 | ||||||||||||
Collateral held against derivative receivables |
NA | NA | (9 | )(c) | (36 | ) | ||||||||||
Exposure net of collateral |
NA | NA | $ | 57 | $ | 48 | ||||||||||
| (a) | The notional amounts represent the gross sum of long and short third-party
notional derivative contracts, excluding written options and foreign exchange spot contracts. |
|
| (b) | Heritage JPMorgan Chase only. |
|
| (c) | The Firm held $41 billion of collateral against derivative receivables as of December 31,
2004, consisting of $32 billion in net cash received under credit support annexes to
legally enforceable master netting agreements, and $9 billion of other highly liquid
collateral. The benefit of the $32 billion is reflected within the $66 billion of
derivative receivables MTM. Excluded from the $41 billion of collateral is $10 billion of
collateral delivered by clients at the initiation of transactions; this collateral secures
exposure that could arise in the existing portfolio of derivatives should the MTM of the
client’s transactions move in the Firm’s favor. Also excluded are credit enhancements in
the form of letter-of-credit and surety receivables. |
| 62 |
JPMorgan Chase & Co./2004 Annual Report |
Table of Contents
The $41 trillion of notional principal of the Firm’s derivative contracts outstanding at December 31, 2004, significantly exceeds the possible credit losses that could arise from such transactions. For most derivative transactions, the notional principal amount does not change hands; it is simply used as a reference to calculate payments. The appropriate measure of current credit risk is, in the Firm’s view, the MTM value of the contract, which represents the cost to replace the contracts at current market rates should the counterparty default. When JPMorgan Chase has more than one transaction outstanding with a counterparty, and a legally enforceable master netting agreement exists with that counterparty, the netted MTM exposure, less collateral held, represents, in the Firm’s view, the appropriate measure of current credit risk. At December 31, 2004, the MTM value of derivative receivables (after taking into account the effects of legally enforceable master netting agreements and the impact of net cash received under credit support annexes to such legally enforceable master netting agreements) was $66 billion. Further, after taking into account $9 billion of other highly liquid collateral held by the Firm, the net current MTM credit exposure was $57 billion.
While useful as a current view of credit exposure, the net MTM value of the derivative receivables does not capture the potential future variability of that credit exposure. To capture the potential future variability of credit exposure, the Firm calculates, on a client-by-client basis, three measures of potential derivatives-related credit loss: Peak, Derivative Risk Equivalent (“DRE”) and Average exposure (“AVG”). These measures all incorporate netting and collateral benefits, where applicable.
Peak exposure to a counterparty is an extreme measure of exposure calculated at a 97.5% confidence level. However, the total potential future credit risk embedded in the Firm’s derivatives portfolio is not the simple sum of all Peak client credit risks. This is because, at the portfolio level, credit risk is reduced by the fact that when offsetting transactions are done with separate counterparties, only one of the two trades can generate a credit loss, even if both counterparties were to default simultaneously. The Firm refers to this effect as market diversification, and the Market-Diversified Peak (“MDP”) measure is a portfolio aggregation of counterparty Peak measures, representing the maximum losses at the 97.5% confidence level that would occur if all counterparties defaulted under any one given market scenario and timeframe.
Derivative Risk Equivalent exposure is a measure that expresses the riskiness of derivative exposure on a basis intended to be equivalent to the riskiness of loan exposures. This is done by equating the unexpected loss in a derivative counterparty exposure (which takes into consideration both the loss volatility and the credit rating of the counterparty) with the unexpected loss in a loan exposure (which takes into consideration only the credit rating of the counterparty). DRE is a less extreme measure of potential credit loss than Peak and is the primary measure used by the Firm for credit approval of derivative transactions.
Finally, Average exposure is a measure of the expected MTM value of the Firm’s derivative receivables at future time periods, including the benefit of collateral. AVG exposure over the total life of the derivative contract is used as the primary metric for pricing purposes and is used to calculate credit capital and the Credit Valuation Adjustment (“CVA”), as described further below.
The chart below shows the exposure profiles to derivatives over the next 10 years as calculated by the MDP, DRE and AVG metrics. All three measures generally show declining exposure after the first year, if no new trades were added to the portfolio.
Exposure profile of
derivatives measures
December 31, 2004
(in billions)

| (a) | Excludes $5 billion from the $57 billion of reported derivative receivables MTM net of
collateral. The exclusion reflects risk mitigation for exchange traded deals and equity option
calls. |
The MTM value of the Firm’s derivative receivables incorporates an adjustment, the CVA, to reflect the credit quality of counterparties. The CVA is based on the Firm’s AVG to a counterparty, and on the counterparty’s credit spread in the credit derivatives market. The primary components of changes in CVA are credit spreads, new deal activity or unwinds, and changes in the underlying market environment. The Firm believes that active risk management is essential to controlling the dynamic credit risk in the derivatives portfolio. The Firm risk manages its exposure to changes in CVA by entering into credit derivative transactions, as well as interest rate, foreign exchange, equity and commodity derivatives transactions. The MTM value of the Firm’s derivative payables does not incorporate a valuation adjustment to reflect JPMorgan Chase’s credit quality.
| JPMorgan Chase & Co./2004 Annual Report | 63 |
Table of Contents
Management’s discussion and analysis
The following table summarizes the ratings profile of the Firm’s Consolidated balance sheet Derivative receivables MTM, net of cash and other highly liquid collateral, for the dates indicated:
Ratings profile of derivative receivables MTM
| Rating equivalent | 2004 | 2003(b) | ||||||||||||||
| December 31, | Exposure net | % of exposure | Exposure net | % of exposure | ||||||||||||
| (in millions) | of collateral(a) | net of collateral | of collateral | net of collateral | ||||||||||||
AAA to AA- |
$ | 30,384 | 53 | % | $ | 24,697 | 52 | % | ||||||||
A+ to A- |
9,109 | 16 | 7,677 | 16 | ||||||||||||
BBB+ to BBB- |
9,522 | 17 | 7,564 | 16 | ||||||||||||
BB+ to B- |
7,271 | 13 | 6,777 | 14 | ||||||||||||
CCC+ and below |
395 | 1 | 822 | 2 | ||||||||||||
Total |
$ | 56,681 | 100 | % | $ | 47,537 | 100 | % | ||||||||
| (a) | The Firm held $41 billion of collateral against derivative receivables as of
December 31, 2004, consisting of $32 billion in net cash received under credit support
annexes to legally enforceable master netting agreements, and $9 billion of other highly liquid collateral. The benefit of the
$32 billion is reflected within the $66 billion of derivative receivables MTM. Excluded from
the $41 billion of
collateral is $10 billion of collateral delivered by clients at the initiation of transactions;
this collateral secures exposure that could arise in the existing portfolio of derivatives
should the MTM of the
client’s transactions move in the Firm’s favor. Also excluded are credit enhancements in the
form of letter-of-credit and surety receivables. |
|
| (b) | Heritage JPMorgan Chase only. |
The Firm actively pursues the use of collateral agreements to mitigate counterparty credit risk in derivatives. The percentage of the Firm’s derivatives transactions subject to collateral agreements increased slightly, to 79% as of December 31, 2004, from 78% at December 31, 2003. The Firm held $41 billion of collateral as of December 31, 2004 (including $32 billion of net cash received under credit support annexes to legally enforceable master netting agreements), compared with $36 billion as of December 31, 2003. The Firm posted $31 billion of collateral as of December 31, 2004, compared with $27 billion at the end of 2003.
Certain derivative and collateral agreements include provisions that require the counterparty and/or the Firm, upon specified downgrades in their respective credit ratings, to post collateral for the benefit of the other party. As of December 31, 2004, the impact of a single-notch ratings downgrade to JPMorgan Chase Bank, from its current rating of AA- to A+, would have been an additional $1.5 billion of collateral posted by the Firm; the impact of a six-notch ratings downgrade (from AA- to BBB-) would have been $3.9 billion of additional collateral. Certain derivative contracts also provide for termination of the contract, generally upon a downgrade of either the Firm or the counterparty, at the then-existing MTM value of the derivative contracts.
Use of credit derivatives
Credit derivatives positions
| Notional amount | ||||||||||||||||||||
| Portfolio management | Dealer/client | |||||||||||||||||||
| December 31, | Protection | Protection | Protection | Protection | ||||||||||||||||
| (in millions) | bought(b) | sold | bought | sold | Total | |||||||||||||||
2004 |
$ | 37,237 | $ | 37 | $ | 501,266 | $ | 532,335 | $ | 1,070,875 | ||||||||||
2003(a) |
37,349 | 67 | 264,389 | 275,888 | 577,693 | |||||||||||||||
| (a) | Heritage JPMorgan Chase only. |
|
| (b) | Includes $2 billion at both December 31, 2004 and 2003, of portfolio credit derivatives. |
JPMorgan Chase has limited counterparty exposure as a result of credit derivatives transactions. Of the $66 billion of total Derivative receivables at December 31, 2004, approximately $3 billion, or 5%, was associated with credit derivatives, before the benefit of highly liquid collateral. The use of credit derivatives to manage exposures by the Credit Portfolio Group does not reduce the reported level of assets on the balance sheet or the level of reported off-balance sheet commitments.
Credit portfolio management activity
Use of single-name and portfolio credit derivatives
| December 31, | Notional amount of protection bought | |||||||||||||||||||
| (in millions) | 2004 | 2003(a) | ||||||||||||||||||
Credit derivative hedges of: |
||||||||||||||||||||
Loans and lending-related commitments |
$ | 25,002 | $ | 22,471 | ||||||||||||||||
Derivative receivables |
12,235 | 14,878 | ||||||||||||||||||
Total |
$ | 37,237 | $ | 37,349 | ||||||||||||||||
| (a) | Heritage JPMorgan Chase only. |
The credit derivatives used by JPMorgan Chase for its portfolio management activities do not qualify for hedge accounting under SFAS 133, and therefore, effectiveness testing under SFAS 133 is not performed. These derivatives are reported at fair value, with gains and losses recognized as Trading revenue. The MTM value incorporates both the cost of credit derivative premiums and changes in value due to movement in spreads and credit events, whereas the loans and lending-related commitments being risk managed are accounted for on an accrual basis. Loan interest and fees are generally recognized in Net interest income, and impairment is recognized in the Provision for credit losses. This asymmetry in accounting treatment, between loans and lending-related commitments and the credit derivatives utilized in portfolio management
| 64 | JPMorgan Chase & Co./2004 Annual Report |
Table of Contents
activities, causes earnings volatility that is not representative of the true changes in value of the Firm’s overall credit exposure. The MTM treatment of both the Firm’s credit derivatives used for managing credit exposure (“short” credit positions) and the CVA, which reflects the credit quality of derivatives counterparty exposure (“long” credit positions), provides some natural offset.
In 2004, there were $44 million of losses in Trading revenue from credit portfolio management activities. The losses consisted of $297 million related to credit derivatives used to manage the Firm’s credit exposure; of this amount, $234 million was associated with credit derivatives used to manage accrual lending activities, and $63 million with credit derivatives used to manage the derivatives portfolio. The losses were largely due to the ongoing cost of buying credit protection and some additional impact due to the global tightening of credit spreads. These losses were partially offset by $253 million of gains from a decrease in the MTM value of the CVA, a result of the same factors.
The 2003 credit portfolio management activity resulted in $191 million of losses included in Trading revenue. These losses included $746 million related to credit derivatives that were used to risk manage the Firm’s credit exposure; approximately $504 million of this amount was associated with credit derivatives used to manage accrual lending activities, and the remainder was primarily related to credit derivatives used to manage the credit risk of MTM derivative receivables. The losses were generally driven by an overall global tightening of credit spreads. The $746 million loss was partially offset by $555 million of trading revenue gains, primarily related to the decrease in the MTM value of the CVA due to credit spread tightening.
The Firm also actively manages its wholesale credit exposure through loan and commitment sales. During 2004 and 2003, the Firm sold $5.9 billion and $5.2 billion of loans and commitments, respectively, resulting in losses of $8 million and $54 million, respectively, in connection with the management of its wholesale credit exposure. These activities are not related to the Firm’s securitization activities, which are undertaken for liquidity and balance sheet management purposes. For a further discussion of securitization activity, see Note 13 on pages 103-106 of this Annual Report.
Dealer/client activity
Lending-related commitments
Country exposure
| JPMorgan Chase & Co./2004 Annual Report | 65 |
Table of Contents
Management’s discussion and analysis
Consumer credit portfolio
The following table presents managed consumer credit-related information for the dates indicated:
Consumer portfolio
| As of or for the year ended | Credit-related | Nonperforming | Average annual | |||||||||||||||||||||||||||||
| December 31, | exposure | assets | Net charge-offs | net charge-off rate(e) | ||||||||||||||||||||||||||||
| (in millions, except ratios) | 2004 | 2003 | (d) | 2004 | 2003 | (d) | 2004 | 2003 | (d) | 2004 | 2003 | (d) | ||||||||||||||||||||
Consumer real estate |
||||||||||||||||||||||||||||||||
Home finance
– home equity and other(a) |
$ | 67,837 | $ | 24,179 | $ | 416 | $ | 125 | $ | 554 | $ | 109 | 1.18 | % | 0.56 | % | ||||||||||||||||
Home finance
– mortgage |
56,816 | 50,381 | 257 | 249 | 19 | 26 | 0.05 | 0.08 | ||||||||||||||||||||||||
Total Home finance(a) |
124,653 | 74,560 | 673 | 374 | 573 | 135 | 0.65 | 0.26 | ||||||||||||||||||||||||
Auto & education finance |
62,712 | 43,157 | 193 | 123 | 263 | 171 | 0.52 | 0.43 | ||||||||||||||||||||||||
Consumer & small business and other |
15,107 | 4,204 | 295 | 72 | 154 | 75 | 1.64 | 1.83 | ||||||||||||||||||||||||
Credit card
receivables – reported(b) |
64,575 | 17,426 | 8 | 11 | 1,923 | 1,126 | 4.95 | 6.40 | ||||||||||||||||||||||||
Total
consumer loans – reported |
267,047 | 139,347 | 1,169 | 580 | 2,913 | 1,507 | 1.56 | 1.33 | ||||||||||||||||||||||||
Credit card securitizations (b)(c) |
70,795 | 34,856 | — | — | 2,898 | 1,870 | 5.51 | 5.64 | ||||||||||||||||||||||||
Total
consumer loans – managed(b) |
337,842 | 174,203 | 1,169 | 580 | 5,811 | 3,377 | 2.43 | 2.31 | ||||||||||||||||||||||||
Assets acquired in loan satisfactions |
NA | NA | 224 | 206 | NA | NA | NA | NA | ||||||||||||||||||||||||
Total consumer related
assets – managed |
337,842 | 174,203 | 1,393 | 786 | 5,811 | 3,377 | 2.43 | 2.31 | ||||||||||||||||||||||||
Consumer lending-related commitments: |
||||||||||||||||||||||||||||||||
Home finance |
53,223 | 31,626 | NA | NA | NA | NA | NA | NA | ||||||||||||||||||||||||
Auto & education finance |
5,193 | 2,637 | NA | NA | NA | NA | NA | NA | ||||||||||||||||||||||||
Consumer & small business and other |
10,312 | 5,792 | NA | NA | NA | NA | NA | NA | ||||||||||||||||||||||||
Credit cards |
532,468 | 141,143 | NA | NA | NA | NA | NA | NA | ||||||||||||||||||||||||
Total lending-related commitments |
601,196 | 181,198 | NA | NA | NA | NA | NA | NA | ||||||||||||||||||||||||
Total consumer credit portfolio |
$ | 939,038 | $ | 355,401 | $ | 1,393 | $ | 786 | $ | 5,811 | $ | 3,377 | 2.43 | % | 2.31 | % | ||||||||||||||||
| (a) | Includes $406 million of charge-offs related to the manufactured home loan portfolio in the
fourth quarter of 2004. |
|
| (b) | Past-due loans 90 days and over and accruing includes credit card receivables of $998
million and $273 million, and related credit card securitizations of $1.3 billion and
$879 million at
December 31, 2004 and 2003, respectively. |
|
| (c) | Represents securitized credit cards. For a further discussion of credit card securitizations,
see Card Services on page 39 of this Annual Report. |
|
| (d) | Heritage JPMorgan Chase only. |
|
| (e) | Net charge-off rates exclude average loans HFS in the amount of $14.7 billion and $25.3 billion for 2004 and 2003, respectively. |
| NA-Not applicable. |
| 66 | JPMorgan Chase & Co./2004 Annual Report |
Table of Contents
Total managed consumer loans as of December 31, 2004, were $338 billion, up from $174 billion at year-end 2003, reflecting the addition of the Bank One consumer credit portfolios. Consumer lending–related commitments increased by 232% to $601 billion at December 31, 2004, reflecting the impact of the Merger. The following discussion relates to the specific loan and lending-related categories within the consumer portfolio:
Retail Financial Services
Future RFS charge-offs and credit quality are subject to uncertainties which may cause actual results to differ from current anticipated performance, including the direction and level of loan delinquencies, changes in consumer behavior, bankruptcy trends, portfolio seasoning, interest rate movements and portfolio mix, among other factors.
The Firm proactively manages its retail credit operation. Ongoing efforts include continual review and enhancement of credit underwriting criteria and refinement of pricing and risk management models.
Home Finance: Home finance loans on the balance sheet as of December 31, 2004, were $125 billion. This consisted of $68 billion of home equity and other loans and $57 billion of mortgages, including mortgage loans held-for-sale. Home equity and other loans previously included manufactured home loans, a product the Firm stopped originating at mid-year 2004; the Firm sold substantially all of its manufactured home loan portfolio at the end of 2004. The $125 billion in Home Finance receivables as of December 31, 2004, reflects an increase of $50 billion from year-end 2003, driven by the addition of Bank One’s home equity and mortgage portfolios. Home Finance provides real estate lending to the full spectrum of credit borrowers, which included $7 billion in sub-prime credits at December 31, 2004. The geographic distribution of outstanding consumer real estate loans is well diversified.
Consumer real estate loan portfolio by geographic location
| December 31, | 2004 | 2003(a) | ||||||||||||||
| (in billions) | Outstanding | % | Outstanding | % | ||||||||||||
Top 10 U.S. States |
||||||||||||||||
California |
$ | 22.8 | 18 | % | $ | 17.3 | 23 | % | ||||||||
New York |
18.4 | 15 | 16.3 | 22 | ||||||||||||
Illinois |
8.0 | 6 | 1.9 | 3 | ||||||||||||
Texas |
7.9 | 6 | 4.5 | 6 | ||||||||||||
Florida |
7.1 | 6 | 4.7 | 6 | ||||||||||||
Ohio |
6.1 | 5 | 0.7 | 1 | ||||||||||||
Arizona |
5.2 | 4 | 1.0 | 1 | ||||||||||||
Michigan |
5.2 | 4 | 1.2 | 2 | ||||||||||||
New Jersey |
4.5 | 4 | 3.1 | 4 | ||||||||||||
Colorado |
3.2 | 3 | 1.5 | 2 | ||||||||||||
Total Top 10 |
88.4 | 71 | 52.2 | 70 | ||||||||||||
Other |
36.3 | 29 | 22.4 | 30 | ||||||||||||
Total |
$ | 124.7 | 100 | % | $ | 74.6 | 100 | % | ||||||||
| (a) | Heritage JPMorgan Chase only. |
Auto & Education Finance: As of December 31, 2004, Auto & education finance loans increased to $63 billion, up from $43 billion at year-end 2003. The acquisition of the Bank One portfolio was responsible for the increase. The Auto & education loan portfolio reflects a high concentration of prime quality credits. During the past year, the Firm completed a strategic review of all consumer lending portfolio segments. This review resulted in the Firm choosing to de-emphasize vehicle leasing, which, as of December 31, 2004, comprised $8 billion of outstandings. It is anticipated that over time vehicle leases will account for a smaller share of balance sheet receivables and exposure. The strategic review also resulted in the sale of a $2 billion recreational vehicle portfolio in early 2005.
Consumer & Small Business/Insurance: As of December 31, 2004, Small business & other consumer loans increased to $15 billion compared with 2003 year-end levels of $4 billion. This portfolio segment is primarily comprised of loans to small businesses, and the increase reflects the acquisition of the Bank One small business portfolio. The portfolio reflects highly collateralized loans, often with personal loan guarantees.
Card Services
Consumer credit quality trends continue to improve overall, reflecting general economic conditions and reduced consumer bankruptcy filings versus the prior year. The decrease in the managed credit card net charge-off rate, to 5.27% in 2004 from 5.90% in 2003, reflected the impact of the Merger, as well as management’s continued emphasis on prudent credit risk management, including disciplined underwriting and account management practices targeted to the prime and super-prime credit sectors. Credit Risk Management tools used to manage the level and volatility of losses for credit card accounts have been continually updated, and, where appropriate, these tools were adjusted to reduce credit risk. The managed credit card portfolio continues to reflect a well-seasoned portfolio that has good U.S. geographic diversification.
Future charge-offs in the credit card portfolio and overall credit quality are subject to uncertainties, which may cause actual results to differ from historic performance. This could include the direction and level of loan delinquencies, changes in consumer behavior, bankruptcy trends, portfolio seasoning, interest rate movements and portfolio mix, among other factors. While current economic and credit data suggest that consumer credit quality will not significantly deteriorate, significant deterioration in the general economy could materially change these expectations.
| JPMorgan Chase & Co./2004 Annual Report | 67 |
Table of Contents
Management’s discussion and analysis
Allowance for credit losses
Summary of changes in the allowance for credit losses
| For the year ended | ||||||||||||||||||||||||
| December 31,(a) | 2004 | 2003 | ||||||||||||||||||||||
| (in millions) | Wholesale | Consumer | Total | Wholesale | Consumer | Total | ||||||||||||||||||
Loans: |
||||||||||||||||||||||||
Beginning balance |
$ | 2,204 | $ | 2,319 | $ | 4,523 | $ | 2,936 | $ | 2,414 | $ | 5,350 | ||||||||||||
Addition allowance resulting
from the Merger, July 1, 2004 |
1,788 | 1,335 | 3,123 | — | — | — | ||||||||||||||||||
Gross charge-offs |
(543 | ) | (3,262) | (c) | (3,805 | ) | (1,113 | ) | (1,705 | ) | (2,818 | ) | ||||||||||||
Gross recoveries |
357 | 349 | 706 | 348 | 198 | 546 | ||||||||||||||||||
Net charge-offs |
(186 | ) | (2,913 | ) | (3,099 | ) | (765 | ) | (1,507 | ) | (2,272 | ) | ||||||||||||
Provision for loan losses: |
||||||||||||||||||||||||
Provision excluding accounting policy conformity |
(605 | ) | 2,403 | 1,798 | 25 | 1,554 | 1,579 | |||||||||||||||||
Accounting policy conformity |
(103 | ) | 1,188 | (d) | 1,085 | — | — | — | ||||||||||||||||
Total Provision for loan losses |
(708 | ) | 3,591 | 2,883 | 25 | 1,554 | 1,579 | |||||||||||||||||
Other |
— | (110 | ) | (110) | (f) | 8 | (142 | ) | (134 | )(f) | ||||||||||||||
Ending balance |
$ | 3,098 | (b) | $ | 4,222 | (e) | $ | 7,320 | $ | 2,204 | $ | 2,319 | $ | 4,523 | ||||||||||
Lending-related commitments: |
||||||||||||||||||||||||
Beginning balance |
$ | 320 | $ | 4 | $ | 324 | $ | 363 | $ | — | $ | 363 | ||||||||||||
Addition allowance resulting
from the Merger, July 1, 2004 |
499 | 9 | 508 | — | — | — | ||||||||||||||||||
Net charge-offs |
— | — | — | — | — | — | ||||||||||||||||||
Provision for lending-related commitments: |
||||||||||||||||||||||||
Provision excluding accounting policy conformity |
(111 | ) | (1 | ) | (112 | ) | (40 | ) | 1 | (39 | ) | |||||||||||||
Accounting policy conformity |
(227 | ) | — | (227 | ) | — | — | — | ||||||||||||||||
Total Provision for lending-related commitments |
(338 | ) | (1 | ) | (339 | ) | (40 | ) | 1 | (39 | ) | |||||||||||||
Other |
(1 | ) | — | (1 | ) | (3 | ) | 3 | — | |||||||||||||||
Ending balance |
$ | 480 | $ | 12 | $ | 492 | (g) | $ | 320 | $ | 4 | $ | 324 | |||||||||||
| (a) | 2004 results include six months of the combined Firm’s results and six months of heritage
JPMorgan Chase. 2003 reflects the results of heritage JPMorgan Chase only. |
|
| (b) | Includes $469 million of asset-specific loss and approximately $2.6 billion of formula-based loss.
Included within the formula-based loss is $1.6 billion related to a statistical calculation
and adjustments to the
statistical calculation of $990 million. |
|
| (c) | Includes $406 million of charge-offs related to the sale of the $4 billion manufactured home
loan portfolio in the fourth quarter of 2004. |
|
| (d) | Consists of an increase of approximately $1.4 billion as a result of the decertification of heritage
Bank One seller’s interest in credit card securitizations, partially offset by a reduction
of $254 million to conform
provision methodologies. |
|
| (e) | Includes $3.2 billion and $1.0 billion of consumer statistical and adjustments to statistical
components, respectively, at December 31, 2004. |
|
| (f) | Primarily represents the transfer of the allowance for accrued fees on reported credit card
loans. |
|
| (g) | Includes $130 million of asset-specific loss and $362 million of formula-based loss. Note:
The formula-based loss for lending-related commitments is based on statistical calculation.
There is no
adjustment to the statistical calculation for lending-related commitments. |
Overall: The Allowance for credit losses increased by $3.0 billion from December 31, 2003, to December 31, 2004, primarily driven by the Merger. Adjustments required to conform to the combined Firm’s allowance methodology, and alignment of accounting practices related to the seller’s interest in credit card securitizations, resulted in a net increase in the Provision for credit losses of $858 million. See Note 12 on pages 102-103 of this Annual Report.
Loans: The allowance has two components: asset-specific and formula-based. As of December 31, 2004, management deemed the allowance to be appropriate. Excluding loans held for sale, the allowance represented 1.94% of loans at December 31, 2004, compared with 2.33% at year-end 2003.
The wholesale component of the allowance was $3.1 billion as of December 31, 2004, an increase from year-end 2003, primarily due to the Merger. The wholesale allowance also reflected a reduction of $103 million in the provision as a result of conforming the combined Firm’s allowance methodology.
The consumer component of the allowance was $4.2 billion as of December 31, 2004, an increase from December 31, 2003, primarily attributable to the Merger and the decertification of Bank One’s seller’s retained interest in credit card securitizations. Adjustments required to conform to the combined Firm’s allowance methodology included a reduction of $192 million in the Allowance for loan losses within RFS. Conforming the methodology within Card Services reduced the Allowance for loan losses by $62 million.
| 68 | JPMorgan Chase & Co./2004 Annual Report |
Table of Contents
Additionally, in Card Services, $128 million in allowance for accrued fees and finance charges was reclassified from the Allowance for loan losses to Loans.
At the time of the Merger, Bank One’s seller’s interest in credit card securitizations was in a certificated or security form and recorded at fair value. Subsequently, a decision was made to decertificate these assets, which resulted in a reclassification of the seller’s interest from Available-for-sale securities to Loans, at fair value, with no allowance for credit losses. Generally, as the underlying credit card receivables represented by the seller’s interest were paid off, customers continued to use their credit cards and originate new receivables, which were then recorded as Loans at historical cost. As these new loans aged, it was necessary to establish an Allowance for credit losses consistent with the Firm’s credit policies. During the second half of 2004, approximately $1.4 billion of the Allowance for loan losses was established through the provision associated with newly originated receivables related to the seller’s interest.
Lending-related commitments: To provide for the risk of loss inherent in the Firm’s process of extending credit, management also computes an asset-specific component and a formula-based component for wholesale lending-related commitments. These are computed using a methodology similar to that used for the wholesale loan portfolio, modified for expected maturities and probabilities of drawdown. This allowance, which is reported in Other liabilities, was $492 million at December 31, 2004, and reflected the impact of the Merger, partially offset by a $227 million benefit as a result of conforming the combined Firm’s allowance methodology. The allowance was $324 million at December 31, 2003.
Provision for credit losses
For a discussion of the reported Provision for credit losses, see page 23 of this Annual Report. The managed provision for credit losses, which reflects credit card securitizations, increased primarily due to the Merger.
| For the year ended | Provision for | |||||||||||||||||||||||
| December 31,(a) | Provision for loan losses | lending-related commitments | Total provision for credit losses | |||||||||||||||||||||
| (in millions) | 2004 | 2003 | 2004 | 2003 | 2004 | 2003 | ||||||||||||||||||
Investment Bank |
$ | (525 | ) | $ | (135 | ) | $ | (115 | ) | $ | (46 | ) | $ | (640 | ) | $ | (181 | ) | ||||||
Commercial Banking |
35 | 8 | 6 | (2 | ) | 41 | 6 | |||||||||||||||||
Treasury & Securities Services |
7 | — | — | 1 | 7 | 1 | ||||||||||||||||||
Asset & Wealth Management |
(12 | ) | 36 | (2 | ) | (1 | ) | (14 | ) | 35 | ||||||||||||||
Corporate |
(110 | ) | 116 | — | 8 | (110 | ) | 124 | ||||||||||||||||
Total Wholesale |
(605 | ) | 25 | (111 | ) | (40 | ) | (716 | ) | (15 | ) | |||||||||||||
Retail Financial Services |
450 | 520 | (1 | ) | 1 | 449 | 521 | |||||||||||||||||
Card Services |
1,953 | 1,034 | — | — | 1,953 | 1,034 | ||||||||||||||||||
Total Consumer |
2,403 | 1,554 | (1 | ) | 1 | 2,402 | 1,555 | |||||||||||||||||
Accounting policy conformity(b) |
1,085 | — | (227 | ) | — | 858 | — | |||||||||||||||||
Total
provision for credit losses |
2,883 | 1,579 | (339 | ) | (39 | ) | 2,544 | 1,540 | ||||||||||||||||
Add: Securitized credit losses |
2,898 | 1,870 | — | — | 2,898 | 1,870 | ||||||||||||||||||
Less: Accounting policy conformity |
(1,085 | ) | — | 227 | — | (858 | ) | — | ||||||||||||||||
Total
managed provision for credit losses |
$ | 4,696 | $ | 3,449 | $ | (112 | ) | $ | (39 | ) | $ | 4,584 | $ | 3,410 | ||||||||||
| (a) | 2004 results include six months of the combined Firm’s results and six months of heritage
JPMorgan Chase results. 2003 reflects the results of heritage JPMorgan Chase only. |
|
| (b) | The provision for
loan losses includes an increase of approximately $1.4 billion as a result of the
decertification of heritage Bank One’s seller’s interest in credit card securitizations,
partially offset by a reduction of
$357 million to conform provision methodologies. The provision for lending-related
commitments reflects a reduction of $227 million to conform provision methodologies in the
wholesale portfolio. |
| JPMorgan Chase & Co./2004 Annual Report | 69 |
Table of Contents
Management’s discussion and analysis
Market risk management
Market risk management
The chart below depicts the MRM organizational structure and describes the responsibilities of the groups within MRM.

There are also groups that report to the Chief Financial Officer with some responsibility for market risk-related activities. For example, within the Finance area, the valuation control functions are responsible for ensuring the accuracy of the valuations of positions that expose the Firm to market risk.
Risk identification and classification
MRM works in partnership with the business segments to identify market risks throughout the Firm, and to refine and monitor market risk policies and procedures. All business segments are responsible for comprehensive identification and verification of market risks within their units. Risk-taking businesses have Middle Office functions that act independently from trading personnel and are responsible for verifying risk exposures that the business takes. In addition to providing independent oversight for market risk arising from the business segments, MRM is also responsible for identifying exposures which may not be large within individual business segments, but which may be large for the Firm in aggregate. Weekly meetings are held between MRM and the heads of risk-taking businesses, to discuss and decide on risk exposures in the context of the market environment and client flows.
Positions that expose the Firm to market risk are classified into two categories: trading and nontrading risk. Trading risk includes positions that are held for trading purposes as a principal or as part of a business whose main business strategy is to trade or make markets. Unrealized gains and losses in these positions are generally reported in trading revenue. Nontrading risk includes
securities held for longer term investment, and securities and derivatives used to manage the Firm’s asset/liability exposures. In most cases, unrealized gains and losses in these positions are accounted for at fair value, with the gains and losses reported in Net income or Other comprehensive income.
Trading risk
Foreign exchange, equities, commodities and other: These risks involve the potential decline in Net income to the Firm due to adverse changes in foreign exchange, equities or commodities markets, whether due to proprietary positions taken by the Firm, or due to a decrease in the level of client activity. Other risks include passive long-term investments in numerous hedge funds that may have exposure to fixed income, foreign exchange, equity and commodity risk within their portfolio risk structures.
Nontrading risk
| 70 | JPMorgan Chase & Co./2004 Annual Report |
Table of Contents
This exposure can result from a variety of factors, including differences in the timing among the maturity or re-pricing of assets, liabilities and off-balance sheet instruments. Changes in the level and shape of market interest rate curves may also create interest rate risk, since the re-pricing characteristics of the Firm’s assets do not necessarily match those of its liabilities. The Firm is also exposed to basis risk, which is the difference in re-pricing characteristics of two floating rate indices, such as the prime rate and 3-month LIBOR. In addition, some of the Firm’s products have embedded optionality that impact pricing and balance levels.
The Firm manages interest rate exposure related to its assets and liabilities on a consolidated, corporate-wide basis. Business units transfer their interest rate risk to Treasury through a transfer-pricing system, which takes into account the elements of interest rate exposure that can be risk managed in financial markets. These elements include asset and liability balances and contractual rates of interest, contractual principal payment schedules, expected prepayment experience, interest rate reset dates and maturities, rate indices used for re-pricing, and any interest rate ceilings or floors for adjustable rate products. All transfer-pricing assumptions are reviewed by Treasury.
The Firm’s mortgage banking activities also give rise to complex interest rate risks. The interest rate exposure from the Firm’s mortgage banking activities is a result of option and basis risks. Option risk arises primarily from prepayment options embedded in mortgages and changes in the probability of newly-originated mortgage commitments actually closing. Basis risk results from different relative movements between mortgage rates and other interest rates. These risks are managed through programs specific to the different mortgage banking activities. Potential impairment in the fair value of mortgage servicing rights (“MSRs”) and increased amortization levels of MSRs are managed via a risk management program that attempts to offset changes in the fair value of MSRs with changes in the fair value of derivatives and investment securities. A similar approach is used to manage the interest rate risk associated with the Firm’s mortgage origination business.
Risk measurement
Tools used to measure risk
| • | Statistical risk measures |
| - | Value-at-Risk (“VAR”) |
|
| - | Risk identification for large exposures (“RIFLE”) |
| • | Nonstatistical risk measures |
| - | Economic value stress tests |
|
| - | Earnings-at-risk stress tests |
|
| - | Other measures of position size and sensitivity to market moves |
Value-at-risk
Each business day the Firm undertakes a comprehensive VAR calculation that includes both its trading and its nontrading activities. VAR for nontrading activities measures the amount of potential change in economic value; however, VAR for such activities is not a measure of reported revenue since nontrading activities are generally not marked to market through earnings. JPMorgan Chase’s VAR calculation is highly granular, comprising more than 2.1 million positions and 240,000 pricing series (e.g., securities prices, interest rates, foreign exchange rates). For a substantial portion of its exposure, the Firm has implemented full-revaluation VAR, which, management believes, generates the most accurate results.
To calculate VAR, the Firm uses historical simulation, which measures risk across instruments and portfolios in a consistent, comparable way. This approach assumes that historical changes in market values are representative of future changes. The simulation is based on data for the previous 12 months.
The Firm calculates VAR using a one-day time horizon and a 99% confidence level. This means the Firm would expect to incur losses greater than that predicted by VAR estimates only once in every 100 trading days, or about 2.5 times a year.
All statistical models involve a degree of uncertainty, depending on the assumptions they employ. The Firm prefers historical simulation, because it involves fewer assumptions about the distribution of portfolio losses than parameter-based methodologies. In addition, the Firm regularly assesses the quality of the market data, since their accuracy is critical to computing VAR. Nevertheless, because VAR is based on historical market data, it may not accurately reflect future risk during environments in which market volatility is changing. In addition, the VAR measure on any particular day may not be indicative of future risk levels, since positions and market conditions may both change over time.
While VAR is a valuable tool for evaluating relative risks and aggregating risks across businesses, it only measures the potential volatility of daily revenues. Profitability and risk levels over longer time periods — a fiscal quarter or a year — may be only loosely related to the average value of VAR over those periods for several reasons. First, while VAR measures potential fluctuations around average daily revenue, the average itself could reflect significant gains or losses; for example, from client revenues that accompany risk-taking activities. Second, large trading revenues may result from positions taken over longer periods of time. For example, a business may maintain an exposure to rising or falling interest rates over a period of weeks or months. If the market exhibits a long-term trend over that time, the business could experience large gains or losses, even though revenue volatility on each individual day may have been small.
| JPMorgan Chase & Co./2004 Annual Report | 71 |
Table of Contents
Management’s discussion and analysis
Trading VAR
| 2004 | 2003(e) | |||||||||||||||||||||||||||||||
| As of or for the year ended | Average | Minimum | Maximum | At | Average | Minimum | Maximum | At | ||||||||||||||||||||||||
| December 31, (in millions)(b) | VAR | VAR | VAR | December 31, | VAR | VAR | VAR | December 31, | ||||||||||||||||||||||||
By risk type: |
||||||||||||||||||||||||||||||||
Fixed income |
$ | 74.4 | $ | 45.3 | $ | 117.5 | $ | 57.3 | $ | 61.4 | $ | 42.3 | $ | 104.3 | $ | 79.9 | ||||||||||||||||
Foreign exchange |
17.3 | 10.2 | 32.8 | 28.4 | 16.8 | 11.0 | 30.2 | 23.5 | ||||||||||||||||||||||||
Equities |
28.2 | 15.2 | 57.8 | 19.8 | 18.2 | 6.7 | 51.6 | 45.6 | ||||||||||||||||||||||||
Commodities and other |
8.7 | 6.5 | 17.9 | 8.4 | 7.7 | 4.9 | 12.6 | 8.7 | ||||||||||||||||||||||||
Less: portfolio diversification |
(43.6 | ) | NM | (d) | NM | (d) | (41.8 | ) | (39.4 | ) | NM | (d) | NM | (d) | (61.7 | ) | ||||||||||||||||
Total trading VAR |
$ | 85.0 | $ | 51.6 | $ | 125.2 | $ | 72.1 | $ | 64.7 | $ | 39.8 | $ | 116.3 | $ | 96.0 | ||||||||||||||||
Credit portfolio VAR(c) |
14.0 | 10.8 | 16.6 | 15.0 | 17.8 | 12.8 | 22.0 | 13.2 | ||||||||||||||||||||||||
Less: portfolio diversification |
(8.5 | ) | NM | (d) | NM | (d) | (9.4 | ) | (13.2 | ) | NM | (d) | NM | (d) | (8.1 | ) | ||||||||||||||||
Total trading and credit
portfolio VAR |
$ | 90.5 | $ | 55.3 | $ | 131.6 | $ | 77.7 | $ | 69.3 | $ | 44.8 | $ | 119.8 | $ | 101.1 | ||||||||||||||||
| (a) | Includes all mark-to-market trading activities in the IB, plus available for sale
securities held for the IB’s proprietary purposes. Amounts exclude VAR related to the
Firm’s private equity business.
For a discussion of Private equity risk management, see page 76 of this Annual Report. |
|
| (b) | 2004 results include six months of the combined Firm’s results and six months of heritage
JPMorgan Chase results. 2003 reflects the results of heritage JPMorgan Chase only. |
|
| (c) | Includes VAR on derivative credit valuation adjustments, credit valuation adjustment hedges
and mark-to-market loan hedges which are all reported in Trading revenue. This VAR does not
include the
accrual loan portfolio, which is not marked to market. |
|
| (d) | Designated as NM because the minimum and maximum may occur on different days for different
risk components, and hence it is not meaningful to compute a portfolio diversification
effect. In addition, JPMorgan Chase’s average and period-end VARs are less than the sum of the VARs of its market risk components, due to risk offsets resulting from portfolio diversification. |
|
| (e) | Amounts have been revised to reflect the reclassification of hedge fund investments,
reclassification of Treasury positions to portfolios outside the IB, and the inclusion of
available for sale securities
held for the IB’s proprietary purposes. |
The largest contributors to the IB trading VAR in 2004 was fixed income risk. Before portfolio diversification, fixed income risk accounted for roughly 58% of the average IB Trading Portfolio VAR. The diversification effect, which on average reduced the daily average IB Trading Portfolio VAR by $43.6 million in 2004, reflects the fact that the largest losses for different positions and risks do not typically occur at the same time. The risk of a portfolio of positions is therefore usually less than the sum of the risks of the positions themselves. The degree of diversification is determined both by the extent to which different market variables tend to move together and by the extent to which different businesses have similar positions.
Average IB trading and Credit Portfolio VAR during 2004 rose to $90.5 million, compared with $69.3 million for the same period in 2003. Period-end VAR decreased over the same period, to $77.7 million from $101.1 million. The decrease was driven by a decline in fixed income and equities VAR, primarily due to decreased risk positions and lower market volatility. In general, over the course of a year, VAR exposures can vary significantly as trading positions change and market volatility fluctuates.
VAR backtesting
| 72 | JPMorgan Chase & Co./2004 Annual Report |
Table of Contents
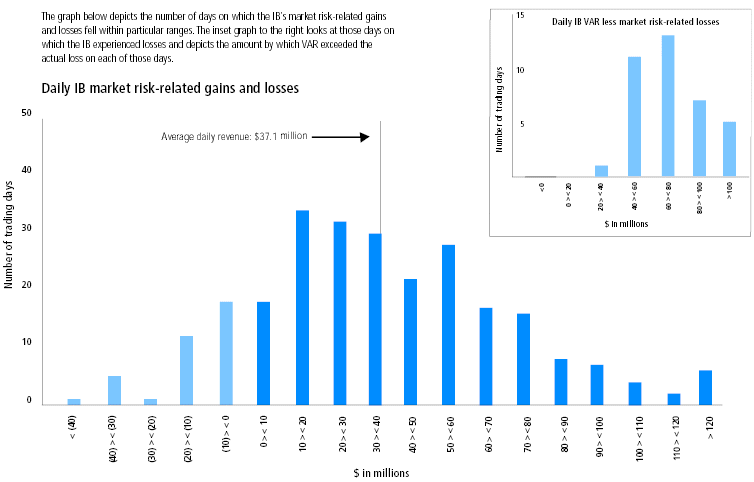
| The graph below depicts the number of days on which the IB’s market risk-related gains and losses fell within particular ranges. The inset graph to the right looks at those days on which the IB experienced losses and depicts the amount by which VAR exceeded the actual loss on each of those days. |
| Daily IB market risk-related gains and losses |
Economic value stress testing
Economic-value stress tests measure the potential change in the value of the Firm’s portfolios. Applying economic-value stress tests helps the Firm understand how the economic value of its balance sheet (i.e., not the amounts reported under U.S. GAAP) would change under certain scenarios. The Firm conducts economic-value stress tests for both its trading and its nontrading activities, using the same scenarios for both.
The Firm stress tests its portfolios at least once a month using multiple scenarios. Several macroeconomic event-related scenarios are evaluated across the Firm, with shocks to roughly 10,000 market prices specified for each scenario. Additional scenarios focus on the risks predominant in individual business segments, and include scenarios that focus on the potential for adverse moves in complex portfolios.
Scenarios are derived from either severe historical crises or forward assessment of developing market trends. They are continually reviewed and updated to reflect changes in the Firm’s risk profile and economic events. Stress-test results, trends and explanations are provided each month to the Firm’s executive management and to the lines of business to help them better measure and manage risks to understand event risk-sensitive positions.
The Firm’s stress-test methodology assumes that, during an actual stress event, no management action would be taken to change the risk profile of portfolios. This captures the decreased liquidity that often occurs with abnormal markets and results, in the Firm’s view, in a conservative stress-test result.
Based on the Firm’s stress scenarios, the stress test loss (pre-tax) in the IB’s trading portfolio ranged from $202 million to $1.2 billion, and $227 million to $895 million for the years ended December 31, 2004 and 2003, respectively. (The 2004 results include six months of the combined Firm’s results and six months of heritage JPMorgan Chase results. In addition, the 2003 amounts have been revised to reflect the transfer of Treasury positions from the IB to the Corporate business segment.)
It is important to note that VAR results cannot be directly correlated to stress-test loss results for three reasons. First, stress-test losses are calculated at varying dates each month, while VAR is performed daily and reported for the period-end date. Second, VAR and stress tests are two distinct risk measurements yielding very different loss potentials. Thus, although the same trading portfolios are used for both tests, VAR is based on a distribution of one-day historical losses measured over the most recent one year; in contrast, stress testing subjects the portfolio to more extreme, larger moves over a longer time horizon (e.g., 2-3 weeks). Third, as VAR and stress tests are distinct risk measurements, the impact of portfolio diversification can vary greatly. For VAR, markets can change in patterns over a one-year time horizon, moving from highly correlated to less so; in stress testing, the focus is on a single event and the associated correlations in an extreme market situation. As a result, while VAR over a given time horizon can be lowered by a diversification benefit in the portfolio, this benefit would not necessarily manifest itself in stress-test scenarios, which assume large, coherent moves across all markets.
| JPMorgan Chase & Co./2004 Annual Report | 73 |
Table of Contents
Management’s discussion and analysis
RIFLE
Nonstatistical risk measures
Earnings-at-risk stress testing
JPMorgan Chase’s 12-month pre-tax earnings sensitivity profiles as of December 31, 2004, were as follows:
| Immediate change in rates | ||||||||||||
| (in millions) | +200bp | +100bp | -100bp | |||||||||
December 31, 2004 |
$ | (557 | ) | $ | (164 | ) | $ | (180 | ) | |||
The Firm is exposed to both rising and falling rates. The Firm’s risk to rising rates is largely the result of increased funding costs. In contrast, the exposure to falling rates is the result of potential compression in deposit spreads, coupled with higher anticipated levels of loan prepayments.
Immediate changes in interest rates present a limited view of risk, and so a number of alternative scenarios are also reviewed. These scenarios include the implied forward curve, nonparallel rate shifts and severe interest rate shocks on selected key rates. These scenarios are intended to provide a comprehensive view of JPMorgan Chase’s earnings-at-risk over a wide range of outcomes.
Earnings-at-risk can also result from changes in the slope of the yield curve, because the Firm has the ability to lend at fixed rates and borrow at variable or short-term fixed rates. Based on these scenarios, the Firm’s earnings would be negatively affected by a sudden and unanticipated increase in short-term rates without a corresponding increase in long-term rates. Conversely, higher long-term rates are generally beneficial to earnings, particularly when the increase is not accompanied by rising short-term rates.
Risk monitoring and control
Limits
The Firm maintains different levels of limits. Corporate-level limits encompass VAR calculations and stress-test loss advisories. Similarly, business segment levels include limits based on VAR calculations and nonstatistical measurements, and P&L loss advisories. Businesses are responsible for adhering to established limits, against which exposures are monitored and reported daily. Exceeded limits are reported immediately to senior management, and the affected business unit must take appropriate action to reduce trading positions. If the business cannot do this within an acceptable timeframe, senior management is consulted on the appropriate action.
MRM regularly reviews and updates risk limits, and the Firm’s Operating Committee reviews and approves risk limits at least twice a year. MRM further controls the Firm’s exposure by specifically designating approved financial instruments for each business unit.
Qualitative review
Model review
Reviews are conducted for new or changed models, as well as previously accepted models, and they assess whether there have been any material changes to the accepted models; whether there have been any changes in the product or market that may impact the model’s validity; and whether there are theoretical or competitive developments that may require reassessment of the model’s adequacy. For a summary of valuations based on models, see Critical accounting estimates used by the Firm on pages 77-79 of this Annual Report.
Risk reporting
| 74 | JPMorgan Chase & Co./2004 Annual Report |
Table of Contents
Operational risk management
Overview
To monitor and control operational risk, the Firm maintains a system of comprehensive policies and a control framework designed to provide a sound and well-controlled operational environment. The goal is to keep operational risk at appropriate levels, in light of the Firm’s financial strength, the characteristics of its businesses, the markets in which it operates, and the competitive and regulatory environment to which it is subject. Notwithstanding these control measures, the Firm incurs operational losses.
The Firm’s approach to operational risk management is intended to mitigate such losses by supplementing the traditional control-based approach to operational risk with risk measures, tools and disciplines that are risk-specific, consistently applied and utilized firmwide. Key themes are transparency of information, escalation of key issues and accountability for issue resolution.
Risk identification and measurement
In 2004, JPMorgan Chase redesigned the underlying architecture of its firmwide self-assessment process, and began implementing the process throughout the heritage Bank One business units. The goal of the self-assessment process is for each business to identify the key operational risks specific to its environment and assess the degree to which it maintains appropriate controls. Action plans are developed for control issues identified, and businesses are held accountable for tracking and resolving these issues on a timely basis.
All businesses were required to perform semiannual self-assessments in 2004, which were completed by the businesses through the use of software applications developed by the Firm. Going forward, the Firm will utilize the self-assessment process as a dynamic risk management tool.
Risk reporting and analysis
During 2004, the Firm implemented Phoenix, a new internally-designed operational risk architecture model. Phoenix integrates the individual components of the operational risk management framework into a unified, web-based tool. When fully implemented, Phoenix will enable the Firm to enhance its reporting and analysis of operational risk data, leading to improved risk management and financial performance. Phoenix will also facilitate the ability of businesses to leverage existing processes to comply with risk management-related regulatory requirements thereby leading to increased efficiencies in the Firm’s management of operational risk.
For purposes of reporting and analysis, the Firm categorizes operational risk events as follows:
| • | Client service and selection |
|
| • | Business practices |
|
| • | Fraud, theft and malice |
|
| • | Execution, delivery and process management |
|
| • | Employee disputes |
|
| • | Disasters and public safety |
|
| • | Technology and infrastructure failures |
Audit alignment
| JPMorgan Chase & Co./2004 Annual Report | 75 |
Table of Contents
JPMorgan Chase & Co.
Reputation and fiduciary risk management
Attention to reputation has always been a key aspect of the Firm’s practices, and maintenance of reputation is the responsibility of everyone at the Firm. JPMorgan Chase bolsters this individual responsibility in many ways: through the Code of Conduct, training, policies and oversight functions that approve transactions. These oversight functions include a Conflicts Office, which examines wholesale transactions with the potential to create conflicts of interest or role for the Firm.
Policy review office
The Firm has an additional structure to address certain transactions with clients, especially
complex derivatives and structured finance transactions, that have the potential to adversely affect its reputation.
This structure reinforces the Firm’s procedures for examining
transactions in terms of appropriateness, ethical issues and reputational risk, and it intensifies
the Firm’s scrutiny of the purpose and effect of its transactions from the client’s point of view,
with the goal that these transactions not be used to mislead investors or others. The structure
operates at three levels: as part of every business’s transaction approval process; through review
by regional Policy Review Committees; and through oversight by the Policy Review Office.
Primary responsibility for adherence to the policies and procedures designed to address reputation risk lies with the business units conducting the transactions in question. The Firm’s transaction approval process requires review and sign-off from, among others, internal legal/compliance, conflicts, tax and accounting groups. Transactions involving an SPE established by the Firm receive particular scrutiny to ensure that every such entity is properly approved, documented, monitored and controlled.
Business units are also required to submit to regional Policy Review Committees proposed transactions that may heighten reputation risk — particularly a
The Policy Review Office is the most senior approval level for client transactions involving reputation risk issues. The mandate of the Office is to opine on specific transactions brought by the Regional Committees and consider changes in policies or practices relating to reputation risk. The head of the office consults with the Firm’s most senior executives on specific topics and provides regular updates. Aside from governance and guidance on specific transactions, the objective of the policy review process is to reinforce a culture, through a “case study” approach, that ensures that all employees, regardless of seniority, understand the basic principles of reputation risk control and can recognize and address issues as they arise.
Fiduciary risk management
The Firm maintains risk management committees within each of its lines of business that include
in their mandate the oversight of legal, reputational and fiduciary-related risks in their
businesses that may produce significant losses or reputational damage. The Fiduciary Risk
Management function works with the line-of-business risk committees to ensure that businesses
providing investment or risk management products or services perform at the appropriate standard
relative to their relationship with a client, whether it be fiduciary or non-fiduciary in nature.
Of particular focus are the policies and practices that address a business’ responsibilities to a
client including client suitability determination, disclosure obligations, disclosure
communications and performance expectations with respect to the investment and risk management
products or services being provided by the Firm. In this way, the line-of-business risk committees,
together with the Fiduciary Risk Management function, provide oversight of the Firm’s efforts to
monitor, measure and control the risks that may arise in the delivery of such products or services
to clients, as well as those stemming from the Firm’s responsibilities undertaken on behalf of
employees.
Private equity risk management
The Firm’s private equity business employs processes for risk measurement and control of private equity risk that are similar to those used for other businesses within the Firm. The processes are coordinated with the Firm’s overall approach to market and concentration risk. Private equity risk is initially monitored through the use of industry and geographic limits. Additionally, to manage the pace of new investments, a ceiling on the amount of annual private equity investment activity has been established. At December 31, 2004, the carrying value of the private equity portfolio was $7.5 billion.
Private Equity’s publicly-held securities create a significant exposure to general declines in the equity markets. Initially to gauge that risk, VAR and stress-test exposures are calculated in the same way as they are for the Firm’s trading
| 76 | JPMorgan Chase & Co./2004 Annual Report |
Table of Contents
Critical accounting estimates used by the Firm
Allowance for credit losses
JPMorgan Chase’s Allowance for credit losses covers the wholesale and consumer loan portfolios as
well as the Firm’s portfolio of wholesale lending-related commitments. The Allowance for loan
losses is intended to adjust the value of the Firm’s loan assets for probable credit losses as of
the balance sheet date. For a further discussion of the methodologies used in establishing the
Firm’s Allowance for credit losses, see Note 12 on pages 102-103 of this Annual Report.
Wholesale loans and lending-related commitments
The methodology for calculating both the Allowance for loan losses and the Allowance for lending-related commitments involves significant judgment.
First and foremost, it involves the early identification of credits that are deteriorating. Second,
it involves management judgment to derive loss factors. Third, it involves management judgment to
evaluate certain macroeconomic factors, underwriting standards, and other relevant internal and
external factors affecting the credit quality of the current portfolio and to refine loss
factors to better reflect these conditions.
The Firm uses a risk rating system to determine the credit quality of its wholesale loans. Wholesale loans are reviewed for information affecting the obligor’s ability to fulfill its obligations. In assessing the risk rating of a particular loan, among the factors considered include the obligor’s debt capacity and financial flexibility, the level of the obligor’s earnings, the amount and sources for repayment, the level and nature of contingencies, management strength, and the industry and geography in which the obligor operates. These factors are based on an evaluation of historical and current information, and involve subjective assessment and interpretation. Emphasizing one factor over another, or considering additional factors that may be relevant in determining the risk rating of a particular loan, but which are not currently an explicit part of the Firm’s methodology, could impact the risk rating assigned by the Firm to that loan.
Management applies its judgment to derive loss factors associated with each credit facility. These loss factors are determined by facility structure, collateral and type of obligor. Wherever possible, the Firm uses independent, verifiable data or the Firm’s own historical loss experience in its models for estimating these loss factors. Many factors can affect management’s estimates of loss, including volatility of loss given default, probability of default and rating migrations. Judgment is applied to determine whether the loss given default should be calculated as an average over the entire credit cycle or at a particular point in the credit cycle. The application of different loss given default fac-
Management also applies its judgment to adjust the loss factors derived taking into consideration model imprecision, external factors and economic events that have occurred but are not yet reflected in the loss factors. The resultant adjustments to the statistical calculation of losses on the performing portfolio are determined by creating estimated ranges using historical experience of both loss given default and probability of default. Factors related to concentrated and deteriorating industries are also incorporated where relevant. The estimated ranges and the determination of the appropriate point within the range are based upon management’s view of uncertainties that relate to current macroeconomic and political conditions, quality of underwriting standards and other relevant internal and external factors affecting the credit quality of the current portfolio. The adjustment to the statistical calculation for the wholesale loan portfolio for the period ended December 31, 2004, was $990 million, the maximum amount within the range, based on management’s assessment of current economic conditions.
Consumer loans
For scored loans (generally consumer lines of business), loss is primarily determined by applying
statistical loss factors and other risk indicators to pools of loans by asset type. These loss
estimates are sensitive to changes in delinquency status, credit bureau scores, the realizable
value of collateral, and other risk factors.
Adjustments to the statistical calculation are accomplished in part by analyzing the historical loss experience for each major product segment. Management analyzes the range of credit loss experienced for each major portfolio segment taking into account economic cycles, portfolio seasoning, and underwriting criteria and then formulates a range that incorporates relevant risk factors that impact overall credit performance. The recorded adjustment to the statistical calculation for the period ended December 31, 2004 was $1.0 billion, based on management’s assessment of current economic conditions.
Fair value of financial instruments
A portion of JPMorgan Chase’s assets and liabilities are carried at fair value, including trading
assets and liabilities, AFS securities and private equity investments. Held-for-sale loans and
mortgage servicing rights (“MSRs”) are carried at the lower of fair value or cost. At December 31,
2004, approximately $417 billion of the Firm’s assets were recorded at fair value.
The fair value of a financial instrument is defined as the amount at which the instrument could be exchanged in a current transaction between willing parties, other than in a forced or liquidation sale. The majority of the Firm’s assets reported at fair value are based on quoted market prices or on internally developed models that utilize independently sourced market parameters, including interest rate yield curves, option volatilities and currency rates.
The degree of management judgment involved in determining the fair value of a financial instrument is dependent upon the availability of quoted market prices or observable market parameters. For financial instruments that are actively traded and have quoted market prices or parameters readily available,
| JPMorgan Chase & Co./2004 Annual Report | 77 |
Table of Contents
JPMorgan Chase & Co.
there is little to no subjectivity in determining fair value. When observable market prices and parameters do not exist, management judgment is necessary to estimate fair value. The valuation process takes into consideration factors such as liquidity and concentration concerns and, for the derivatives portfolio, counterparty credit risk (see the discussion of CVA on page 63 of this Annual Report). For example, there is often limited market data to rely on when estimating the fair value of a large or aged position. Similarly, judgment must be applied in estimating prices for less readily observable external parameters. Finally, other factors such as model assumptions, market dislocations and unexpected correlations can affect estimates of fair value. Imprecision in estimating these factors can impact the amount of revenue or loss recorded for a particular position.
Trading and available-for-sale portfolios
Substantially all of the Firm’s securities held for trading and investment purposes (“long”
positions) and securities that the Firm has sold to other parties but does not own (“short”
positions) are valued based on quoted market prices. However, certain securities are less actively
traded and, therefore, are not always able to be valued based on quoted market prices. The
determination of their fair value requires management judgment, as this determination may require
benchmarking to similar instruments or analyzing default and recovery rates. Examples include
certain collateralized mortgage and debt obligations and high-yield debt securities.
As few derivative contracts are listed on an exchange, the majority of the Firm’s derivative positions are valued using internally developed models that use as their basis readily observable market parameters — that is, parameters that are actively quoted and can be validated to external sources, including industry-pricing services. Certain derivatives, however, are valued based on models with significant unobservable market parameters — that is, parameters that may be estimated and are, therefore, subject to management judgment to substantiate the model valuation. These instruments are normally either less actively traded or trade activity is one-way. Examples include long-dated interest rate or currency swaps, where swap rates may be unobservable for longer maturities, and certain credit products, where correlation and recovery rates are unobservable. Due to the lack of observable market data, the Firm defers the initial trading profit for these financial instruments. The deferred profit is recognized in Trading revenue on a systematic basis and when observable market data becomes available. Management judgment includes recording fair value adjustments (i.e., reductions) to model valuations to account for parameter uncertainty when valuing complex or less actively traded derivative transactions. The following table summarizes the Firm’s trading and available-for-sale portfolios by valuation methodology at December 31, 2004:
| Trading assets | Trading liabilities | |||||||||||||||||||
| Securities | Securities | AFS | ||||||||||||||||||
| purchased(a) | Derivatives(b) | sold(a) | Derivatives(b) | securities | ||||||||||||||||
Fair value based on: |
||||||||||||||||||||
Quoted market prices |
92 | % | 1 | % | 99 | % | 1 | % | 94 | % | ||||||||||
Internal models with significant
observable market parameters |
5 | 97 | 1 | 97 | 2 | |||||||||||||||
Internal models with significant
unobservable market parameters |
3 | 2 | — | 2 | 4 | |||||||||||||||
Total |
100 | % | 100 | % | 100 | % | 100 | % | 100 | % | ||||||||||
| (a) | Reflected as debt and equity instruments on the Firm’s Consolidated balance sheets. |
|
| (b) | Based on gross mark-to-market valuations of the Firm’s derivatives portfolio prior to netting
positions pursuant to FIN 39, as cross-product netting is not relevant to an analysis based upon
valuation methodologies. |
To ensure that the valuations are appropriate, the Firm has various controls in place. These include: an independent review and approval of valuation models; detailed review and explanation for profit and loss analyzed daily and over time; decomposing the model valuations for certain structured derivative instruments into their components and benchmarking valuations, where possible, to similar products; and validating valuation estimates through actual cash settlement. As markets and products develop and the pricing for certain derivative products becomes more transparent, the Firm refines its valuation methodologies. The Valuation Control Group within the Finance area, a group independent of the risk-taking function, is responsible for reviewing the accuracy of the valuations of positions taken within the Investment Bank.
For a discussion of market risk management, including the model review process, see Market risk management on pages 70-74 of this Annual Report. For further details regarding the Firm’s valuation methodologies, see Note 29 on pages 121-124 of this Annual Report.
Loans held-for-sale
The fair value of loans in the held-for-sale portfolio is generally based on observable market
prices of similar instruments, including bonds, credit derivatives and loans with similar
characteristics. If market prices are not available, fair value is based on the estimated cash
flows, adjusted for credit risk that is discounted using a rate appropriate for each maturity that
incorporates the effects of interest rate changes.
Private equity investments
Valuation of private investments held primarily by the Private Equity business within Corporate
requires significant management judgment due to the absence of quoted market prices, inherent lack
of liquidity and the long-term nature of such assets. Private investments are initially valued
based on cost. The carrying values of private investments are adjusted from cost to reflect both
positive and negative changes evidenced by financing events with third-party capital providers. In
addition, these investments are subject to ongoing
| 78 | JPMorgan Chase & Co./2004 Annual Report |
Table of Contents
impairment reviews by Private Equity’s senior investment professionals. A variety of factors are reviewed and monitored to assess impairment including, but not limited to, operating performance and future expectations, industry valuations of comparable public companies, changes in market outlook and the third-party financing environment over time. The Valuation Control Group within the Finance area is responsible for reviewing the accuracy of the carrying values of private investments held by Private Equity. For additional information about private equity investments, see the Private equity risk management discussion on page 76 and Note 9 on pages 98-100 of this Annual Report.
MSRs and certain other retained interests in securitizations
MSRs and certain other retained interests from securitization activities do not trade in an active, open market with readily
observable prices. For example, sales of MSRs do occur, but the precise terms and conditions are
typically not readily available. Accordingly, the Firm estimates the fair value of MSRs and certain
other retained interests in securitizations using a discounted future cash flow model. For MSRs,
the model considers portfolio characteristics, contractually specified servicing fees and
prepayment assumptions, delinquency rates, late charges, other ancillary revenues, costs to service
and other economic factors. For other retained interests in securitizations (such as interest-only
strips), the model is generally based on projections of finance charges related to the securitized
assets, net credit losses, average life, and contractual interest paid to the third-party
investors. Changes in the assumptions used may have a significant impact on the Firm’s valuation of
retained interests. Management believes that the fair values and related assumptions utilized in
the models are comparable to those used by other market participants. For a further discussion of
the most significant assumptions used to value retained interests in securitizations and MSRs, as
well as the applicable stress tests for those assumptions, see Notes 13 and 15 on pages 103-106 and
109-111, respectively, of this Annual Report.
Goodwill impairment
Under SFAS 142, goodwill must be allocated to reporting units and tested for impairment. The
Firm tests goodwill for impairment at least annually or more frequently if events or circumstances,
such as adverse changes in the business climate, indicate that there may be justification for
conducting an interim test. Impairment testing is performed at the reporting-unit level (which is
generally one level below the six major business segments identified in Note 31 on pages 126-127 of
this Annual Report, plus Private Equity which is included in Corporate). The first part of the test
is a comparison, at the reporting unit level, of the fair value of each reporting unit to its
carrying amount, including goodwill. If the fair value is less than the carrying value, then the
second part of the test is needed to measure the amount of potential goodwill impairment. The
implied fair value of the reporting unit goodwill is calculated and compared to the carrying amount
of goodwill recorded in the Firm’s financial records. If the carrying value of reporting unit
goodwill exceeds the implied fair value of that goodwill, then the Firm would recognize an
impairment loss in the amount of the difference, which would be recorded as a charge against Net
income.
The fair values of the reporting units are determined using discounted cash flow models based on each reporting unit’s internal forecasts. In addition, analysis using market-based trading and transaction multiples, where available, are used to assess the reasonableness of the valuations derived from the discounted cash flow models.
Goodwill was not impaired as of December 31, 2004 or December 31, 2003, nor was any goodwill written off during the years ended December 31, 2004, 2003 and 2002. See Note 15 on page 109 of this Annual Report for additional information related to the nature and accounting for goodwill and the carrying values of goodwill by major business segment.
| JPMorgan Chase & Co./2004 Annual Report | 79 |
Table of Contents
JPMorgan Chase & Co.
Nonexchange-traded commodity contracts at fair value
| For the year ended | ||||||||
| December 31, 2004 (in millions) | Asset position | Liability position | ||||||
Net fair value of contracts
outstanding at January 1, 2004 |
$ | 1,497 | $ | 751 | ||||
Effect of legally enforceable master
netting agreements |
834 | 919 | ||||||
Gross fair value of contracts
outstanding at January 1, 2004 |
2,331 | 1,670 | ||||||
Contracts realized or otherwise settled
during the period |
(5,486 | ) | (4,139 | ) | ||||
Fair value of new contracts |
1,856 | 1,569 | ||||||
Changes in fair values attributable to
changes in valuation techniques
and assumptions |
— | — | ||||||
Other changes in fair value |
5,052 | 4,132 | ||||||
Gross fair value of contracts
outstanding at December 31, 2004 |
3,753 | 3,232 | ||||||
Effect of legally enforceable master
netting agreements |
(2,304 | ) | (2,233 | ) | ||||
Net fair value of contracts
outstanding at December 31, 2004 |
$ | 1,449 | $ | 999 | ||||
| At December 31, 2004 (in millions) | Asset position | Liability position | ||||||
Maturity less than 1 year |
$ | 1,999 | $ | 1,874 | ||||
Maturity 1-3 years |
1,266 | 1,056 | ||||||
Maturity 4-5 years |
454 | 293 | ||||||
Maturity in excess of 5 years |
34 | 9 | ||||||
Gross fair value of contracts
outstanding at December 31, 2004 |
3,753 | 3,232 | ||||||
Effects of legally enforceable master
netting agreements |
(2,304 | ) | (2,233 | ) | ||||
Net fair value of contracts
outstanding at December 31, 2004 |
$ | 1,449 | $ | 999 | ||||
Accounting and reporting developments
Accounting for income taxes — repatriation of foreign earnings under the American Jobs Creation Act of 2004
In December 2004, the FASB issued FSP SFAS 109-2, which provides accounting and disclosure guidance
for the foreign earnings repatriation provision within the American Jobs Creation Act of 2004 (the
“Act”). The Act was signed into law on October 22, 2004.
The Act creates a temporary incentive for U.S. companies to repatriate accumulated foreign earnings at a substantially reduced U.S. effective tax rate by providing a dividends received deduction on the repatriation of certain foreign earnings to the U.S. taxpayer (the “repatriation provision”). The new deduction is subject to a number of limitations and requirements.
Clarification to key elements of the repatriation provision from Congress or the U.S. Treasury Department may affect an enterprise’s evaluation of the effect of the Act on its plan for repatriation or reinvestment of foreign earnings. The FSP provides a practical exception to the SFAS 109 requirement to reflect the effect of a new tax law in the period of enactment, because of the lack of clarification to certain provisions within the Act and the timing of the enactment. Thus, companies have additional time to assess the effect of the Act on its plan for reinvestment or repatriation of foreign earnings for purposes of applying SFAS 109. A company
The range of possible amounts that may be considered for repatriation under this provision is between zero and $1.9 billion. The Firm is currently assessing the impact of the repatriation provision and, at this time, cannot reasonably estimate the related range of income tax effects of such repatriation provision. Accordingly, the Firm has not reflected the tax effect of the repatriation provision in income tax expense or income tax liabilities.
Accounting for share-based payments
In December 2004, the FASB issued SFAS 123R, which revises SFAS 123 and supersedes APB 25.
Accounting and reporting under SFAS 123R is generally similar to the SFAS 123 approach. However,
SFAS 123R requires all share-based payments to employees, including grants of employee stock
options, to be recognized in the income statement based on their fair values. Pro forma disclosure
is no longer an alternative.
| 80 | JPMorgan Chase & Co./2004 Annual Report |
Table of Contents
The Firm has continued to account for stock options that were outstanding as of December 31, 2002 under APB 25 using the intrinsic value method. Therefore, compensation expense for some previously granted awards that was not recognized under SFAS 123 will be recognized under SFAS 123R. Had the Firm adopted SFAS 123R in prior periods, the impact would have approximated the impact of SFAS 123 as described in the disclosure of pro forma net income and earnings per share as presented in Note 7 on page 97 of this Annual Report. SFAS 123R must be adopted no later than July 1, 2005. SFAS 123R permits adoption using one of two methods — modified prospective or modified retrospective. The Firm is currently evaluating both the timing and method of adopting the new standard.
Impairment of available-for-sale and held-to-maturity securities
In September 2004, the FASB issued FSP EITF 03-1-1, indefinitely delaying the measurement
provisions of EITF 03-1. The disclosure requirements of EITF 03-1 remain effective and are included
in Note 9 on pages 98-100 of this Annual Report. EITF 03-1 addresses issues related to
other-than-temporary impairment for securities classified as either available-for-sale or
held-to-maturity under SFAS 115 (including individual securities and investments in mutual funds)
and for investments accounted for under the cost method. A proposed FSP addressing these issues was
issued by the FASB and is expected to be finalized in 2005. The impact of EITF 03-1, if any, to the
Firm’s investment portfolios will not be known until the final consensus is issued.
Accounting for interest rate lock commitments (“IRLCs”)
IRLCs associated with mortgages to be held for sale represent commitments to extend credit at
specified interest rates. On March 9, 2004, the Securities and Exchange Commission issued SAB No.
105, which summarizes the views of the Securities and Exchange Commission staff regarding the
application of U.S. GAAP to loan commitments accounted for as derivative instruments. SAB 105
states that the value of the servicing asset should not be included in the estimate of fair value
of IRLCs. SAB 105 is applicable for all IRLCs accounted for as derivatives and entered into on or
after April 1, 2004.
Prior to April 1, 2004, JPMorgan Chase recorded IRLCs at estimated fair value. The fair value of IRLCs included an estimate of the value of the loan servicing right inherent in the underlying loan, net of the estimated costs to close the loan. Effective April 1, 2004, and as a result of SAB 105, the Firm no longer assigns fair value to IRLCs on the date they are entered into, with any initial gain being recognized upon the sale of the resultant loan. Also in connection with SAB 105, the Firm records any changes in the value of the IRLCs, excluding the servicing asset component, due to changes in interest rates after they are locked. Adopting SAB 105 did not have a material impact on the Firm’s 2004 Consolidated financial statements.
Accounting for certain loans or debt securities acquired in a transfer
In December 2003, the AICPA issued SOP 03-3, which requires that loans purchased at a discount
due to poor credit quality be recorded at fair value and prohibits the recognition of a loss
accrual or valuation allowance at the time of purchase. SOP 03-3 also limits the yield that may be
accreted to the excess of the undiscounted expected cash flows over the initial investment in the
loan. Subsequent increases in expected cash flows are recognized prospectively through an
adjustment of yield over its remaining life and decreases in expected cash flows are recognized as
an impairment. For JPMorgan Chase entities, SOP 03-3 became effective for loans or debt securities
acquired after December 31, 2004.
Accounting for postretirement health care plans that provide prescription drug benefits
In December 2003, the Medicare Prescription Drug, Improvement and Modernization Act of 2003
(the “Act”) was enacted. In May 2004, the FASB issued FSP SFAS 106-2, which provides guidance on
accounting for the Act. For additional information, see Note 6 on page 92-95 of this Annual Report.
In early 2005, the federal government issued additional guidance about how to apply certain
provisions of the Act, which may lead to future accounting adjustments. Such adjustments, however,
are not expected to be material.
Accounting for variable interest entities
In December 2003, the FASB issued a revision to FIN 46 to address various technical corrections
and implementation issues that had arisen since the issuance of FIN 46. Effective March 31, 2004,
JPMorgan Chase implemented FIN 46R for all VIEs, excluding certain investments made by its private
equity business. Implementation of FIN 46R did not have a material effect on the Firm’s
Consolidated financial statements.
The application of FIN 46R involved significant judgement and interpretations by management. The Firm is aware of differing interpretations being developed among accounting professionals and the EITF with regard to analyzing derivatives under FIN 46R. Management’s current interpretation is that derivatives should be evaluated by focusing on an economic analysis of the rights and obligations of a VIE’s assets, liabilities, equity, and other contracts, while considering: the entity’s activities and design; the terms of the derivative contract and the role it has with entity; and whether the derivative contract creates and/or absorbs variability of the VIE. The Firm will continue to monitor developing interpretations.
| JPMorgan Chase & Co./2004 Annual Report | 81 |
Table of Contents
JPMorgan Chase & Co.
Management of JPMorgan Chase & Co. is responsible for establishing and maintaining adequate internal control over financial reporting. As defined in Rules 13a-15(f) or 15d-15(f) under the Securities Exchange Act of 1934, internal control over financial reporting is a process designed by, or under the supervision of, the Firm’s principal executive, principal operating and principal financial officers, or persons performing similar functions, and effected by JPMorgan Chase’s board of directors, management and other personnel, to provide reasonable assurance regarding the reliability of financial reporting and the preparation of financial statements for external purposes in accordance with accounting principles generally accepted in the United States of America.
JPMorgan Chase’s internal control over financial reporting includes those policies and procedures that (1) pertain to the maintenance of records, that, in reasonable detail, accurately and fairly reflect the transactions and dispositions of the Firm’s assets; (2) provide reasonable assurance that transactions are recorded as necessary to permit preparation of financial statements in accordance with generally accepted accounting principles, and that receipts and expenditures of the Firm are being made only in accordance with authorizations of JPMorgan Chase’s management and directors; and (3) provide reasonable assurance regarding prevention or timely detection of unauthorized acquisition, use or disposition of the Firm’s assets that could have a material effect on the financial statements.
Because of its inherent limitations, internal control over financial reporting may not prevent or detect misstatements. Also, projections of any evaluation of effectiveness to future periods are subject to the risk that controls may become inadequate because of changes in conditions, or that the degree of compliance with the policies or procedures may deteriorate.
Management has completed an assessment of the effectiveness of the Firm’s internal control over financial reporting as of December 31, 2004. In making the assessment, management used the framework in “Internal Control — Integrated Framework” promulgated by the Committee of Sponsoring Organizations of the Treadway Commission, commonly referred to as the “COSO” criteria.
Based on the assessment performed, management concluded that as of December 31, 2004, JPMorgan Chase’s internal control over financial reporting was effective based upon the COSO criteria. Additionally, based on management’s assessment, the Firm determined that there were no material weaknesses in its internal control over financial reporting as of December 31, 2004.
Management’s assessment of the effectiveness of the Firm’s internal control over financial reporting as of December 31, 2004 has been audited by PricewaterhouseCoopers LLP, JPMorgan Chase’s independent registered public accounting firm, who also audited the Firm’s financial statements as of and for the year ended December 31, 2004, as stated in their report which is included herein.

Chairman and Chief Executive Officer

President and Chief Operating Officer

Executive Vice President and Chief Financial Officer
| 82 | JPMorgan Chase & Co./2004 Annual Report |
Table of Contents
JPMorgan Chase & Co.

To the Board of Directors and Stockholders of JPMorgan Chase & Co.:
We have completed an integrated audit of JPMorgan Chase & Co.’s 2004 consolidated financial statements and of its internal control over financial reporting as of December 31, 2004 and audits of its 2003 and 2002 consolidated financial statements in accordance with the standards of the Public Company Accounting Oversight Board (United States). Our opinions, based on our audits, are presented below.
Consolidated financial statements
In our opinion, the accompanying consolidated balance sheets and the related consolidated
statements of income, changes in stockholders’ equity and cash flows present fairly, in all
material respects, the financial position of JPMorgan Chase & Co. and its subsidiaries (the
“Company”) at December 31, 2004 and 2003, and the results of their operations and their cash flows
for each of the three years in the period ended December 31, 2004 in conformity with accounting
principles generally accepted in the United States of America. These financial statements are the
responsibility of the Company’s management. Our responsibility is to express an opinion on these
financial statements based on our audits. We conducted our audits of these statements in accordance
with the standards of the Public Company Accounting Oversight Board (United States). Those
standards require that we plan and perform the audit to obtain reasonable assurance about whether
the financial statements are free of material misstatement. An audit of financial statements
includes examining, on a test basis, evidence supporting the amounts and disclosures in the
financial statements, assessing the accounting principles used and significant estimates made by
management, and evaluating the overall financial statement presentation. We believe that our audits
provide a reasonable basis for our opinion.
Internal control over financial reporting
Also, in our opinion, management’s assessment, included in the accompanying Management’s report on
internal control over financial reporting, that the Company maintained effective internal control
over financial reporting as of December 31, 2004 based on criteria established in Internal Control
— Integrated Framework issued by the Committee of Sponsoring Organizations of the Treadway
Commission (“COSO”), is fairly stated, in all material respects, based on those criteria.
Furthermore, in our opinion, the Company maintained, in all material respects, effective internal
control over financial reporting as of December 31, 2004, based on criteria established in Internal
Control — Integrated Framework issued by COSO. The Company’s management is responsible for
maintaining effective internal control over financial reporting and for its assessment of the
effectiveness of internal control over financial
reporting. Our responsibility is to express opinions on management’s assessment and on the effectiveness of the Company’s internal control over financial reporting based on our audit. We conducted our audit of internal control over financial reporting in accordance with the standards of the Public Company Accounting Oversight Board (United States). Those standards require that we plan and perform the audit to obtain reasonable assurance about whether effective internal control over financial reporting was maintained in all material respects. An audit of internal control over financial reporting includes obtaining an understanding of internal control over financial reporting, evaluating management’s assessment, testing and evaluating the design and operating effectiveness of internal control, and performing such other procedures as we consider necessary in the circumstances. We believe that our audit provides a reasonable basis for our opinions.
A company’s internal control over financial reporting is a process designed to provide reasonable assurance regarding the reliability of financial reporting and the preparation of financial statements for external purposes in accordance with generally accepted accounting principles. A company’s internal control over financial reporting includes those policies and procedures that (i) pertain to the maintenance of records that, in reasonable detail, accurately and fairly reflect the transactions and dispositions of the assets of the company; (ii) provide reasonable assurance that transactions are recorded as necessary to permit preparation of financial statements in accordance with generally accepted accounting principles, and that receipts and expenditures of the company are being made only in accordance with authorizations of management and directors of the company; and (iii) provide reasonable assurance regarding prevention or timely detection of unauthorized acquisition, use, or disposition of the company’s assets that could have a material effect on the financial statements.
Because of its inherent limitations, internal control over financial reporting may not prevent or detect misstatements. Also, projections of any evaluation of effectiveness to future periods are subject to the risk that controls may become inadequate because of changes in conditions, or that the degree of compliance with the policies or procedures may deteriorate.

February 22, 2005
| JPMorgan Chase & Co./2004 Annual Report | 83 |
Table of Contents
Consolidated statements of income
| Year ended December 31, (in millions, except per share data)(a) | 2004 | 2003 | 2002 | |||||||||
Revenue |
||||||||||||
Investment banking fees |
$ | 3,537 | $ | 2,890 | $ | 2,763 | ||||||
Trading revenue |
3,612 | 4,427 | 2,675 | |||||||||
Lending & deposit related fees |
2,672 | 1,727 | 1,674 | |||||||||
Asset management, administration and commissions |
7,967 | 5,906 | 5,754 | |||||||||
Securities/private equity gains |
1,874 | 1,479 | 817 | |||||||||
Mortgage fees and related income |
1,004 | 923 | 988 | |||||||||
Credit card income |
4,840 | 2,466 | 2,307 | |||||||||
Other income |
830 | 601 | 458 | |||||||||
Noninterest revenue |
26,336 | 20,419 | 17,436 | |||||||||
Interest income |
30,595 | 24,044 | 25,936 | |||||||||
Interest expense |
13,834 | 11,079 | 13,758 | |||||||||
Net interest income |
16,761 | 12,965 | 12,178 | |||||||||
Total net revenue |
43,097 | 33,384 | 29,614 | |||||||||
Provision for credit losses |
2,544 | 1,540 | 4,331 | |||||||||
Noninterest expense |
||||||||||||
Compensation expense |
14,506 | 11,387 | 10,693 | |||||||||
Occupancy expense |
2,084 | 1,912 | 1,606 | |||||||||
Technology and communications expense |
3,702 | 2,844 | 2,554 | |||||||||
Professional & outside services |
3,862 | 2,875 | 2,587 | |||||||||
Marketing |
1,335 | 710 | 689 | |||||||||
Other expense |
2,859 | 1,694 | 1,802 | |||||||||
Amortization of intangibles |
946 | 294 | 323 | |||||||||
Total noninterest expense before merger costs and litigation reserve charge |
29,294 | 21,716 | 20,254 | |||||||||
Merger costs |
1,365 | — | 1,210 | |||||||||
Litigation reserve charge |
3,700 | 100 | 1,300 | |||||||||
Total noninterest expense |
34,359 | 21,816 | 22,764 | |||||||||
Income before income tax expense |
6,194 | 10,028 | 2,519 | |||||||||
Income tax expense |
1,728 | 3,309 | 856 | |||||||||
Net income |
$ | 4,466 | $ | 6,719 | $ | 1,663 | ||||||
Net income applicable to common stock |
$ | 4,414 | $ | 6,668 | $ | 1,612 | ||||||
Net income per common share |
||||||||||||
Basic earnings per share |
$ | 1.59 | $ | 3.32 | $ | 0.81 | ||||||
Diluted earnings per share |
1.55 | 3.24 | 0.80 | |||||||||
Average basic shares |
2,780 | 2,009 | 1,984 | |||||||||
Average diluted shares |
2,851 | 2,055 | 2,009 | |||||||||
Cash dividends per common share |
$ | 1.36 | $ | 1.36 | $ | 1.36 | ||||||
| (a) | 2004 results include six months of the combined Firm’s results and six months of heritage
JPMorgan Chase results. All other periods reflect the results of heritage JPMorgan Chase only. |
The Notes to consolidated financial statements are an integral part of these statements.
| 84 | JPMorgan Chase & Co. / 2004 Annual Report |
Table of Contents
Consolidated balance sheets
| At December 31, (in millions, except share data) | 2004 | 2003 | (a) | |||||
Assets |
||||||||
Cash and due from banks |
$ | 35,168 | $ | 20,268 | ||||
Deposits with banks |
21,680 | 10,175 | ||||||
Federal funds sold and securities purchased under resale agreements |
101,354 | 76,868 | ||||||
Securities borrowed |
47,428 | 41,834 | ||||||
Trading assets (including assets pledged of $77,266 at December 31, 2004, and $81,312 at December 31, 2003) |
288,814 | 252,871 | ||||||
Securities: |
||||||||
Available-for-sale (including assets pledged of $26,881 at December 31, 2004, and $31,639 at December 31, 2003) |
94,402 | 60,068 | ||||||
Held-to-maturity (fair value: $117 at December 31, 2004, and $186 at December 31, 2003) |
110 | 176 | ||||||
Interests in purchased receivables |
31,722 | 4,752 | ||||||
Loans |
402,114 | 214,766 | ||||||
Allowance for loan losses |
(7,320 | ) | (4,523 | ) | ||||
Loans, net of Allowance for loan losses |
394,794 | 210,243 | ||||||
Private equity investments |
7,735 | 7,250 | ||||||
Accrued interest and accounts receivable |
21,409 | 12,356 | ||||||
Premises and equipment |
9,145 | 6,487 | ||||||
Goodwill |
43,203 | 8,511 | ||||||
Other intangible assets: |
||||||||
Mortgage servicing rights |
5,080 | 4,781 | ||||||
Purchased credit card relationships |
3,878 | 1,014 | ||||||
All other intangibles |
5,726 | 685 | ||||||
Other assets |
45,600 | 52,573 | ||||||
Total assets |
$ | 1,157,248 | $ | 770,912 | ||||
Liabilities |
||||||||
Deposits: |
||||||||
U.S. offices: |
||||||||
Noninterest-bearing |
$ | 129,257 | $ | 73,154 | ||||
Interest-bearing |
261,673 | 125,855 | ||||||
Non-U.S. offices: |
||||||||
Noninterest-bearing |
6,931 | 6,311 | ||||||
Interest-bearing |
123,595 | 121,172 | ||||||
Total deposits |
521,456 | 326,492 | ||||||
Federal funds purchased and securities sold under repurchase agreements |
127,787 | 113,466 | ||||||
Commercial paper |
12,605 | 14,284 | ||||||
Other borrowed funds |
9,039 | 8,925 | ||||||
Trading liabilities |
151,207 | 149,448 | ||||||
Accounts payable, accrued expenses and other liabilities (including the Allowance for lending-related
commitments of $492 at December 31, 2004, and $324 at December 31, 2003) |
75,722 | 45,066 | ||||||
Beneficial interests issued by consolidated VIEs |
48,061 | 12,295 | ||||||
Long-term debt |
95,422 | 48,014 | ||||||
Junior subordinated deferrable interest debentures held by trusts that issued guaranteed capital debt securities |
10,296 | 6,768 | ||||||
Total liabilities |
1,051,595 | 724,758 | ||||||
Commitments and contingencies (see Note 25 of this Annual Report) |
||||||||
Stockholders’ equity |
||||||||
Preferred stock |
339 | 1,009 | ||||||
Common stock (authorized 9,000,000,000 shares and 4,500,000,000 shares
at December 31, 2004 and 2003, respectively; issued 3,584,747,502 shares and
2,044,436,509 shares at December 31, 2004 and 2003, respectively) |
3,585 | 2,044 | ||||||
Capital surplus |
72,801 | 13,512 | ||||||
Retained earnings |
30,209 | 29,681 | ||||||
Accumulated other comprehensive income (loss) |
(208 | ) | (30 | ) | ||||
Treasury stock, at cost (28,556,534 shares at December 31, 2004, and 1,816,495 shares at December 31, 2003) |
(1,073 | ) | (62 | ) | ||||
Total stockholders’ equity |
105,653 | 46,154 | ||||||
Total liabilities and stockholders’ equity |
$ | 1,157,248 | $ | 770,912 | ||||
| (a) | Heritage JPMorgan Chase only. |
The Notes to consolidated financial statements are an integral part of these statements.
| JPMorgan Chase & Co. / 2004 Annual Report | 85 |
Table of Contents
Consolidated statements of changes in stockholders’ equity
| Year ended December 31, (in millions, except per share data)(a) | 2004 | 2003 | 2002 | |||||||||
Preferred stock |
||||||||||||
Balance at beginning of year |
$ | 1,009 | $ | 1,009 | $ | 1,009 | ||||||
Redemption of preferred stock |
(670 | ) | — | — | ||||||||
Balance at end of year |
339 | 1,009 | 1,009 | |||||||||
Common stock |
||||||||||||
Balance at beginning of year |
2,044 | 2,024 | 1,997 | |||||||||
Issuance of common stock |
72 | 20 | 27 | |||||||||
Issuance of common stock for purchase accounting acquisitions |
1,469 | — | — | |||||||||
Balance at end of year |
3,585 | 2,044 | 2,024 | |||||||||
Capital surplus |
||||||||||||
Balance at beginning of year |
13,512 | 13,222 | 12,495 | |||||||||
Issuance of common stock and options for purchase accounting acquisitions |
55,867 | — | — | |||||||||
Shares issued and commitments to issue common stock for employee stock-based
awards and related tax effects |
3,422 | 290 | 727 | |||||||||
Balance at end of year |
72,801 | 13,512 | 13,222 | |||||||||
Retained earnings |
||||||||||||
Balance at beginning of year |
29,681 | 25,851 | 26,993 | |||||||||
Net income |
4,466 | 6,719 | 1,663 | |||||||||
Cash dividends declared: |
||||||||||||
Preferred stock |
(52 | ) | (51 | ) | (51 | ) | ||||||
Common stock ($1.36 per share each year) |
(3,886 | ) | (2,838 | ) | (2,754 | ) | ||||||
Balance at end of year |
30,209 | 29,681 | 25,851 | |||||||||
Accumulated other comprehensive income (loss) |
||||||||||||
Balance at beginning of year |
(30 | ) | 1,227 | (442 | ) | |||||||
Other comprehensive income (loss) |
(178 | ) | (1,257 | ) | 1,669 | |||||||
Balance at end of year |
(208 | ) | (30 | ) | 1,227 | |||||||
Treasury stock, at cost |
||||||||||||
Balance at beginning of year |
(62 | ) | (1,027 | ) | (953 | ) | ||||||
Purchase of treasury stock |
(738 | ) | — | — | ||||||||
Reissuance from treasury stock |
— | 1,082 | 107 | |||||||||
Share repurchases related to employee stock-based awards |
(273 | ) | (117 | ) | (181 | ) | ||||||
Balance at end of year |
(1,073 | ) | (62 | ) | (1,027 | ) | ||||||
Total stockholders’ equity |
$ | 105,653 | $ | 46,154 | $ | 42,306 | ||||||
Comprehensive income |
||||||||||||
Net income |
$ | 4,466 | $ | 6,719 | $ | 1,663 | ||||||
Other comprehensive income (loss) |
(178 | ) | (1,257 | ) | 1,669 | |||||||
Comprehensive income |
$ | 4,288 | $ | 5,462 | $ | 3,332 | ||||||
| (a) | 2004 results include six months of the combined Firm’s results and six months of heritage
JPMorgan Chase results. All other periods reflect the results of heritage JPMorgan Chase only. |
The Notes to consolidated financial statements are an integral part of these statements.
| 86 | JPMorgan Chase & Co. / 2004 Annual Report |
Table of Contents
Consolidated statements of cash flows
| Year ended December 31, (in millions)(a) | 2004 | 2003 | 2002 | |||||||||
Operating activities |
||||||||||||
Net income |
$ | 4,466 | $ | 6,719 | $ | 1,663 | ||||||
Adjustments to reconcile net income to net cash provided by (used in) operating activities: |
||||||||||||
Provision for credit losses |
2,544 | 1,540 | 4,331 | |||||||||
Depreciation and amortization |
3,835 | 3,101 | 2,979 | |||||||||
Deferred tax (benefit) provision |
(827 | ) | 1,428 | 1,636 | ||||||||
Investment securities (gains) losses |
(338 | ) | (1,446 | ) | (1,563 | ) | ||||||
Private equity unrealized (gains) losses |
(766 | ) | (77 | ) | 641 | |||||||
Net change in: |
||||||||||||
Trading assets |
(48,703 | ) | (2,671 | ) | (58,183 | ) | ||||||
Securities borrowed |
(4,816 | ) | (7,691 | ) | 2,437 | |||||||
Accrued interest and accounts receivable |
(2,391 | ) | 1,809 | 677 | ||||||||
Other assets |
(17,588 | ) | (9,916 | ) | 6,182 | |||||||
Trading liabilities |
29,764 | 15,769 | 25,402 | |||||||||
Accounts payable, accrued expenses and other liabilities |
13,277 | 5,973 | (11,664 | ) | ||||||||
Other operating adjustments |
(262 | ) | 63 | 328 | ||||||||
Net cash (used in) provided by operating activities |
(21,805 | ) | 14,601 | (25,134 | ) | |||||||
Investing activities |
||||||||||||
Net change in: |
||||||||||||
Deposits with banks |
(4,196 | ) | (1,233 | ) | 3,801 | |||||||
Federal funds sold and securities purchased under resale agreements |
(13,101 | ) | (11,059 | ) | (2,082 | ) | ||||||
Other change in loans |
(136,851 | ) | (171,779 | ) | (98,695 | ) | ||||||
Held-to-maturity securities: |
||||||||||||
Proceeds |
66 | 221 | 85 | |||||||||
Purchases |
— | — | (40 | ) | ||||||||
Available-for-sale securities: |
||||||||||||
Proceeds from maturities |
45,197 | 10,548 | 5,094 | |||||||||
Proceeds from sales |
134,534 | 315,738 | 219,385 | |||||||||
Purchases |
(173,745 | ) | (301,854 | ) | (244,547 | ) | ||||||
Loans due to sales and securitizations |
108,637 | 170,870 | 97,004 | |||||||||
Net cash received (used) in business acquisitions |
13,839 | (669 | ) | (72 | ) | |||||||
All other investing activities, net |
2,544 | 1,635 | (3,277 | ) | ||||||||
Net cash (used in) provided by investing activities |
(23,076 | ) | 12,418 | (23,344 | ) | |||||||
Financing Activities |
||||||||||||
Net change in: |
||||||||||||
Deposits |
52,082 | 21,851 | 11,103 | |||||||||
Federal funds purchased and securities sold under repurchase agreements |
7,065 | (56,017 | ) | 41,038 | ||||||||
Commercial paper and other borrowed funds |
(4,343 | ) | 555 | (4,675 | ) | |||||||
Proceeds from the issuance of long-term debt and capital debt securities |
25,344 | 17,195 | 11,971 | |||||||||
Repayments of long-term debt and capital debt securities |
(16,039 | ) | (8,316 | ) | (12,185 | ) | ||||||
Net issuance of stock and stock-based awards |
848 | 1,213 | 725 | |||||||||
Redemption of preferred stock |
(670 | ) | — | — | ||||||||
Redemption of preferred stock of subsidiary |
— | — | (550 | ) | ||||||||
Treasury stock purchased |
(738 | ) | — | — | ||||||||
Cash dividends paid |
(3,927 | ) | (2,865 | ) | (2,784 | ) | ||||||
All other financing activities, net |
(26 | ) | 133 | — | ||||||||
Net cash provided by (used in) financing activities |
59,596 | (26,251 | ) | 44,643 | ||||||||
Effect of exchange rate changes on cash and due from banks |
185 | 282 | 453 | |||||||||
Net increase (decrease) in cash and due from banks |
14,900 | 1,050 | (3,382 | ) | ||||||||
Cash and due from banks at the beginning of the year |
20,268 | 19,218 | 22,600 | |||||||||
Cash and due from banks at the end of the year |
$ | 35,168 | $ | 20,268 | $ | 19,218 | ||||||
Cash interest paid |
$ | 13,384 | $ | 10,976 | $ | 13,534 | ||||||
Cash income taxes paid |
$ | 1,477 | $ | 1,337 | $ | 1,253 | ||||||
| Note: | The fair values of noncash assets acquired and liabilities assumed in the Merger with
Bank One were $320.9 billion and $277.0 billion, respectively. Approximately 1,469 million shares
of common stock, valued at approximately $57.3 billion, were issued in connection with the merger
with Bank One. |
|
| (a) | 2004 results include six months of the combined Firm’s results and six months of heritage
JPMorgan Chase results. All other periods reflect the results of heritage JPMorgan Chase only. |
The Notes to consolidated financial statements are an integral part of these statements.
| JPMorgan Chase & Co. / 2004 Annual Report | 87 |
Table of Contents
Notes to consolidated financial statements
Note 1 – Basis of presentation
JPMorgan Chase & Co. (“JPMorgan Chase” or the “Firm”), a financial holding company incorporated under Delaware law in 1968, is a leading global financial services firm and one of the largest banking institutions in the United States, with operations in more than 50 countries. The Firm is a leader in investment banking, financial services for consumers and businesses, financial transaction processing, investment management, private banking and private equity. For a discussion of the Firm’s business segment information, see Note 31 on pages 126-127 of this Annual Report.
The accounting and financial reporting policies of JPMorgan Chase and its subsidiaries conform to accounting principles generally accepted in the United States of America (“U.S. GAAP”) and prevailing industry practices. Additionally, where applicable, the policies conform to the accounting and reporting guidelines prescribed by bank regulatory authorities.
Certain amounts in the prior periods have been reclassified to conform to the current presentation.
Consolidation
The usual condition for a controlling financial interest is ownership of a majority of the voting interests of an entity. However, a controlling financial interest may also exist in entities, such as special purpose entities (“SPEs”), through arrangements that do not involve controlling voting interests.
SPEs are an important part of the financial markets, providing market liquidity by facilitating investors’ access to specific portfolios of assets and risks. They are, for example, critical to the functioning of the mortgage- and asset-backed securities and commercial paper markets. SPEs may be organized as trusts, partnerships or corporations and are typically set up for a single, discrete purpose. SPEs are not typically operating entities and usually have a limited life and no employees. The basic SPE structure involves a company selling assets to the SPE. The SPE funds the purchase of those assets by issuing securities to investors. The legal documents that govern the transaction describe how the cash earned on the assets must be allocated to the SPE’s investors and other parties that have rights to those cash flows. SPEs can be structured to be bankruptcy-remote, thereby insulating investors from the impact of the creditors of other entities, including the seller of the assets.
There are two different accounting frameworks applicable to SPEs; the qualifying SPE (“QSPE”) framework under SFAS 140; and the variable interest entity (“VIE”) framework under FIN 46R. The applicable framework depends on the nature of the entity and the Firm’s relation to that entity. The QSPE framework is applicable when an entity transfers (sells) financial assets to an SPE meeting certain criteria as defined in SFAS 140. These criteria are designed to ensure that the activities of the entity are essentially predetermined in their entirety at the inception of the vehicle and that the transferor of the financial assets cannot exercise control over the entity and the assets therein. Entities meeting these criteria are not consolidated by the transferor or other counterparty, as long as the entity does not have the unilateral ability to liquidate or to cause it to no longer meet the QSPE criteria. The Firm primarily follows the QSPE model for securitizations of its residential and commercial mortgages, credit card loans and automobile loans. For further details, see Note 13 on pages 103-106 of this Annual Report.
When the SPE does not meet the QSPE criteria, consolidation is assessed pursuant to FIN 46R. Under FIN 46R, a VIE is defined as an entity that: (1) lacks enough equity investment at risk to permit the entity to finance its activities without additional subordinated financial support from other parties, (2) has equity owners that lack the right to make significant decisions affecting the entity’s operations, and/or (3) has equity owners that do not have an obligation to absorb or the right to receive the entity’s losses or returns.
FIN 46R requires a variable interest holder (i.e., a counterparty to a VIE) to consolidate the VIE if that party will absorb a majority of the expected losses of the VIE, receive a majority of the residual returns of the VIE, or both. This party is considered the primary beneficiary of the entity. The determination of whether the Firm meets the criteria to be considered the primary beneficiary of a VIE requires an evaluation of all transactions (such as investments, liquidity commitments, derivatives and fee arrangements) with the entity and an expected loss calculation when necessary. For further details, see Note 14 on pages 106-109 of this Annual Report.
Prior to the Firm’s adoption of FIN 46 on July 1, 2003, the decision of whether or not to consolidate depended on the applicable accounting principles for non-QSPEs, including a determination regarding the nature and amount of investment made by third parties in the SPE. Consideration was given to, among other factors, whether a third party had made a substantive equity investment in the SPE; which party had voting rights, if any; who made decisions about the assets in the SPE; and who was at risk of loss. The SPE was consolidated if JPMorgan Chase retained or acquired control over the risks and rewards of the assets in the SPE.
Financial assets are derecognized when they meet the accounting sale criteria. Those criteria are: (1) the assets are legally isolated from the Firm’s creditors; (2) the entity can pledge or exchange the financial assets or, if the entity is a QSPE, its investors can pledge or exchange their interests; and (3) the Firm does not maintain effective control via an agreement to repurchase the assets before their maturity or have the ability to unilaterally cause the holder to return the assets. All significant transactions and retained interests between the Firm, QSPEs and nonconsolidated VIEs are reflected on JPMorgan Chase’s Consolidated balance sheets or in the Notes to consolidated financial statements.
Investments in companies that are considered to be voting-interest entities under FIN 46R, in which the Firm has significant influence over operating and financing decisions (generally defined as owning a voting or economic interest of 20% to 50%) are accounted for in accordance with the equity method of accounting. These investments are generally included in Other assets, and the Firm’s share of income or loss is included in Other income. For a discussion of private equity investments, see Note 9 on pages 98-100 of this Annual Report.
Assets held for clients in an agency or fiduciary capacity by the Firm are not assets of JPMorgan Chase and are not included in the Consolidated balance sheets.
Use of estimates in the preparation of consolidated financial statements
| 88 | JPMorgan Chase & Co. / 2004 Annual Report |
Table of Contents
Foreign currency translation
Gains and losses relating to translating functional currency financial statements for U.S. reporting are included in Other comprehensive income (loss) within Stockholders’ equity. Gains and losses relating to nonfunctional currency transactions, including non-U.S. operations where the functional currency is the U.S. dollar and operations in highly inflationary environments, are reported in the Consolidated statements of income.
Statements of cash flows
Significant accounting policies
Trading activities
|
Note 3 | Page 90 | ||
Other noninterest revenue
|
Note 4 | Page 91 | ||
Pension and other postretirement employee
benefit plans
|
Note 6 | Page 92 | ||
Employee stock-based incentives
|
Note 7 | Page 95 | ||
Securities and private equity investments
|
Note 9 | Page 98 | ||
Securities financing activities
|
Note 10 | Page 100 | ||
Loans
|
Note 11 | Page 101 | ||
Allowance for credit losses
|
Note 12 | Page 102 | ||
Loan securitizations
|
Note 13 | Page 103 | ||
Variable interest entities
|
Note 14 | Page 106 | ||
Goodwill and other intangible assets
|
Note 15 | Page 109 | ||
Premises and equipment
|
Note 16 | Page 111 | ||
Income taxes
|
Note 22 | Page 115 | ||
Derivative instruments and hedging activities
|
Note 26 | Page 118 | ||
Off-balance sheet lending-related financial
instruments and guarantees
|
Note 27 | Page 119 | ||
Fair value of financial instruments
|
Note 29 | Page 121 | ||
Note 2 – Business changes and developments
Merger with Bank One Corporation
The purchase price of the Merger has been allocated to the assets acquired and liabilities assumed using their fair values at the merger date. The computation of the purchase price and the allocation of the purchase price to the net assets of Bank One — based on their respective fair values as of July 1, 2004 — and the resulting goodwill are presented below. The allocation of the purchase price may be modified through June 30, 2005, as more information is obtained about the fair value of assets acquired and liabilities assumed.
| (in millions, except per share amounts) | July 1, 2004 | |||||||
Purchase price |
||||||||
Bank One common stock exchanged |
1,113 | |||||||
Exchange ratio |
1.32 | |||||||
JPMorgan Chase common stock issued |
1,469 | |||||||
Average purchase price per |
||||||||
JPMorgan Chase common share(a) |
$ | 39.02 | ||||||
| $ | 57,336 | |||||||
Fair value of employee stock awards and
direct acquisition costs |
1,210 | |||||||
Total purchase price |
$ | 58,546 | ||||||
Net assets acquired: |
||||||||
Bank One stockholders’ equity |
$ | 24,156 | ||||||
Bank One goodwill and other intangible assets |
(2,754 | ) | ||||||
Subtotal |
21,402 | |||||||
Adjustments to reflect assets
acquired at fair value: |
||||||||
Loans and leases |
(2,261 | ) | ||||||
Private equity investments |
(75 | ) | ||||||
Identified intangibles |
8,665 | |||||||
Pension plan assets |
(778 | ) | ||||||
Premises and equipment |
(427 | ) | ||||||
Other assets |
(262 | ) | ||||||
Amounts to reflect liabilities
assumed at fair value: |
||||||||
Deposits |
(373 | ) | ||||||
Deferred income taxes |
767 | |||||||
Postretirement plan liabilities |
(49 | ) | ||||||
Other liabilities |
(975 | ) | ||||||
Long-term debt |
(1,234 | ) | ||||||
| 24,400 | ||||||||
Goodwill resulting from Merger |
$ | 34,146 | ||||||
| (a) | The value of the Firm’s common stock
exchanged with Bank One shareholders was based on
the average closing prices of the Firm’s common
stock for the two days prior to, and the two days
following, the announcement of the Merger on
January 14, 2004. |
| JPMorgan Chase & Co. / 2004 Annual Report | 89 |
Table of Contents
Notes to consolidated financial statements
Unaudited condensed statement of net assets acquired
| (in millions) July 1, 2004 | ||||
Assets |
||||
Cash and cash equivalents |
$ | 14,669 | ||
Securities |
70,512 | |||
Interests in purchased receivables |
30,184 | |||
Loans, net of allowance |
129,650 | |||
Goodwill and other intangible assets |
42,811 | |||
All other assets |
47,731 | |||
Total assets |
$ | 335,557 | ||
Liabilities |
||||
Deposits |
$ | 164,848 | ||
Short-term borrowings |
9,811 | |||
All other liabilities |
61,472 | |||
Long-term debt |
40,880 | |||
Total Liabilities |
277,011 | |||
Net assets acquired |
$ | 58,546 | ||
Acquired, identifiable intangible assets
| Weighted average | Useful life | |||||||||||
| (in millions) | Fair value | life (in years) | (in years) | |||||||||
Core deposit intangibles |
$ | 3,650 | 5.1 | Up to 10 | ||||||||
Purchased credit card relationships |
3,340 | 4.6 | Up to 10 | |||||||||
Other credit card-related intangibles |
295 | 4.6 | Up to 10 | |||||||||
Other customer relationship intangibles |
870 | 4.6-10.5 | Up to 20 | |||||||||
Subtotal |
8,155 | 5.1 | Up to 20 | |||||||||
Indefinite-lived asset management
intangibles |
510 | NA |
NA | |||||||||
Total |
$ | 8,665 | 5.1 | |||||||||
Unaudited pro forma condensed combined financial information
| Year ended December 31, (in millions) | 2004 | 2003 | ||||||
Noninterest revenue |
$ | 31,175 | $ | 28,966 | ||||
Net interest income |
21,366 | 21,715 | ||||||
Total net revenue |
52,541 | 50,681 | ||||||
Provision for credit losses |
2,727 | 3,570 | ||||||
Noninterest expense |
40,504 | 33,136 | ||||||
Income before income tax expense |
9,310 | 13,975 | ||||||
Net income |
$ | 6,544 | $ | 9,330 | ||||
Net income per common share: |
||||||||
Basic |
$ | 1.85 | $ | 2.66 | ||||
Diluted |
1.81 | 2.61 | ||||||
Average common shares outstanding: |
||||||||
Basic |
3,510 | 3,495 | ||||||
Diluted |
3,593 | 3,553 | ||||||
Other acquisitions
Note 3 – Trading activities
Trading revenue
| Year ended December 31,(a) (in millions) | 2004 | 2003 | 2002 | |||||||||
Fixed income and other(b) |
$ | 2,976 | $ | 4,046 | $ | 2,527 | ||||||
Equities(c) |
797 | 764 | 331 | |||||||||
Credit portfolio(d) |
(161 | ) | (383 | ) | (183 | ) | ||||||
Total |
$ | 3,612 | $ | 4,427 | $ | 2,675 | ||||||
| (a) | 2004 results include six months of the
combined Firm’s results and six months of heritage
JPMorgan Chase results. All other periods reflect
the results of heritage JPMorgan Chase only. |
|
| (b) | Includes bonds and commercial paper and various
types of interest rate derivatives as well as
foreign exchange and commodities. |
|
| (c) | Includes equity
securities and equity
derivatives. |
|
| (d) | Includes credit
derivatives. |
| 90 | JPMorgan Chase & Co. / 2004 Annual Report |
Table of Contents
Trading assets and liabilities
| December 31, (in millions) | 2004 | 2003(a) | ||||||
Trading assets |
||||||||
Debt and equity instruments: |
||||||||
U.S. government, federal agencies/corporations
obligations and municipal securities |
$ | 43,866 | $ | 44,678 | ||||
Certificates of deposit, bankers’ acceptances
and commercial paper |
7,341 | 5,765 | ||||||
Debt securities issued by non-U.S. governments |
50,699 | 36,243 | ||||||
Corporate securities and other |
120,926 | 82,434 | ||||||
Total debt and equity instruments |
222,832 | 169,120 | ||||||
Derivative receivables: |
||||||||
Interest rate |
45,892 | 60,176 | ||||||
Foreign exchange |
7,939 | 9,760 | ||||||
Equity |
6,120 | 8,863 | ||||||
Credit derivatives |
2,945 | 3,025 | ||||||
Commodity |
3,086 | 1,927 | ||||||
Total derivative receivables |
65,982 | 83,751 | ||||||
Total trading assets |
$ | 288,814 | $ | 252,871 | ||||
Trading liabilities |
||||||||
Debt and equity instruments(b) |
$ | 87,942 | $ | 78,222 | ||||
Derivative payables: |
||||||||
Interest rate |
41,075 | 49,189 | ||||||
Foreign exchange |
8,969 | 10,129 | ||||||
Equity |
9,096 | 8,203 | ||||||
Credit derivatives |
2,499 | 2,672 | ||||||
Commodity |
1,626 | 1,033 | ||||||
Total derivative payables |
63,265 | 71,226 | ||||||
Total trading liabilities |
$ | 151,207 | $ | 149,448 | ||||
| (a) | Heritage JPMorgan Chase only. |
|
| (b) | Primarily represents securities sold, not yet purchased. |
Average Trading assets and liabilities were as follows for the periods indicated:
| Year ended December 31,(a) (in millions) | 2004 | 2003 | 2002 | |||||||||
Trading
assets – debt and
equity instruments |
$ | 200,467 | $ | 154,597 | $ | 149,173 | ||||||
Trading
assets – derivative receivables |
59,521 | 85,628 | 73,641 | |||||||||
Trading
liabilities – debt and
equity instruments(b) |
$ | 82,204 | $ | 72,877 | $ | 64,725 | ||||||
Trading
liabilities – derivative payables |
52,761 | 67,783 | 57,607 | |||||||||
| (a) | 2004 results include six months of the
combined Firm’s results and six months of heritage
JPMorgan Chase results. All other periods reflect
the results of heritage JPMorgan Chase only. |
|
| (b) | Primarily represents securities sold, not yet purchased. |
Note 4 – Other noninterest revenue
Investment banking fees
The following table presents the components of Investment banking fees:
| Year ended December 31, (in millions)(a) | 2004 | 2003 | 2002 | |||||||||
Underwriting: |
||||||||||||
Equity |
$ | 780 | $ | 699 | $ | 464 | ||||||
Debt |
1,859 | 1,549 | 1,543 | |||||||||
Total Underwriting |
2,639 | 2,248 | 2,007 | |||||||||
Advisory |
898 | 642 | 756 | |||||||||
Total |
$ | 3,537 | $ | 2,890 | $ | 2,763 | ||||||
| (a) | 2004 results include six months of the
combined Firm’s results and six months of heritage
JPMorgan Chase results. All other periods reflect
the results of heritage JPMorgan Chase only. |
Lending & deposit related fees
Asset management, administration and commissions
Mortgage fees and related income
Credit card income
Credit card revenue sharing agreements
The Firm has contractual agreements with numerous
affinity organizations and co-brand partners, which
grant to the Firm exclusive rights to market to
their members or customers. These organizations and
partners provide to the Firm their endorsement of
the credit card programs, mailing lists, and may
also conduct marketing activities, and provide
awards under the various credit card programs. The
terms of these agreements generally range from 3 to
10 years. The economic incentives the Firm pays to
the endorsing organizations and partners typically
include payments based on new accounts, activation,
charge volumes, and the cost of their marketing
activities and awards.
| JPMorgan Chase & Co. / 2004 Annual Report | 91 |
Table of Contents
Notes to consolidated financial statements
Note 5 – Interest income and interest expense
Details of Interest income and Interest expense were as follows:
| Year ended December 31, (in millions)(a) | 2004 | 2003 | 2002 | |||||||||
Interest Income |
||||||||||||
Loans |
$ | 16,771 | $ | 11,812 | $ | 12,709 | ||||||
Securities |
3,377 | 3,542 | 3,367 | |||||||||
Trading assets |
7,527 | 6,592 | 6,798 | |||||||||
Federal funds sold and securities
purchased under resale agreements |
1,627 | 1,497 | 2,078 | |||||||||
Securities borrowed |
463 | 323 | 681 | |||||||||
Deposits with banks |
539 | 214 | 303 | |||||||||
Interests in purchased receivables |
291 | 64 | — | |||||||||
Total interest income |
30,595 | 24,044 | 25,936 | |||||||||
Interest Expense |
||||||||||||
Interest-bearing deposits |
4,600 | 3,604 | 5,253 | |||||||||
Short-term and other liabilities |
6,290 | 5,871 | 7,038 | |||||||||
Long-term debt |
2,466 | 1,498 | 1,467 | |||||||||
Beneficial interests issued by
consolidated VIEs |
478 | 106 | — | |||||||||
Total interest expense |
13,834 | 11,079 | 13,758 | |||||||||
Net interest income |
16,761 | 12,965 | 12,178 | |||||||||
Provision for credit losses |
2,544 | 1,540 | 4,331 | |||||||||
Net interest income after provision
for credit losses |
$ | 14,217 | $ | 11,425 | $ | 7,847 | ||||||
| (a) | 2004 results include six months of the
combined Firm’s results and six months of heritage
JPMorgan Chase results. All other periods reflect
the results of heritage JPMorgan Chase only. |
Note 6 – Pension and other postretirement employee benefit plans
New U.S.-based postretirement plans were approved in 2004 and the prior plans of JPMorgan Chase and Bank One were merged as of December 31, 2004.
The Firm’s defined benefit pension plans are accounted for in accordance with SFAS 87 and SFAS 88. Its postretirement medical and life insurance plans are accounted for in accordance with SFAS 106.
The Firm uses a measurement date of December 31 for its pension and other postretirement employee benefit plans. The fair value of plan assets is used to determine the expected return on plan assets for its U.S. and non-U.S. defined benefit pension plans. For the U.S. postretirement benefit plan, the market-related value, which recognizes changes in fair value over a five-year period, is used to determine the expected return on plan assets. Unrecognized net actuarial gains and losses are amortized over the average remaining service period of active plan participants, if required.
In December 2003, the Medicare Prescription Drug, Improvement and Modernization Act of 2003 (the “Act”) was enacted. The Act established a prescription drug benefit under Medicare (“Medicare Part D”) and a federal subsidy to sponsors of retiree health care benefit plans that provide a benefit that is at least actuarially equivalent to Medicare Part D. The Firm has determined that benefits provided to certain participants will be at least actuarially equivalent to Medicare Part D and has reflected the estimated effects of the subsidy in its financial statements and disclosures retroactive to the beginning of 2004 (July 1, 2004 for Bank One Plans) in accordance with FSP SFAS 106-2.
Defined benefit pension plans
It is the Firm’s policy to fund its pension plans in amounts sufficient to meet the requirements under applicable employee benefit and local tax laws. In 2004, the Firm made a cash contribution to its U.S. defined benefit pension plan of $1.1 billion on April 1, funding the plan to the maximum allowable amount under applicable tax law. Additionally, the Firm made cash contributions totaling $40 million to fully fund the accumulated benefit obligations of certain non-U.S. defined benefit pension plans as of December 31, 2004. Based on the current funded status of the U.S. and non-U.S. pension plans, the Firm does not expect to make significant contributions in 2005.
Postretirement medical and life insurance
JPMorgan Chase’s U.S. postretirement benefit obligation is partially funded with corporate-owned life insurance (“COLI”) purchased on the lives of eligible employees and retirees. While the Firm owns the COLI policies, COLI proceeds (death benefits, withdrawals and other distributions) may be used only to reimburse the Firm for its net postretirement benefit claim payments and related administrative expenses. The U.K. postretirement benefit plan is unfunded.
The following tables present the funded status and amounts reported on the Consolidated balance sheets, the accumulated benefit obligation and the components of net periodic benefit costs reported in the Consolidated statements of income for the Firm’s U.S. and non-U.S. defined benefit pension and postretirement benefit plans.
| 92 | JPMorgan Chase & Co. / 2004 Annual Report |
Table of Contents
| Defined benefit pension plans | ||||||||||||||||||||||||
| U.S. | Non-U.S. | Postretirement benefit plans(d) | ||||||||||||||||||||||
| December 31, (in millions) | 2004 | (a) | 2003 | (b) | 2004 | (a) | 2003 | (b) | 2004 | (a)(c) | 2003 | (b) | ||||||||||||
Change in benefit obligation |
||||||||||||||||||||||||
Benefit obligation at beginning of year |
$ | (4,633 | ) | $ | (4,241 | ) | $ | (1,659 | ) | $ | (1,329 | ) | $ | (1,252 | ) | $ | (1,126 | ) | ||||||
Merger with Bank One |
(2,497 | ) | NA | (25 | ) | NA | (216 | ) | NA | |||||||||||||||
Benefits earned during the year |
(251 | ) | (180 | ) | (17 | ) | (16 | ) | (15 | ) | (15 | ) | ||||||||||||
Interest cost on benefit obligations |
(348 | ) | (262 | ) | (87 | ) | (74 | ) | (81 | ) | (73 | ) | ||||||||||||
Plan amendments |
70 | (89 | ) | — | (1 | ) | 32 | — | ||||||||||||||||
Employee contributions |
— | — | — | (1 | ) | (36 | ) | (11 | ) | |||||||||||||||
Actuarial gain (loss) |
(511 | ) | (262 | ) | (99 | ) | (125 | ) | (163 | ) | (134 | ) | ||||||||||||
Benefits paid |
555 | 386 | 64 | 55 | 167 | 113 | ||||||||||||||||||
Curtailments |
21 | 15 | — | — | (8 | ) | (2 | ) | ||||||||||||||||
Special termination benefits |
— | — | (12 | ) | (1 | ) | (2 | ) | — | |||||||||||||||
Foreign exchange impact and other |
— | — | (134 | ) | (167 | ) | (3 | ) | (4 | ) | ||||||||||||||
Benefit obligation at end of year |
$ | (7,594 | ) | $ | (4,633 | ) | $ | (1,969 | ) | $ | (1,659 | ) | $ | (1,577 | ) | $ | (1,252 | ) | ||||||
Change in plan assets |
||||||||||||||||||||||||
Fair value of plan assets at beginning of year |
$ | 4,866 | $ | 4,114 | $ | 1,603 | $ | 1,281 | $ | 1,149 | $ | 1,020 | ||||||||||||
Merger with Bank One |
3,280 | NA | 20 | NA | 98 | NA | ||||||||||||||||||
Actual return on plan assets |
946 | 811 | 164 | 133 | 84 | 154 | ||||||||||||||||||
Firm contributions |
1,100 | 327 | 40 | 87 | 2 | 2 | ||||||||||||||||||
Benefits paid |
(555 | ) | (386 | ) | (64 | ) | (43 | ) | (31 | ) | (27 | ) | ||||||||||||
Settlement payments |
— | — | — | (12 | ) | — | — | |||||||||||||||||
Foreign exchange impact and other |
— | — | 126 | 157 | — | — | ||||||||||||||||||
Fair value of plan assets at end of year |
$ | 9,637 | (e) | $ | 4,866 | (e) | $ | 1,889 | $ | 1,603 | $ | 1,302 | $ | 1,149 | ||||||||||
Reconciliation of funded status |
||||||||||||||||||||||||
Funded status |
$ | 2,043 | $ | 233 | $ | (80 | ) | $ | (56 | ) | $ | (275 | ) | $ | (103 | ) | ||||||||
Unrecognized amounts: |
||||||||||||||||||||||||
Net transition asset |
— | — | (1 | ) | (1 | ) | — | — | ||||||||||||||||
Prior service cost |
47 | 137 | 4 | 5 | (23 | ) | 8 | |||||||||||||||||
Net actuarial (gain) loss |
997 | 920 | 590 | 564 | 321 | 156 | ||||||||||||||||||
Prepaid benefit cost reported in Other assets |
$ | 3,087 | $ | 1,290 | $ | 513 | (f) | $ | 512 | (f) | $ | 23 | $ | 61 | ||||||||||
Accumulated benefit obligation |
$ | (7,167 | ) | $ | (4,312 | ) | $ | (1,931 | ) | $ | (1,626 | ) | NA | NA | ||||||||||
| (a) | Effective July 1, 2004, the Firm assumed the obligations of heritage Bank One’s pension
and other postretirement plans. These plans were similar to those of JPMorgan Chase and were merged
into the Firm’s plans effective December 31, 2004. |
|
| (b) | Heritage JPMorgan Chase only. |
|
| (c) | The effect of the Medicare Prescription Drug, Improvement and Modernization Act of 2003
resulted in a $35 million reduction in the Accumulated other postretirement benefit obligation. |
|
| (d) | Includes postretirement benefit obligation of $43 million and $36 million and postretirement
benefit liability (included in Accrued expenses) of $57 million and $54 million at December 31,
2004 and 2003, respectively, for the UK plan, which is unfunded. |
|
| (e) | At December 31, 2004 and 2003, approximately $358 million and $315 million, respectively, of
U.S. plan assets relate to surplus assets of group annuity contracts. |
|
| (f) | At December 31, 2004 and 2003, Accrued expenses related to non-U.S. defined benefit pension
plans that JPMorgan Chase elected not to pre-fund fully totaled $124 million and $99 million,
respectively. |
| Defined benefit pension plans | ||||||||||||||||||||||||||||||||||||
| U.S. | Non-U.S. | Postretirement benefit plans | ||||||||||||||||||||||||||||||||||
| For the year ended December 31, (in millions)(a) | 2004 | 2003 | 2002 | 2004 | 2003 | 2002 | 2004 | 2003 | 2002 | |||||||||||||||||||||||||||
Components of net periodic benefit costs |
||||||||||||||||||||||||||||||||||||
Benefits earned during the period |
$ | 251 | $ | 180 | $ | 174 | $ | 17 | $ | 16 | $ | 16 | $ | 15 | $ | 15 | $ | 12 | ||||||||||||||||||
Interest cost on benefit obligations |
348 | 262 | 275 | 87 | 74 | 62 | 81 | 73 | 69 | |||||||||||||||||||||||||||
Expected return on plan assets |
(556 | ) | (322 | ) | (358 | ) | (90 | ) | (83 | ) | (76 | ) | (86 | ) | (92 | ) | (98 | ) | ||||||||||||||||||
Amortization of unrecognized amounts: |
||||||||||||||||||||||||||||||||||||
Prior service cost |
13 | 6 | 7 | 1 | — | — | — | 1 | 2 | |||||||||||||||||||||||||||
Net actuarial (gain) loss |
23 | 62 | — | 44 | 35 | 6 | — | — | (10 | ) | ||||||||||||||||||||||||||
Curtailment (gain) loss |
7 | 2 | 15 | — | 8 | (3 | ) | 8 | 2 | (8 | ) | |||||||||||||||||||||||||
Settlement (gain) loss |
— | — | — | (1 | ) | — | (2 | ) | — | — | — | |||||||||||||||||||||||||
Special termination benefits |
— | — | — | 11 | — | 3 | 2 | — | 57 | |||||||||||||||||||||||||||
Net periodic benefit costs reported in
Compensation expense |
$ | 86 | $ | 190 | $ | 113 | $ | 69 | $ | 50 | $ | 6 | $ | 20 | (b) | $ | (1 | ) | $ | 24 | ||||||||||||||||
| (a) | 2004 results include six months of the combined Firm’s results and six months of heritage
JPMorgan Chase results. All other periods reflect the results of heritage JPMorgan Chase only. |
|
| (b) | The effect of the Medicare Prescription Drug, Improvement and Modernization Act of 2003 resulted in
a $5 million reduction in the Firm’s net periodic benefit costs. |
| JPMorgan Chase & Co. / 2004 Annual Report | 93 |
Table of Contents
Notes to consolidated financial statements
JPMorgan Chase has a number of other defined benefit pension plans (i.e., U.S. plans not subject to Title IV of the Employee Retirement Income Security Act). The most significant of these plans is the Excess Retirement Plan, pursuant to which certain employees earn service credits on compensation amounts above the maximum stipulated by law. This plan is a nonqualified, noncontributory U.S. pension plan with an unfunded liability at December 31, 2004 and 2003, in the amount of $292 million and $178 million, respectively. Compensation expense related to the Firm’s other defined benefit pension plans totaled $28 million in 2004, $19 million in 2003 and $15 million in 2002.
Plan assumptions
In the United Kingdom, which represents the most significant of the non-U.S. pension plans, procedures similar to those in the United States are used to develop the expected long-term rate of return on pension plan assets, taking into consideration local market conditions and the specific allocation of plan assets. The expected long-term rate of return on U.K. plan assets is an average of projected long-term returns for each asset class, selected by reference to the yield on long-term U.K. government bonds and AA-rated long-term corporate bonds, plus an equity risk premium above the risk-free rate.
The discount rate used in determining the benefit obligation under the U.S. pension and other postretirement employee benefit plans is selected by reference to the year-end Moody’s corporate AA rate, as well as other high-quality indices with similar duration to that of the respective plan’s benefit obligations. The discount rate for the U.K. postretirement plans is selected by reference to the year-end iBoxx £ corporate AA 15-year-plus bond rate.
The following tables present the weighted-average annualized actuarial assumptions for the projected and accumulated benefit obligations, and the components of net periodic benefit costs for the Firm’s U.S. and non-U.S. defined benefit pension and postretirement benefit plans, as of year-end.
| U.S. | Non-U.S. | |||||||||||||||
| For the year ended December 31, | 2004 | 2003 | 2004 | 2003 | ||||||||||||
Weighted-average assumptions used to determine
benefit obligations |
||||||||||||||||
Discount rate |
5.75 | % | 6.00 | % | 2.00-5.30 | % | 2.00-5.40 | % | ||||||||
Rate of compensation increase |
4.50 | 4.50 | 1.75-3.75 | 1.75-3.75 | ||||||||||||
| U.S. | Non-U.S. | |||||||||||||||||||||||
| For the year ended December 31, | 2004 | 2003 | 2002 | 2004 | 2003 | 2002 | ||||||||||||||||||
Weighted-average assumptions used to determine net
periodic benefit costs |
||||||||||||||||||||||||
Discount rate |
6.00 | % | 6.50 | % | 7.25 | % | 2.00-5.75 | % | 1.50-5.60 | % | 2.50-6.00 | % | ||||||||||||
Expected long-term rate of return on plan assets: |
||||||||||||||||||||||||
Pension |
7.50-7.75 | 8.00 | 9.25 | 3.00-6.50 | 2.70-6.50 | 3.25-7.25 | ||||||||||||||||||
Postretirement benefit |
4.75-7.00 | 8.00 | 9.00 | NA | NA | NA | ||||||||||||||||||
Rate of compensation increase |
4.25-4.50 | 4.50 | 4.50 | 1.75-3.75 | 1.25-3.00 | 2.00-4.00 | ||||||||||||||||||
The following tables present JPMorgan Chase’s assumed weighted-average medical benefits cost trend rate, which is used to measure the expected cost of benefits at year-end, and the effect of a one-percentage-point change in the assumed medical benefits cost trend rate.
| December 31, | 2004 | 2003 | (a) | 2002 | (a) | |||||||
Health care cost trend rate assumed
for next year |
10 | % | 10 | % | 9 | % | ||||||
Rate to which cost trend rate is assumed
to decline (ultimate trend rate) |
5 | 5 | 5 | |||||||||
Year that rate reaches ultimate trend rate |
2012 | 2010 | 2008 | |||||||||
| (in millions) | 1-Percentage- | 1-Percentage- | ||||||
| For the year ended December 31,2004 | point increase | point decrease | ||||||
Effect on total service and interest costs |
$ | 5 | $ | (4 | ) | |||
Effect on postretirement benefit obligation |
71 | (62 | ) | |||||
| (a) | Heritage JPMorgan Chase only. |
At December 31, 2004, the Firm reduced the discount rate used to determine its U.S. benefit obligations to 5.75%. The Firm also reduced the 2005 expected long-term rate of return on its U.S. pension plan assets to 7.50%. The expected
long-term rate of return on the Firm’s COLI postretirement plan assets remained at 7%; however, with the merger of Bank One’s other postretirement plan assets, the Firm’s overall expected long-term rate of return on U.S. postretirement plan assets decreased to 6.80% to reflect a weighted average expected rate of return for the merged plan. The changes as of December 31, 2004, to the discount rate and the expected long-term rate of return on plan assets is expected to increase 2005 U.S. pension and other postretirement benefit expenses by approximately $41 million. The impact of any changes to the discount rate and the expected long-term rate of return on plan assets on non-U.S. pension and other postretirement benefit expenses is not expected to be material.
JPMorgan Chase’s U.S. pension and other postretirement benefit expenses are most sensitive to the expected long-term rate of return on plan assets. With all other assumptions held constant, a 25-basis point decline in the expected long-term rate of return on U.S. plan assets would result in an increase of approximately $25 million in 2005 U.S. pension and other postretirement benefit expenses. Additionally, a 25-basis point decline in the discount rate for the U.S. plans would result in an increase in 2005 U.S. pension and other postretirement benefit expenses of approximately $16 million and an increase in the related projected benefit obligations of approximately $215 million.
| 94 | JPMorgan Chase & Co. / 2004 Annual Report |
Table of Contents
Investment strategy and asset allocation
The Firm’s U.S. pension plan assets are held in various trusts and are invested in well diversified portfolios of equity (including U.S. large and small capitalization and international equities), fixed income (including corporate and
government bonds), Treasury inflation-indexed and high-yield securities, cash equivalents and other securities. Non-U.S. pension plan assets are similarly invested in well-diversified portfolios of equity, fixed income and other securities. Assets of the Firm’s COLI policies, which are used to fund partially the U.S. postretirement benefit plan, are held in separate accounts with an insurance company and are invested in equity and fixed income index funds. In addition, tax-exempt municipal debt securities, held in a trust, are used to fund the U.S. postretirement benefit plan. Assets used to fund the Firm’s U.S. and non-U.S. defined benefit pension plans include $53 million of JPMorgan Chase common stock in addition to JPMorgan Chase common stock held in connection with investments in third-party stock-index funds.
The following table presents the weighted-average asset allocation at December 31 for the years indicated, and the respective target allocation by asset category, for the Firm’s U.S. and non-U.S. defined benefit pension and postretirement benefit plans.
| Defined benefit pension plans | ||||||||||||||||||||||||||||||||||||
| U.S. | Non-U.S.(a) | Postretirement benefit plans(b) | ||||||||||||||||||||||||||||||||||
| Target | % of plan assets | Target | % of plan assets | Target | % of plan assets | |||||||||||||||||||||||||||||||
| December 31, | Allocation | 2004 | 2003 | (c) | Allocation | 2004 | 2003 | (c) | Allocation | 2004 | 2003 | (c) | ||||||||||||||||||||||||
Asset class |
||||||||||||||||||||||||||||||||||||
Debt securities |
40 | % | 38 | % | 41 | % | 74 | % | 74 | % | 70 | % | 50 | % | 46 | % | 50 | % | ||||||||||||||||||
Equity securities |
50 | 53 | 53 | 26 | 26 | 24 | 50 | 54 | 50 | |||||||||||||||||||||||||||
Real estate |
5 | 5 | 5 | — | — | — | — | — | — | |||||||||||||||||||||||||||
Other |
5 | 4 | 1 | — | — | 6 | — | — | — | |||||||||||||||||||||||||||
Total |
100 | % | 100 | % | 100 | % | 100 | % | 100 | % | 100 | % | 100 | % | 100 | % | 100 | % | ||||||||||||||||||
| (a) | Represents the U.K. defined benefit pension
plan only, as plans outside the U.K. are not
significant. |
|
| (b) | Represents the U.S. postretirement benefit
plan only, as the U.K. plan is unfunded. |
|
| (c) | Heritage JPMorgan Chase only. |
Estimated future benefit payments
| Non- | U.S. and U.K. | |||||||||||
| Year ended December 31, | U.S. pension | U.S. pension | postretirement | |||||||||
| (in millions) | benefits | benefits | benefits | |||||||||
2005 |
$ | 619 | $ | 60 | $ | 113 | ||||||
2006 |
578 | 62 | 110 | |||||||||
2007 |
592 | 65 | 112 | |||||||||
2008 |
606 | 67 | 114 | |||||||||
2009 |
621 | 70 | 116 | |||||||||
Years 2010-2014 |
3,352 | 387 | 588 | |||||||||
Defined contribution plans
Note 7 – Employee stock-based incentives
Effective January 1, 2003, JPMorgan Chase adopted SFAS 123 using the prospective transition method. SFAS 123 requires all stock-based compensation awards, including stock options and stock-settled stock appreciation rights (“SARs”), to be accounted for at fair value. Stock options that were outstanding as of December 31, 2002 continue to be accounted for under APB 25 using the intrinsic value method. Under this method, no expense is recognized for stock options or SARs granted at the stock price on grant date, since such options have no intrinsic value. The Firm currently uses the Black-Scholes valuation model to estimate the fair value of stock options and SARs. Compensation expense for restricted stock and restricted stock units (“RSUs”) is measured based on the number of shares granted and the stock price at the grant date. Compensation expense is recognized in earnings over the required service period.
In connection with the Merger, JPMorgan Chase converted all outstanding Bank One employee stock-based awards at the merger date, and those awards became exercisable for or based upon JPMorgan Chase common stock. The number of awards converted, and the exercise prices of those awards, was adjusted to take into account the Merger exchange ratio of 1.32.
On December 16, 2004, the FASB issued SFAS 123R, which revises SFAS 123 and supersedes APB 25. Accounting and reporting under SFAS 123R is generally similar to the SFAS 123 approach except that SFAS 123R requires all share-based payments to employees, including grants of stock options and SARs, to be recognized in the income statement based on their fair values. SFAS 123R must be adopted no later than July 1, 2005. SFAS 123R permits adoption using one of two methods — modified prospective or modified retrospective. The Firm is currently evaluating both the timing and method of adopting the new standard.
| JPMorgan Chase & Co. / 2004 Annual Report | 95 |
Table of Contents
Notes to consolidated financial statements
Key employee stock-based awards
JPMorgan Chase grants long-term stock-based
incentive awards to certain key employees under two
plans (the “LTI Plans”): the 1996 Long-Term
Incentive Plan (the “1996 Plan”), as amended and
approved by shareholders in May 2000, provides for
grants of stock options, SARs, restricted stock and
RSU awards, and the Stock Option Plan, a
nonshareholder-approved plan, provides for grants
of stock options and SARs. In 2004, 14.5 million
SARs
settled only in shares and 2.2 million nonqualified stock options were granted under the 1996 Plan.
Under the LTI Plans, stock options and SARs are granted with an exercise price equal to JPMorgan Chase’s common stock price on the grant date. Generally, options and SARs cannot be exercised until at least one year after the grant date and become exercisable over various periods as determined at the time of the grant. These awards generally expire 10 years after the grant date.
The following table presents a summary of JPMorgan Chase’s option and SAR activity under the LTI Plans during the last three years:
| 2004 | 2003 | 2002 | ||||||||||||||||||||||
| Year ended December 31,(a) | Number of | Weighted-average | Number of | Weighted-average | Number of | Weighted-average | ||||||||||||||||||
| (in thousands) | options/SARs | exercise price | options | exercise price | options | exercise price | ||||||||||||||||||
Outstanding, January 1 |
294,026 | $ | 39.88 | 298,731 | $ | 40.84 | 272,304 | $ | 41.23 | |||||||||||||||
Granted |
16,667 | 39.79 | 26,751 | 22.15 | 53,230 | 36.41 | ||||||||||||||||||
Bank One Conversion, July 1 |
111,287 | 29.63 | NA | NA | NA | NA | ||||||||||||||||||
Exercised |
(27,763 | ) | 25.33 | (14,574 | ) | 17.47 | (9,285 | ) | 16.85 | |||||||||||||||
Canceled |
(17,887 | ) | 46.68 | (16,882 | ) | 47.57 | (17,518 | ) | 45.59 | |||||||||||||||
Outstanding, December 31 |
376,330 | $ | 37.59 | 294,026 | $ | 39.88 | 298,731 | $ | 40.84 | |||||||||||||||
Exercisable, December 31 |
246,945 | $ | 36.82 | 176,163 | $ | 37.88 | 144,421 | $ | 34.91 | |||||||||||||||
| (a) | 2004 includes six months of awards for the combined Firm and six months of awards for
heritage JPMorgan Chase. All other periods reflect the awards for heritage JPMorgan Chase only. |
The following table details the distribution of options and SARs outstanding under the LTI Plans at December 31, 2004:
| Options/SARs outstanding | Options/SARs exercisable | |||||||||||||||||||
| (in thousands) | Weighted-average | Weighted-average remaining | Weighted-average | |||||||||||||||||
| Range of exercise prices | Outstanding | exercise price | contractual life (in years) | Exercisable | exercise price | |||||||||||||||
$3.41-$20.00 |
9,715 | $ | 17.67 | 0.9 | 9,707 | $ | 17.66 | |||||||||||||
$20.01-$35.00 |
131,767 | 26.99 | 6.1 | 77,537 | 27.02 | |||||||||||||||
$35.01-$50.00 |
144,521 | 40.05 | 5.7 | 123,585 | 40.23 | |||||||||||||||
$50.01-$65.58 |
90,327 | 51.27 | 5.8 | 36,116 | 51.34 | |||||||||||||||
Total |
376,330 | $ | 37.59 | 5.8 | 246,945 | $ | 36.82 | |||||||||||||
The following table presents a summary of JPMorgan Chase’s restricted stock and RSU activity under the 1996 Plan during the last three years:
| (in thousands) | Number of restricted stock/RSUs | |||||||||||
| Year ended December 31,(a) | 2004 | 2003 | 2002 | |||||||||
Outstanding, January 1 |
85,527 | 55,886 | 48,336 | |||||||||
Granted |
32,514 | 44,552 | 24,624 | |||||||||
Bank One conversion |
15,116 | NA | NA | |||||||||
Lapsed(b) |
(43,349 | ) | (12,545 | ) | (15,203 | ) | ||||||
Forfeited |
(4,709 | ) | (2,366 | ) | (1,871 | ) | ||||||
Outstanding, December 31 |
85,099 | 85,527 | 55,886 | |||||||||
| (a) | 2004 results include six months of
awards for the combined Firm and six months of
awards for heritage JPMorgan Chase. All other
periods reflect the awards for heritage JPMorgan
Chase only. |
|
| (b) | Lapsed awards represent both restricted stock
for which restrictions have lapsed and RSUs that
have been converted into common stock. |
Restricted stock and RSUs are granted by JPMorgan Chase under the 1996 Plan at no cost to the recipient. These awards are subject to forfeiture until certain restrictions have lapsed, including continued employment for a specified period. The recipient of a share of restricted stock is entitled to voting rights and dividends on the common stock. An RSU entitles the recipient to receive a share of common stock after the applicable restrictions lapse; the
recipient is entitled to receive cash payments equivalent to any dividends paid on the underlying common stock during the period the RSU is outstanding.
The vesting of certain awards issued prior to 2002 is conditioned upon certain service requirements being met and JPMorgan Chase’s common stock reaching and sustaining target prices within a five-year performance period. During 2002, it was determined that it was no longer probable that the target stock prices related to forfeitable awards granted in 1999, 2000, and 2001 would be achieved within their respective performance periods, and accordingly, previously accrued expenses were reversed. The target stock prices for these awards range from $73.33 to $85.00. Forfeitures of the 1999 awards in 2004 equaled 1.2 million shares; and 1.2 million shares of the 2000 award were forfeited in January 2005. The 2001 awards will be forfeited in January 2006 if their stock price targets are not achieved.
Broad-based employee stock options
In January 2004, JPMorgan Chase granted a total of
6.3 million options and SARs to all eligible
full-time (75 options each) and part-time (38
options each) employees under the Value Sharing
Plan, a nonshareholder-approved plan. The exercise
price is equal to JPMorgan Chase’s common stock
price on the grant date. The options become
exercisable over various periods and generally
expire 10 years after the grant date.
| 96 | JPMorgan Chase & Co. / 2004 Annual Report |
Table of Contents
The following table presents a summary of JPMorgan Chase’s broad-based employee stock option plan and SAR activity during the past three years:
| Year ended December 31,(a) | 2004 | 2003 | 2002 | |||||||||||||||||||||
| Number of | Weighted-average | Number of | Weighted-average | Number of | Weighted-average | |||||||||||||||||||
| (in thousands) | options/SARs | exercise price | options | exercise price | options | exercise price | ||||||||||||||||||
Outstanding, January 1 |
117,822 | $ | 39.11 | 113,155 | $ | 40.62 | 87,393 | $ | 41.86 | |||||||||||||||
Granted |
6,321 | 39.96 | 12,846 | 21.87 | 32,550 | 36.85 | ||||||||||||||||||
Exercised |
(5,960 | ) | 15.26 | (2,007 | ) | 13.67 | (674 | ) | 15.01 | |||||||||||||||
Canceled |
(5,999 | ) | 39.18 | (6,172 | ) | 37.80 | (6,114 | ) | 41.14 | |||||||||||||||
Outstanding, December 31 |
112,184 | $ | 40.42 | 117,822 | $ | 39.11 | 113,155 | $ | 40.62 | |||||||||||||||
Exercisable, December 31 |
30,082 | $ | 36.33 | 36,396 | $ | 32.88 | 38,864 | $ | 31.95 | |||||||||||||||
| (a) | All awards are for heritage JPMorgan Chase employees only. |
The following table details the distribution of broad-based employee stock options and SARs outstanding at December 31, 2004:
| Options/SARs outstanding | Options/SARs exercisable | |||||||||||||||||||
| (in thousands) | Weighted-average | Weighted-average remaining | Weighted-average | |||||||||||||||||
| Range of exercise prices | Outstanding | exercise price | contractual life (in years) | Exercisable | exercise price | |||||||||||||||
$20.01-$35.00 |
17,750 | $ | 24.72 | 5.6 | 7,319 | $ | 28.79 | |||||||||||||
$35.01-$50.00 |
73,298 | 41.11 | 5.6 | 22,763 | 38.76 | |||||||||||||||
$50.01-$51.22 |
21,136 | 51.22 | 6.1 | — | — | |||||||||||||||
Total(a) |
112,184 | $ | 40.42 | 5.7 | 30,082 | $ | 36.33 | |||||||||||||
| (a) | All awards are for heritage JPMorgan Chase employees only. |
Comparison of the fair and intrinsic value measurement methods
Pre-tax employee stock-based compensation expense
related to these plans totaled $1.3 billion in 2004,
$919 million in 2003 and $590 million in 2002. In
response to the fact that the adoption of SFAS 123
eliminated the difference in the expense impact of
issuing options and restricted stock, the Firm
changed its incentive compensation policies upon the
adoption of SFAS 123 to permit employees to elect to
receive incentive awards in the form of options,
restricted stock or a combination of both. The $266
million impact of the adoption of SFAS 123 in 2003
is comprised of (i) $86 million representing the
value of stock options granted during 2003 and (ii)
$180 million representing the value of restricted
stock granted during 2003 that would have been
issuable solely in the form of stock options prior
to the adoption of SFAS 123.
The following table presents net income (after-tax) and basic and diluted earnings per share as reported, and as if all outstanding awards were accounted for at fair value:
| Year ended December 31,(a) | ||||||||||||||
| (in millions, except per share data) | 2004 | 2003 | 2002 | |||||||||||
| Net income as reported | $ | 4,466 | $ | 6,719 | $ | 1,663 | ||||||||
| Add: | Employee stock-based compensation expense originally included in reported net income | 778 | 551 | 354 | ||||||||||
| Deduct: | Employee stock-based compensation expense determined under the fair value method for all awards | (960 | ) | (863 | ) | (1,232 | ) | |||||||
| Pro forma net income | $ | 4,284 | $ | 6,407 | $ | 785 | ||||||||
| Earnings per share: | ||||||||||||||
| Basic: | As reported |
$ | 1.59 | $ | 3.32 | $ | 0.81 | |||||||
Pro forma |
1.52 | 3.16 | 0.37 | |||||||||||
| Diluted: | As reported |
$ | 1.55 | $ | 3.24 | $ | 0.80 | |||||||
Pro forma |
1.48 | 3.09 | 0.37 | |||||||||||
| (a) | 2004 results include six months of the
combined Firm’s results and six months of heritage
JPMorgan Chase results. All other periods reflect
the results of heritage JPMorgan Chase only. |
The following table presents JPMorgan Chase’s weighted-average grant-date fair values for the employee stock-based compensation awards granted, and the assumptions used to value stock options and SARs under a Black-Scholes valuation model:
| Year ended December 31,(a) | 2004 | 2003 | 2002 | |||||||||
Weighted-average grant-date fair value |
||||||||||||
Stock options: |
||||||||||||
Key employee |
$ | 13.04 | $ | 5.60 | $ | 11.57 | ||||||
Broad-based employee |
10.71 | 4.98 | 13.01 | |||||||||
Converted Bank One options |
14.05 | NA | NA | |||||||||
Restricted stock and RSUs
(all payable solely in stock) |
39.58 | 22.03 | 36.28 | |||||||||
Weighted-average annualized
stock option valuation assumptions |
||||||||||||
Risk-free interest rate |
3.44 | % | 3.19 | % | 4.61 | % | ||||||
Expected dividend yield(b) |
3.59 | 5.99 | 3.72 | |||||||||
Expected common stock price volatility |
41 | 44 | 39 | |||||||||
| Assumed weighted-average expected life of stock options (in years) | ||||||||||||
Key employee |
6.8 | 6.8 | 6.8 | |||||||||
Broad-based employee |
3.8 | 3.8 | 6.8 | |||||||||
| (a) | 2004 results include six months of the
combined Firm’s results and six months of heritage
JPMorgan Chase results. All other periods reflect
the results of heritage JPMorgan Chase only. |
|
| (b) | Based primarily on historical data at the grant dates. |
| JPMorgan Chase & Co. / 2004 Annual Report | 97 |
Table of Contents
Notes to consolidated financial statements
Note 8 – Noninterest expense
Merger costs
| Year ended December 31, (a) (in millions) | 2004 | 2003 | 2002 | |||||||||
| Expense
category Compensation |
$ | 467 | $ | — | $ | 379 | ||||||
Occupancy |
448 | — | 216 | |||||||||
Technology and communications and other |
450 | — | 615 | |||||||||
Total(b) |
$ | 1,365 | $ | — | $ | 1,210 | ||||||
| (a) | 2004 results
include six months of the combined Firm's results and six months of
heritage JPMorgan Chase results. All other periods reflect the
results of heritage JPMorgan Chase only. |
|
| (b) | With the exception of occupancy-related write-offs, all of the costs in the table require the
expenditure of cash. |
The table below shows the change in the liability balance related to the costs associated with the Bank One merger.
| Year ended December 31, (a) (in millions) | 2004 | 2003 | ||||||
Liability balance, beginning of period |
$ | — | $ | — | ||||
Recorded as merger costs |
1,365 | — | ||||||
Recorded as goodwill |
1,028 | — | ||||||
Liability utilized |
(1,441 | ) | — | |||||
Total |
$ | 952 | $ | — | ||||
| (a) | 2004 activity
includes six months of the combined Firm's activity and six months of
heritage JPMorgan Chase activity, while 2003 activity includes heritage JPMorgan Chase
only. |
Note 9 – Securities and private equity investments
Securities are classified as AFS, Held-to-maturity (“HTM”) or Trading. Trading securities are discussed in Note 3 on pages 90-91. Securities are classified as AFS when, in management’s judgment, they may be sold in response to or in anticipation of changes in market conditions, or as part of the Firm’s management of its structural interest rate risk. AFS securities are carried at fair value on the Consolidated balance sheets. Unrealized gains and losses after SFAS 133 valuation adjustments are reported as net increases or decreases to Accumulated other comprehensive income (loss). The specific identification method is used to determine realized gains and losses on AFS securities, which are included in Securities /private equity gains on the Consolidated statements of income. Securities that the Firm has the positive intent and ability to hold to maturity are classified as HTM and are carried at amortized cost on the Consolidated balance sheets.
The following table presents realized gains and losses from AFS securities and private equity gains (losses):
| Year ended December 31,(a) | ||||||||||||
| (in millions) | 2004 | 2003 | 2002 | |||||||||
Realized gains |
$ | 576 | $ | 2,123 | $ | 1,904 | ||||||
Realized losses |
(238 | ) | (677 | ) | (341 | ) | ||||||
Net realized securities gains |
338 | 1,446 | 1,563 | |||||||||
Private equity gains (losses) |
1,536 | 33 | (746 | ) | ||||||||
Total Securities/private
equity gains |
$ | 1,874 | $ | 1,479 | $ | 817 | ||||||
| (a) | 2004 results include six months of the combined Firm’s results and six months of heritage
JPMorgan Chase results. All other periods reflect the results of heritage JPMorgan Chase only. |
The amortized cost and estimated fair value of AFS and held-to-maturity securities were as follows for the dates indicated:
| 2004 | 2003(a) | |||||||||||||||||||||||||||||||
| Gross | Gross | Gross | Gross | |||||||||||||||||||||||||||||
| Amortized | unrealized | unrealized | Fair | Amortized | unrealized | unrealized | Fair | |||||||||||||||||||||||||
| December 31, (in millions) | cost | gains | losses | value | cost | gains | losses | value | ||||||||||||||||||||||||
Available-for-sale securities |
||||||||||||||||||||||||||||||||
U.S. government and federal agencies/
corporations obligations: |
||||||||||||||||||||||||||||||||
Mortgage-backed securities |
$ | 46,577 | $ | 165 | $ | 601 | $ | 46,141 | $ | 32,248 | $ | 101 | $ | 417 | $ | 31,932 | ||||||||||||||||
Collateralized mortgage obligations |
682 | 4 | 4 | 682 | 1,825 | 3 | — | 1,828 | ||||||||||||||||||||||||
U.S. treasuries |
13,621 | 7 | 222 | 13,406 | 11,511 | 13 | 168 | 11,356 | ||||||||||||||||||||||||
Agency obligations |
1,423 | 18 | 9 | 1,432 | 106 | 2 | — | 108 | ||||||||||||||||||||||||
Obligations of state and political subdivisions |
2,748 | 126 | 8 | 2,866 | 2,841 | 171 | 52 | 2,960 | ||||||||||||||||||||||||
Debt securities issued by non-U.S. governments |
7,901 | 59 | 38 | 7,922 | 7,232 | 47 | 41 | 7,238 | ||||||||||||||||||||||||
Corporate debt securities |
7,007 | 127 | 18 | 7,116 | 818 | 23 | 8 | 833 | ||||||||||||||||||||||||
Equity securities |
5,810 | 39 | 14 | 5,835 | 1,393 | 24 | 11 | 1,406 | ||||||||||||||||||||||||
Other, primarily asset-backed securities(b) |
9,052 | 25 | 75 | 9,002 | 2,448 | 61 | 102 | 2,407 | ||||||||||||||||||||||||
Total available-for-sale securities |
$ | 94,821 | $ | 570 | $ | 989 | $ | 94,402 | $ | 60,422 | $ | 445 | $ | 799 | $ | 60,068 | ||||||||||||||||
Held-to-maturity securities(c) |
||||||||||||||||||||||||||||||||
Total held-to-maturity securities |
$ | 110 | $ | 7 | $ | — | $ | 117 | $ | 176 | $ | 10 | $ | — | $ | 186 | ||||||||||||||||
| (a) | Heritage JPMorgan Chase only. |
|
| (b) | Includes collateralized mortgage obligations of private issuers, which generally have
underlying collateral consisting of obligations of U.S. government and federal agencies and
corporations. |
|
| (c) | Consists primarily of mortgage-backed securities. |
| 98 | JPMorgan Chase & Co./2004 Annual Report |
Table of Contents
The following table presents the fair value and unrealized losses for AFS securities by aging category:
| Securities with unrealized losses | ||||||||||||||||||||||||
| Less than 12 months | 12 months or more | Total | ||||||||||||||||||||||
| Gross | Gross | Total | Gross | |||||||||||||||||||||
| Fair | unrealized | Fair | unrealized | Fair | unrealized | |||||||||||||||||||
| December 31, 2004 (in millions) | value | losses | value | losses | value | losses | ||||||||||||||||||
Available-for-sale securities |
||||||||||||||||||||||||
U.S. government and federal agencies/corporations obligations: |
||||||||||||||||||||||||
Mortgage-backed securities |
$ | 33,806 | $ | 274 | $ | 11,884 | $ | 327 | $ | 45,690 | $ | 601 | ||||||||||||
Collateralized mortgage obligations |
278 | 4 | 2 | — | 280 | 4 | ||||||||||||||||||
U.S. treasuries |
10,186 | 154 | 940 | 68 | 11,126 | 222 | ||||||||||||||||||
Agency obligations |
1,303 | 9 | 3 | — | 1,306 | 9 | ||||||||||||||||||
Obligations of state and political subdivisions |
678 | 6 | 96 | 2 | 774 | 8 | ||||||||||||||||||
Debt securities issued by non-U.S. governments |
3,395 | 17 | 624 | 21 | 4,019 | 38 | ||||||||||||||||||
Corporate debt securities |
1,103 | 13 | 125 | 5 | 1,228 | 18 | ||||||||||||||||||
Equity securities |
1,804 | 14 | 23 | — | 1,827 | 14 | ||||||||||||||||||
Other, primarily asset-backed securities |
1,896 | 41 | 321 | 34 | 2,217 | 75 | ||||||||||||||||||
Total securities with unrealized losses |
$ | 54,449 | $ | 532 | $ | 14,018 | $ | 457 | $ | 68,467 | $ | 989 | ||||||||||||
Impairment is evaluated considering numerous factors, and their relative significance varies case to case. Factors considered include the length of time and extent to which the market value has been less than cost; the financial condition and near-term prospects of the issuer; and the intent and ability to retain the security in order to allow for an anticipated recovery in market value. If, based on the analysis, it is determined that the impairment is other-than-temporary, the security is written down to fair value, and a loss is recognized through earnings.
Included in the $989 million of gross unrealized losses on AFS securities at December 31, 2004, was $457 million of unrealized losses that have existed for a period greater than 12 months. These securities are predominately rated AAA and the unrealized losses are due to overall increases in market interest rates and not due to underlying credit concerns of the issuers. Substantially all of the securities with unrealized losses aged greater than 12 months have a market value at December 31, 2004, that is within 3% of their amortized cost basis.
The Firm believes that all aged unrealized losses, as described above, are expected to be recovered within a reasonable time through a typical interest rate cycle. Accordingly, the Firm has concluded that none of the securities in its investment portfolios are other-than-temporarily impaired at December 31, 2004.
In calculating the effective yield for mortgage-backed securities (“MBS”) and collateralized mortgage obligations (“CMO”), JPMorgan Chase includes the effect of principal prepayments. Management regularly performs simulation testing to determine the impact that market conditions would have on its MBS and CMO portfolios. MBSs and CMOs that management believes have prepayment risk are included in the AFS portfolio and are reported at fair value.
The following table presents the amortized cost, estimated fair value and average yield at
December 31, 2004, of JPMorgan Chase’s AFS and HTM securities by contractual maturity:
| Available-for-sale securities | Held-to-maturity securities | |||||||||||||||||||||||
| Maturity schedule of securities | Amortized | Fair | Average | Amortized | Fair | Average | ||||||||||||||||||
| December 31, 2004 (in millions) | cost | value | yield(a) | cost | value | yield(a) | ||||||||||||||||||
Due in one year or less |
$ | 8,641 | $ | 8,644 | 2.44 | % | $ | — | $ | — | — | % | ||||||||||||
Due after one year through five years |
19,640 | 19,600 | 3.18 | — | — | — | ||||||||||||||||||
Due after five years through 10 years |
9,270 | 9,278 | 3.77 | 16 | 16 | 6.96 | ||||||||||||||||||
Due after 10 years(b) |
57,270 | 56,880 | 4.48 | 94 | 101 | 6.88 | ||||||||||||||||||
Total securities |
$ | 94,821 | $ | 94,402 | 3.95 | % | $ | 110 | $ | 117 | 6.89 | % | ||||||||||||
| (a) | The average yield is based on amortized cost balances at year-end. Yields are
derived by dividing interest income by total amortized cost. Taxable-equivalent yields are used
where applicable. |
|
| (b) | Includes securities with no stated maturity. Substantially all of JPMorgan Chase’s MBSs
and CMOs are due in 10 years or more based on contractual maturity. The estimated
duration, which reflects
anticipated future prepayments based on a consensus of dealers in the market, is
approximately four years for MBSs and CMOs. |
| JPMorgan Chase & Co./2004 Annual Report | 99 |
Table of Contents
Notes to consolidated financial statements
Private equity investments are primarily held by the Private Equity business within Corporate (which includes JPMorgan Partners, reported as a stand-alone business segment prior to the Merger, and Bank One’s ONE Equity Partners). The Private Equity business invests in buyouts, growth equity and venture opportunities in the normal course of business. These investments are accounted for under investment company guidelines. Accordingly, these investments, irrespective of the percentage of equity ownership interest held by Private Equity, are carried on the Consolidated balance sheets at fair value. Realized and unrealized gains and losses arising from changes in value are reported in Securities/private equity gains in the Consolidated statements of income in the period that the gains or losses occur.
Private investments are initially valued based on cost. The carrying values of private investments are adjusted from cost to reflect both positive and negative changes evidenced by financing events with third-party capital providers. In addition, these investments are subject to ongoing impairment reviews by Private Equity’s senior investment professionals. A variety of factors are reviewed and monitored to assess impairment — including, but not limited to, operating performance and future expectations, comparable industry valuations of public companies, changes in market outlook and changes in the third-party financing environment. The Valuation Control Group within the Finance area is responsible for reviewing the accuracy of the carrying values of private investments held by Private Equity.
Private Equity also holds publicly-held equity investments, generally obtained through the initial public offering of private equity investments. These investments are marked to market at the quoted public value. To determine the carrying values of these investments, Private Equity incorporates the use of discounts to take into account the fact that it cannot immediately realize or risk manage the quoted public values as a result of regulatory, corporate and/or contractual sales restrictions imposed on these holdings.
The following table presents the carrying value and cost of the Private Equity investment portfolio for the dates indicated:
| 2004 | 2003(a) | |||||||||||||||
| Carrying | Carrying | |||||||||||||||
| December 31, (in millions) | value | Cost | value | Cost | ||||||||||||
Total private
equity investments |
$ | 7,735 | $ | 9,103 | $ | 7,250 | $ | 9,147 | ||||||||
| (a) | Heritage JPMorgan Chase only. |
Note 10 — Securities financing activities
JPMorgan Chase enters into resale agreements, repurchase agreements, securities borrowed transactions and securities loaned transactions primarily to finance the Firm’s inventory positions, acquire securities to cover short positions and settle other securities obligations. The Firm also enters into these transactions to accommodate customers’ needs.
Securities purchased under resale agreements (“resale agreements”) and securities sold under repurchase agreements (“repurchase agreements”) are generally treated as collateralized financing transactions and are carried on the Consolidated balance sheets at the amounts the securities will be subsequently sold or repurchased, plus accrued interest. Where appropriate, resale and repurchase agreements with the same counterparty are reported on a net basis in accordance with FIN 41. JPMorgan Chase takes possession of securities purchased under resale agreements. On a daily basis, JPMorgan Chase monitors the market value of the underlying collateral received from its counterparties, consisting primarily of U.S. and non-U.S. government and agency securities, and requests additional collateral from its counterparties when necessary.
Transactions similar to financing activities that do not meet the SFAS 140 definition of a repurchase agreement are accounted for as “buys” and “sells” rather than financing transactions. These transactions are accounted for as a purchase (sale) of the underlying securities with a forward obligation to sell (purchase) the securities. The forward purchase (sale) obligation, a derivative, is recorded on the Consolidated balance sheets at its fair value, with changes in fair value recorded in Trading revenue. Notional amounts of transactions accounted for as purchases under SFAS 140 were $6 billion at December 31, 2004, and $15 billion at December 31, 2003, respectively. Notional amounts of transactions accounted for as sales under SFAS 140 were $20 billion and $8 billion at December 31, 2004, and December 31, 2003, respectively. Based on the short-term duration of these contracts, the unrealized gain or loss is insignificant.
Securities borrowed and securities lent are recorded at the amount of cash collateral advanced or received. Securities borrowed consist primarily of government and equity securities. JPMorgan Chase monitors the market value of the securities borrowed and lent on a daily basis and calls for additional collateral when appropriate. Fees received or paid are recorded in Interest income or Interest expense.
| December 31, (in millions) | 2004 | 2003(a) | ||||||
Securities purchased under resale agreements |
$ | 94,076 | $ | 62,801 | ||||
Securities borrowed |
47,428 | 41,834 | ||||||
Securities sold under repurchase agreements |
$ | 105,912 | $ | 103,610 | ||||
Securities loaned |
6,435 | 4,260 | ||||||
| (a) | Heritage JPMorgan Chase only. |
JPMorgan Chase pledges certain financial instruments it owns to collateralize repurchase agreements and other securities financings. Pledged securities that can be sold or repledged by the secured party are identified as financial instruments owned (pledged to various parties) on the Consolidated balance sheets.
At December 31, 2004, the Firm had received securities as collateral that can be repledged, delivered or otherwise used with a fair value of approximately $252 billion. This collateral was generally obtained under resale or securities borrowing agreements. Of these securities, approximately $238 billion were repledged, delivered or otherwise used, generally as collateral under repurchase agreements, securities lending agreements or to cover short sales.
| 100 | JPMorgan Chase & Co./2004 Annual Report |
Table of Contents
Note 11 — Loans
Loans are reported at the principal amount outstanding, net of the Allowance for loan losses, unearned income and any net deferred loan fees. Loans held for sale are carried at the lower of cost or fair value, with valuation changes recorded in noninterest revenue. Loans are classified as “trading” where positions are bought and sold to make profits from short-term movements in price. Loans held for trading purposes are included in Trading assets and are carried at fair value, with the gains and losses included in Trading revenue. Interest income is recognized using the interest method, or on a basis approximating a level rate of return over the term of the loan.
Nonaccrual loans are those on which the accrual of interest is discontinued. Loans (other than certain consumer loans discussed below) are placed on nonaccrual status immediately if, in the opinion of management, full payment of principal or interest is in doubt, or when principal or interest is 90 days or more past due and collateral, if any, is insufficient to cover principal and interest. Interest accrued but not collected at the date a loan is placed on nonaccrual status is reversed against Interest income. In addition, the amortization of net deferred loan fees is suspended. Interest income on nonaccrual loans is recognized only to the extent it is received in cash. However, where there is doubt regarding the ultimate collectibility of loan principal, all cash thereafter received is applied to reduce the carrying value of the loan. Loans are restored to accrual status only when interest and principal payments are brought current and future payments are reasonably assured.
Consumer loans are generally charged to the Allowance for loan losses upon reaching specified stages of delinquency, in accordance with the Federal Financial Institutions Examination Council (“FFIEC”) policy. For example, credit card loans are charged off by the end of the month in which the account becomes 180 days past due or within 60 days from receiving notification of the filing of bankruptcy, whichever is earlier. Residential mortgage products are generally charged off to net realizable value at 180 days past due. Other consumer products are generally charged off (to net realizable value if collateralized) at 120 days past due. Accrued interest on residential mortgage products, auto & education financings and certain other consumer loans are accounted for in accordance with the nonaccrual loan policy discussed above. Interest and fees related to credit card loans continue to accrue until the loan is charged-off or paid. Accrued interest on all other loans is generally reversed against interest income when the consumer loan is charged off. A collateralized loan is considered an in-substance foreclosure and is reclassified to assets acquired in loan satisfactions, within Other assets, only when JPMorgan Chase has taken physical possession of the collateral. This is regardless of whether formal foreclosure proceedings have taken place.
The composition of the loan portfolio at each of the dates indicated was as follows:
| December 31, (in millions) | 2004 | 2003 | (a) | |||||
U.S. wholesale loans: |
||||||||
Commercial and industrial |
$ | 60,223 | $ | 30,748 | ||||
Real estate |
13,038 | 2,775 | ||||||
Financial institutions |
14,060 | 8,346 | ||||||
Lease financing receivables |
4,043 | 606 | ||||||
Other |
8,504 | 1,850 | ||||||
Total U.S. wholesale loans |
99,868 | 44,325 | ||||||
Non-U.S. wholesale loans: |
||||||||
Commercial and industrial |
25,115 | 22,916 | ||||||
Real estate |
1,747 | 1,819 | ||||||
Financial institutions |
7,269 | 6,269 | ||||||
Lease financing receivables |
1,068 | 90 | ||||||
Total non-U.S. wholesale loans |
35,199 | 31,094 | ||||||
Total wholesale loans:(b) |
||||||||
Commercial and industrial |
85,338 | 53,664 | ||||||
Real estate(c) |
14,785 | 4,594 | ||||||
Financial institutions |
21,329 | 14,615 | ||||||
Lease financing receivables |
5,111 | 696 | ||||||
Other |
8,504 | 1,850 | ||||||
Total wholesale loans |
135,067 | 75,419 | ||||||
Total consumer loans:(d) |
||||||||
Consumer real estate
|
||||||||
Home finance — home equity & other |
67,837 | 24,179 | ||||||
Home finance — mortgage |
56,816 | 50,381 | ||||||
Total Home finance |
124,653 | 74,560 | ||||||
Auto & education finance |
62,712 | 43,157 | ||||||
Consumer & small business and other |
15,107 | 4,204 | ||||||
Credit card receivables(e) |
64,575 | 17,426 | ||||||
Total consumer loans |
267,047 | 139,347 | ||||||
Total loans(f)(g)(h) |
$ | 402,114 | $ | 214,766 | ||||
| (a) | Heritage JPMorgan Chase only. |
|
| (b) | Includes Investment Bank, Commercial Banking, Treasury & Securities Services and Asset &
Wealth Management. |
|
| (c) | Represents credits extended for real estate-related purposes to borrowers who are primarily
in the real estate development or investment businesses and for which the primary repayment is from the sale, lease, management, operations or refinancing of the property. |
|
| (d) | Includes Retail Financial Services and Card Services. |
|
| (e) |
Includes billed finance charges and fees net of an allowance for uncollectible amounts. |
|
| (f) | Loans are presented net of unearned income of $4.1 billion and $1.3 billion at December |
|
31, 2004, and December 31, 2003, respectively. |
||
| (g) | Includes loans held for sale (principally mortgage-related loans) of $25.7 billion at |
|
December 31, 2004, and $20.8 billion at December 31, 2003. |
||
| (h) | Amounts are presented gross of the Allowance for loan losses. |
| JPMorgan Chase & Co./2004 Annual Report | 101 |
Table of Contents
Notes to consolidated financial statements
The following table reflects information about the Firm’s loans held for sale, principally mortgage-related:
| Year ended December 31, (in millions)(a) | 2004 | 2003 | 2002 | |||||||||
| Net gains on sales of loans held for sale | $ | 368 | $ | 933 | $ | 754 | ||||||
Lower of cost or market adjustments |
39 | 26 | (36 | ) | ||||||||
| (a) | 2004 results include six months of the combined Firm’s results and six months of heritage
JPMorgan Chase results. All other periods reflect the results of heritage JPMorgan Chase only. |
Impaired loans
JPMorgan Chase accounts for and discloses nonaccrual loans as impaired loans and recognizes their interest income as discussed previously for nonaccrual loans. The Firm excludes from impaired loans its small-balance, homogeneous consumer loans; loans carried at fair value or the lower of cost or fair value; debt securities; and leases.
The table below sets forth information about JPMorgan Chase’s impaired loans. The Firm primarily uses the discounted cash flow method for valuing impaired loans:
| December 31, (in millions) | 2004 | 2003 | (a) | |||||||||
| Impaired loans with an allowance | $ | 1,496 | $ | 1,597 | ||||||||
Impaired
loans without an
allowance(b) |
284 | 406 | ||||||||||
Total impaired loans
|
$ | 1,780 | $ | 2,003 | ||||||||
Allowance for impaired loans under SFAS 114(c)
|
$ | 521 | $ | 595 | ||||||||
Average balance of impaired loans during the year
|
1,883 | 2,969 | ||||||||||
Interest income recognized on impaired
loans during the year |
8 | 4 | ||||||||||
| (a) | Heritage JPMorgan Chase only. |
|
| (b) | When the discounted cash flows, collateral value or market price equals or exceeds the
carrying value of the loan, then the loan does not require an allowance under SFAS 114. |
|
| (c) | The allowance for impaired loans under SFAS 114 is included in JPMorgan Chase’s
Allowance for loan losses. |
Note 12 — Allowance for credit losses
JPMorgan Chase’s Allowance for loan losses covers the wholesale (primarily risk-rated) and consumer (primarily scored) loan portfolios and represents management’s estimate of probable credit losses inherent in the Firm’s loan portfolio. Management also computes an Allowance for wholesale lending-related commitments using a methodology similar to that used for the wholesale loans.
As a result of the Merger, management modified its methodology for determining the Provision for credit losses for the combined Firm. The effect of conforming methodologies in 2004 was a decrease in the consumer allowance of $254 million and a decrease in the wholesale allowance (including both funded loans and lending-related commitments) of $330 million. In addition, the Bank One seller’s interest in credit card securitizations was decertificated; this resulted in an increase to the provision for loan losses of approximately $1.4 billion (pre-tax) in 2004.
The Allowance for loan losses consists of two components: asset-specific loss and formula-based loss. Within the formula-based loss is a statistical calculation and an adjustment to the statistical calculation.
The asset-specific loss component relates to provisions for losses on loans considered impaired and measured pursuant to SFAS 114. An allowance is established when the discounted cash flows (or collateral value or observable market price) of the loan are lower than the carrying value of that loan. To compute the asset-specific loss component of the allowance larger impaired loans are evaluated individually, and smaller impaired loans are evaluated as a pool using historical loss experience for the respective class of assets.
The formula-based loss component covers performing wholesale and consumer loans and is the product of a statistical calculation, as well as adjustments to such calculation. These adjustments take into consideration model imprecision, external factors and economic events that have occurred but are not yet reflected in the factors used to derive the statistical calculation.
The statistical calculation is the product of probability of default and loss given default. For risk-rated loans (generally loans originated by the wholesale lines of business), these factors are differentiated by risk rating and maturity. For scored loans (generally loans originated by the consumer lines of business), loss is primarily determined by applying statistical loss factors and other risk indicators to pools of loans by asset type. Adjustments to the statistical calculation for the risk-rated portfolios are determined by creating estimated ranges using historical experience of both loss given default and probability of default. Factors related to concentrated and deteriorating industries are also incorporated into the calculation where relevant. Adjustments to the statistical calculation for the scored loan portfolios are accomplished in part by analyzing the historical loss experience for each major product segment. The estimated ranges and the determination of the appropriate point within the range are based upon management’s view of uncertainties that relate to current macroeconomic and political conditions, quality of underwriting standards, and other relevant internal and external factors affecting the credit quality of the portfolio.
The Allowance for lending-related commitments represents management’s estimate of probable credit losses inherent in the Firm’s process of extending credit. Management establishes an asset-specific allowance for lending-related commitments that are considered impaired and computes a formula-based allowance for performing wholesale lending-related commitments. These are computed using a methodology similar to that used for the wholesale loan portfolio, modified for expected maturities and probabilities of drawdown.
At least quarterly, the allowance for credit losses is reviewed by the Chief Risk Officer and the Deputy Chief Risk Officer of the Firm and is discussed with a risk subgroup of the Operating Committee, relative to the risk profile of the Firm’s credit portfolio and current economic conditions. As of December 31, 2004, JPMorgan Chase deemed the allowance for credit losses to be appropriate (i.e., sufficient to absorb losses that are inherent in the portfolio, including those not yet identifiable).
| 102 | JPMorgan Chase & Co./2004 Annual Report |
Table of Contents
JPMorgan Chase maintains an Allowance for credit losses as follows:
| Reported in: |
||||
Allowance for credit losses on: |
Balance sheet | Income statement | ||
Loans
|
Allowance for loan losses | Provision for credit losses | ||
Lending-related commitments
|
Other liabilities | Provision for credit losses | ||
The table below summarizes the changes in the Allowance for loan losses:
| December 31,(a) (in millions) | 2004 | 2003 | ||||||
Allowance for loan losses at January 1 |
$ | 4,523 | $ | 5,350 | ||||
Addition resulting from the Merger, July 1, 2004 |
3,123 | — | ||||||
Gross charge-offs(b) |
(3,805 | ) | (2,818 | ) | ||||
Gross recoveries |
706 | 546 | ||||||
Net charge-offs |
(3,099 | ) | (2,272 | ) | ||||
Provision for loan losses: |
||||||||
Provision excluding
accounting policy conformity |
1,798 | 1,579 | ||||||
Accounting policy conformity(c) |
1,085 | — | ||||||
Total Provision for loan losses |
2,883 | 1,579 | ||||||
Other(d) |
(110 | ) | (134 | ) | ||||
Allowance for loan losses at December 31(e) |
$ | 7,320 | $ | 4,523 | ||||
| (a) | 2004 activity includes six months of the
combined Firm’s activity and six months of heritage
JPMorgan Chase activity, while 2003 activity
includes heritage JPMorgan Chase only. |
|
| (b) | Includes
$406 million related to the Manufactured Home Loan
portfolio in the fourth quarter of 2004. |
|
| (c) | Represents an
increase of approximately $1.4 billion as a
result of the decertification of heritage Bank
One’s seller’s interest in credit card
securitizations, partially offset by a reduction
of $357 million to conform provision
methodologies. |
|
| (d) | Primarily represents the transfer of the
allowance for accrued interest and fees on
reported credit card loans.
|
|
| (e) |
2004 includes $469 million of asset-specific loss and
$6.8 billion of formula-based loss.
Included within the formula-based loss is $4.8
billion related to statistical calculation and
an adjustment to the statistical calculation of
$2.0 billion. |
The table below summarizes the changes in the Allowance for lending-related commitments:
| December 31,(a) (in millions) | 2004 | 2003 | ||||||
Allowance for lending-related commitments
at January 1 |
$ | 324 | $ | 363 | ||||
Addition resulting from the Merger, July 1, 2004 |
508 | — | ||||||
Provision for lending-related commitments: |
||||||||
Provision excluding
accounting policy conformity |
(112 | ) | (39 | ) | ||||
Accounting policy conformity(b) |
(227 | ) | — | |||||
Total Provision for lending-related commitments |
(339 | ) | (39 | ) | ||||
Other |
(1 | ) | — | |||||
Allowance for lending-related commitments
at December 31(c) |
$ | 492 | $ | 324 | ||||
| (a) | 2004 activity includes six months of the
combined Firm’s activity and six months of heritage
JPMorgan Chase activity, while 2003 activity
includes heritage JPMorgan Chase only. |
|
| (b) | Represents a reduction of $227 million to conform
provision methodologies in the wholesale portfolio. |
|
| (c) | 2004 includes $130 million of asset-specific loss and $362 million of formula-based loss. Note: The formula-based loss for lending-related commitments is based on statistical calculation. There is no adjustment to the statistical calculation for lending-related commitments. |
Note 13 — Loan securitizations
JPMorgan Chase securitizes, sells and services various consumer loans, such as consumer real estate, credit card and automobile loans, as well as certain wholesale loans (primarily real estate) originated by the Investment Bank. In addition, the Investment Bank purchases, packages and securitizes commercial and consumer loans. All IB activity is collectively referred to as Wholesale activities below. Interests in the sold and securitized loans may be retained as described below.
The Firm records a loan securitization as a sale when the transferred loans are legally isolated from the Firm’s creditors and the accounting criteria for a sale are met. Gains or losses recorded on loan securitizations depend, in part, on the carrying amount of the loans sold and are allocated between the loans sold and the retained interests, based on their relative fair values at the date of sale. Since quoted market prices are generally not available, the Firm usually estimates the fair value of these retained interests by determining the present value of future expected cash flows using modeling techniques. Such models incorporate management’s best estimates of key variables, such as expected credit losses, prepayment speeds and the discount rates appropriate for the risks involved. Gains on securitizations are reported in noninterest revenue. Retained interests that are subject to prepayment risk, such that JPMorgan Chase may not recover substantially all of its investment, are recorded at fair value; subsequent adjustments are reflected in Other comprehensive income or in earnings, if the fair value of the retained interest has declined below its carrying amount and such decline has been determined to be other-than-temporary.
JPMorgan Chase-sponsored securitizations utilize SPEs as part of the securitization process. These SPEs are structured to meet the definition of a QSPE (as discussed in Note 1 on page 88 of this Annual Report); accordingly, the assets and liabilities of securitization-related QSPEs are not reflected in the Firm’s Consolidated balance sheets (except for retained interests, as described below) but are included on the balance sheet of the QSPE purchasing the assets. Assets held by securitization-related SPEs as of December 31, 2004 and 2003, were as follows:
| December 31, (in billions) | 2004 | 2003 | (a) | |||||
Credit card receivables |
$ | 106.3 | $ | 42.6 | ||||
Residential mortgage receivables |
19.1 | 21.1 | ||||||
Wholesale activities |
44.8 | 33.8 | ||||||
Automobile loans |
4.9 | 6.5 | ||||||
Total |
$ | 175.1 | $ | 104.0 | ||||
| (a) | Heritage JPMorgan Chase only. |
Interests in the securitized loans are generally retained by the Firm in the form of senior or subordinated interest-only strips, subordinated tranches, escrow accounts and servicing rights, and they are primarily recorded in Other assets. In addition, credit card securitization trusts require the Firm to maintain a minimum undivided interest in the trusts, representing the Firm’s interests in the receivables transferred to the trust that have not been securitized. These interests are not represented by security certificates. The Firm’s undivided interests are carried at historical cost and are classified in Loans.
JPMorgan Chase retains servicing responsibilities for all residential mortgage, credit card and automobile loan securitizations and for certain wholesale activity securitizations it sponsors, and receives annual servicing fees based
| JPMorgan Chase & Co./2004 Annual Report | 103 |
Table of Contents
Notes to consolidated financial statements
on the securitized loan balance plus certain ancillary fees. The Firm also retains the right to service the residential mortgage loans it sells in connection with mortgage-backed securities transactions with the Government National Mortgage Association (“GNMA”), Federal National Mortgage Association (“FNMA”) and Federal Home Loan Mortgage Corporation (“Freddie Mac”). For a discussion of mortgage servicing rights, see Note 15 on pages 109–111 of this Annual Report.
The following table summarizes new securitization transactions that were completed during 2004 and 2003, the resulting gains arising from such securitizations, certain cash flows received from such securitizations, and the key economic assumptions used in measuring the retained interests, as of the dates of such sales:
| Year ended December 31,(a) | 2004 | 2003 | ||||||||||||||||||||||||||||||
| Wholesale | Wholesale | |||||||||||||||||||||||||||||||
| (in millions) | Mortgage | Credit card | Automobile | activities(d) | Mortgage | Credit card | Automobile | activities | ||||||||||||||||||||||||
Principal securitized |
$ | 6,529 | $ | 8,850 | $ | 1,600 | $ | 8,756 | $ | 13,270 | $ | 8,823 | $ | 4,510 | $ | 5,386 | ||||||||||||||||
Pre-tax gains (losses) |
47 | 52 | (3 | ) | 135 | 168 | 44 | 13 | 107 | |||||||||||||||||||||||
Cash flow information: |
||||||||||||||||||||||||||||||||
Proceeds from securitizations |
$ | 6,608 | $ | 8,850 | $ | 1,597 | $ | 8,430 | $ | 13,540 | $ | 8,823 | $ | 4,503 | $ | 5,493 | ||||||||||||||||
Servicing fees collected |
12 | 69 | 1 | 3 | 20 | 79 | 15 | 2 | ||||||||||||||||||||||||
Other cash flows received |
25 | 225 | — | 16 | 2 | 216 | 12 | 8 | ||||||||||||||||||||||||
Proceeds from collections reinvested in revolving securitizations |
— | 110,697 | — | — | — | 58,199 | — | — | ||||||||||||||||||||||||
Key assumptions (rates per annum): |
||||||||||||||||||||||||||||||||
Prepayment rate(b) |
23.8–37.6 | % | 15.5–16.7 | % | 1.5 | % | 17.0–50.0 | % | 10.1–36.2 | % | 8.1–16.5 | % | 1.5–1.6 | % | 50.0 | % | ||||||||||||||||
| CPR | PPR | ABS | CPR | PPR | ABS | |||||||||||||||||||||||||||
Weighted-average life (in years) |
1.9–3.0 | 0.5–0.6 | 1.8 | 2.0–4.0 | 2.0–4.6 | 0.6–1.0 | 1.7–1.8 | 1.3–5.2 | ||||||||||||||||||||||||
Expected credit losses |
1.0–2.3 | % | 5.5–5.8 | % | 0.6 | % | 0.0–3.0 | %(c) | 0.0–2.5 | %(c) | 5.5–8.0 | % | 0.5–0.6 | % | 0.0 | %(c) | ||||||||||||||||
Discount rate |
15.0–30.0 | % | 12.0 | % | 4.1 | % | 0.6–5.0 | % | 13.0–30.0 | % | 12.0 | % | 3.9–4.5 | % | 1.0–5.0 | % | ||||||||||||||||
| (a) | 2004 results include six months of the combined Firm’s results and six months of heritage
JPMorgan Chase results. All other periods reflect the results of heritage JPMorgan Chase only. |
|
| (b) | CPR: constant prepayment rate; ABS: absolute prepayment speed; PPR: principal payment rate. |
|
| (c) | Expected credit losses for prime residential mortgage and certain wholesale securitizations are
minimal and are incorporated into other assumptions. |
|
| (d) | Wholesale activities consist of wholesale loans (primarily real estate) originated by the
Investment Bank as well as $1.8 billion of consumer loans purchased from the market, packaged and
securitized by the Investment Bank. |
In addition to securitization transactions, the Firm sold residential mortgage loans totaling $65.7 billion and $123.2 billion during 2004 and 2003, respectively, primarily as GNMA, FNMA and Freddie Mac mortgage-backed securities; these sales resulted in pre-tax gains of $58.1 million and $564.3 million, respectively.
At both December 31, 2004 and 2003, the Firm had, with respect to its credit card master trusts, $35.2 billion and $7.3 billion, respectively, related to its undivided interest, and $2.1 billion and $1.1 billion, respectively, related to its subordinated interest in accrued interest and fees on the securitized receivables, net of an allowance for uncollectible amounts. Credit card securitization trusts require the Firm to maintain a minimum undivided interest of 4% to 7% of the principal receivables in the trusts. The Firm maintained an average undivided interest in its principal receivables in the trusts of approximately 23% and 17% for 2004 and 2003, respectively.
The Firm also maintains escrow accounts up to predetermined limits for some of its credit card and automobile securitizations, in the unlikely event of deficiencies in cash flows owed to investors. The amounts available in such escrow accounts are recorded in Other assets and, as of December 31, 2004, amounted to $395 million and $132 million for credit card and automobile securitizations, respectively; as of December 31, 2003, these amounts were $456 million and $137 million for credit card and automobile securitizations, respectively.
The table below summarizes other retained securitization interests, which are primarily subordinated or residual interests and are carried at fair value on the Firm’s Consolidated balance sheets:
| December 31, (in millions) | 2004 | 2003 | (a) | |||||
Residential mortgage(b) |
$ | 433 | $ | 570 | ||||
Credit card(b) |
494 | 193 | ||||||
Automobile(b) |
85 | 151 | ||||||
Wholesale activities |
23 | 34 | ||||||
Total |
$ | 1,035 | $ | 948 | ||||
| (a) | Heritage JPMorgan Chase only. |
|
| (b) | Pre-tax unrealized gains (losses) recorded in
Stockholders’ equity that relate to retained
securitization interests totaled $118 million and
$155 million for Residential mortgage; $(3) million
and $11 million for Credit cards; and $11 million
and $6 million for Automobile at December 31, 2004
and 2003, respectively. |
| 104 | JPMorgan Chase & Co. / 2004 Annual Report |
Table of Contents
The table below outlines the key economic assumptions used to determine the fair value of the remaining retained interests at December 31, 2004 and 2003, respectively; and the sensitivities to those fair values to immediate 10% and 20% adverse changes in those assumptions:
| December 31, 2004 (in millions) | Mortgage | Credit card | Automobile | Wholesale activities | ||||||||||||
Weighted-average life (in years) |
0.8–3.4 | 0.5–1.0 | 1.3 | 0.2–4.0 | ||||||||||||
Prepayment rate |
15.1–37.1 | % CPR | 8.3–16.7 | % PPR | 1.4 | % ABS | 0.0–50.0 | %(b) | ||||||||
Impact of 10% adverse change |
$ | (5 | ) | $ | (34 | ) | $ | (6 | ) | $ | (1 | ) | ||||
Impact of 20% adverse change |
(8 | ) | (69 | ) | (13 | ) | (1 | ) | ||||||||
Loss assumption |
0.0–5.0% | (c) | 5.7–8.4 | % | 0.7 | % | 0.0–3.0 | %(c) | ||||||||
Impact of 10% adverse change |
$ | (17 | ) | $ | (144 | ) | $ | (4 | ) | $ | — | |||||
Impact of 20% adverse change |
(34 | ) | (280 | ) | (8 | ) | — | |||||||||
Discount rate |
13.0–30.0% | (d) | 4.9–12.0 | % | 5.5 | % | 1.0–22.9 | % | ||||||||
Impact of 10% adverse change |
$ | (9 | ) | $ | (2 | ) | $ | (1 | ) | $ | — | |||||
Impact of 20% adverse change |
(18 | ) | (4 | ) | (2 | ) | — | |||||||||
| December 31, 2003 (in millions)(a) | Mortgage | Credit card | Automobile | Wholesale activities | ||||||||||||
Weighted-average life (in years) |
1.4–2.7 | 0.4–1.3 | 1.5 | 0.6–5.9 | ||||||||||||
Prepayment rate |
29.0–31.7 | % CPR | 8.1–15.1 | % PPR | 1.5 | % ABS | 0.0–50.0 | %(b) | ||||||||
Impact of 10% adverse change |
$ | (17 | ) | $ | (7 | ) | $ | (10 | ) | $ | (1 | ) | ||||
Impact of 20% adverse change |
(31 | ) | (13 | ) | (19 | ) | (2 | ) | ||||||||
Loss assumption |
0.0–4.0 | %(c) | 5.5–8.0 | % | 0.6 | % | 0.0 | %(c) | ||||||||
Impact of 10% adverse change |
$ | (28 | ) | $ | (21 | ) | $ | (6 | ) | $ | — | |||||
Impact of 20% adverse change |
(57 | ) | (41 | ) | (12 | ) | — | |||||||||
Discount rate |
13.0–30.0 | %(d) | 8.3–12.0 | % | 4.4 | % | 5.0–20.9 | % | ||||||||
Impact of 10% adverse change |
$ | (14 | ) | $ | (1 | ) | $ | (1 | ) | $ | (1 | ) | ||||
Impact of 20% adverse change |
(27 | ) | (3 | ) | (2 | ) | (2 | ) | ||||||||
| (a) | Heritage JPMorgan Chase only. |
|
| (b) | Prepayment risk on certain wholesale retained interests are minimal and are incorporated into
other assumptions. |
|
| (c) | Expected credit losses for prime residential mortgage and certain wholesale securitizations are
minimal and are incorporated into other assumptions. |
|
| (d) | The Firm sells certain residual interests from sub-prime mortgage securitizations via Net
Interest Margin (“NIM”) securitizations and retains residuals interests in these NIM transactions,
which are valued using a 30% discount rate. |
The sensitivity analysis in the preceding table is hypothetical. Changes in fair value based on a 10% or 20% variation in assumptions generally cannot be extrapolated easily, because the relationship of the change in the assumptions to the change in fair value may not be linear. Also, in this table, the effect that a change in a particular assumption may have on the fair value is
calculated without changing any other assumption. In reality, changes in one factor may result in changes in another assumption, which might counteract or magnify the sensitivities.
Expected static-pool net credit losses include actual incurred losses plus projected net credit losses, divided by the original balance of the outstandings comprising the securitization pool.
The table below displays the expected static-pool net credit losses for 2004, 2003 and 2002, based on securitizations occurring in that year:
| Loans securitized in:(a) | ||||||||||||||||||||||||
| 2004 | 2003(b) | 2002(b) | ||||||||||||||||||||||
| Mortgage | Automobile | Mortgage | Automobile | Mortgage | Automobile | |||||||||||||||||||
December 31, 2004 |
0.0–3.3 | % | 1.1 | % | 0.0–2.1 | % | 0.9 | % | 0.0–2.4 | % | 0.8 | % | ||||||||||||
December 31, 2003 |
NA | NA | 0.0–3.6 | 0.9 | 0.0–2.8 | 0.8 | ||||||||||||||||||
December 31, 2002 |
NA | NA | NA | NA | 0.1–3.7 | 0.9 | ||||||||||||||||||
| (a) | Static-pool losses not applicable to
credit card securitizations, due to their revolving
structure. |
|
| (b) | Heritage JPMorgan Chase only. |
JPMorgan Chase & Co. / 2004 Annual Report |
105 |
Table of Contents
Notes to consolidated financial statements
The table below presents information about delinquencies, net credit losses and components of reported and securitized financial assets at December 31, 2004 and 2003:
| Nonaccrual and 90 days or | Net loan charge-offs(b) | |||||||||||||||||||||||
| Total Loans | more past due | Year ended | ||||||||||||||||||||||
| December 31, (in millions) | 2004 | 2003 | (a) | 2004 | 2003 | (a) | 2004 | 2003 | ||||||||||||||||
Home finance |
$ | 124,653 | $ | 74,560 | $ | 673 | $ | 374 | $ | 573 | $ | 135 | ||||||||||||
Auto & education finance |
62,712 | 43,157 | 193 | 123 | 263 | 171 | ||||||||||||||||||
Consumer & small business and other |
15,107 | 4,204 | 295 | 72 | 154 | 75 | ||||||||||||||||||
Credit card receivables |
64,575 | 17,426 | 1,006 | 284 | 1,923 | 1,126 | ||||||||||||||||||
Total consumer loans |
267,047 | 139,347 | 2,167 | 853 | 2,913 | 1,507 | ||||||||||||||||||
Total wholesale loans |
135,067 | 75,419 | 1,582 | 2,046 | 186 | 765 | ||||||||||||||||||
Total loans reported |
402,114 | 214,766 | 3,749 | 2,899 | 3,099 | 2,272 | ||||||||||||||||||
Securitized loans: |
||||||||||||||||||||||||
Residential mortgage(c) |
11,533 | 15,564 | 460 | 594 | 150 | 191 | ||||||||||||||||||
Automobile |
4,763 | 6,315 | 12 | 13 | 24 | 25 | ||||||||||||||||||
Credit card |
70,795 | 34,856 | 1,337 | 879 | 2,898 | 1,870 | ||||||||||||||||||
Total consumer loans securitized |
87,091 | 56,735 | 1,809 | 1,486 | 3,072 | 2,086 | ||||||||||||||||||
Securitized wholesale activities |
1,401 | 2,108 | — | 9 | — | — | ||||||||||||||||||
Total loans securitized(d) |
88,492 | 58,843 | 1,809 | 1,495 | 3,072 | 2,086 | ||||||||||||||||||
Total loans reported and securitized(e) |
$ | 490,606 | $ | 273,609 | $ | 5,558 | $ | 4,394 | $ | 6,171 | $ | 4,358 | ||||||||||||
| (a) | Heritage JPMorgan Chase only. |
|
| (b) | 2004 results include six months of the combined Firm’s results and six months of heritage
JPMorgan Chase results. All other periods reflect the results of heritage JPMorgan Chase only. |
|
| (c) | Includes $10.3 billion and $13.6 billion of outstanding principal balances on securitized sub-prime
1–4 family residential mortgage loans as of December 31, 2004 and 2003, respectively. |
|
| (d) | Total
assets held in securitization-related SPEs were $175.1 billion and $104.0 billion at December 31,
2004 and 2003, respectively. The $88.5 billion and $58.8 billion of loans securitized at December
31, 2004 and 2003, respectively, excludes: $50.8 billion and $37.1 billion of securitized loans, in
which the Firm’s only continuing involvement is the servicing of the assets; $35.2 billion and $7.3
billion of seller’s interests in credit card master trusts; and $0.6 billion and $0.8 billion of
escrow accounts and other assets, respectively. |
|
| (e) | Represents both loans on the Consolidated balance sheets and loans that have been securitized,
but excludes loans for which the Firm’s only continuing involvement is servicing of the assets. |
Note 14 – Variable interest entities
Refer to Note 1 on page 88 of this Annual Report for a further description of JPMorgan Chase’s policies regarding consolidation of variable interest entities.
JPMorgan Chase’s principal involvement with VIEs occurs in the following business segments:
| • | Investment Bank: Utilizes VIEs to assist
clients in accessing the financial markets in a
cost-efficient manner, by providing the structural
flexibility to meet their needs pertaining to
price, yield and desired risk. There are two broad
categories of transactions involving VIEs in the
IB: (1) multi-seller conduits and (2) client
intermediation; both are discussed below. The IB
also securitizes loans through QSPEs which are not
considered VIEs, to create asset-backed
securities, as further discussed in Note 13 on
pages 103–106 of this Annual Report. |
|||
| • | Asset & Wealth Management: Provides investment
management services to a limited number of the
Firm’s mutual funds deemed VIEs. AWM earns a fixed
fee based on assets managed; the fee varies with
each fund’s investment objective and is
competitively priced. For the limited number of
funds that qualify as VIEs, the Firm’s interest is
not considered significant under FIN 46R. |
|||
| • | Treasury & Securities Services: Provides
trustee and custodial services to a number of
VIEs. These services are similar to those provided
to non-VIEs.
TSS earns market-based fees for services
provided. Such relationships are not considered
significant interests under FIN 46R. |
|||
| • | Commercial Banking: Utilizes VIEs as part of its middle markets business.
This involvement includes: (1) structuring and
administering independent, member-owned finance
entities for companies with dedicated
distribution systems, where the Firm may
also provide some liquidity, letters of credit |
|||
and/or derivative instruments; and (2) synthetic
lease transactions, in which the Firm provides
financing to a SPE; in turn, the SPE purchases
assets, which are then leased by the SPE to the
Firm’s customer. The CB earns market-based fees
for providing such services. These activities do
not involve the Firm holding a significant
interest in VIEs. |
||||
| • | The Firm’s Private Equity business, now included
in Corporate, is involved with entities that may be
deemed VIEs. Private equity activities are
accounted for in accordance with the Investment
Company Audit Guide (“Audit Guide”). The FASB
deferred adoption of FIN 46R for non-registered
investment companies that apply the Audit Guide
until the proposed Statement of Position on the
clarification of the scope of the Audit Guide is
finalized. The Firm continues to apply this
deferral provision; had FIN
46R been applied to VIEs subject to this deferral,
the impact would have had an insignificant impact
on the Firm’s Consolidated financial statements as
of December 31, 2004. |
|||
As noted above, there are two broad categories of transactions involving VIEs with which the IB is involved: multi-seller conduits and client intermediation. These are discussed more fully below.
Multi-seller conduits
| 106 | JPMorgan Chase & Co. / 2004 Annual Report |
Table of Contents
JPMorgan Chase serves as the administrator and provides contingent liquidity support and limited credit enhancement for several multi-seller conduits. The commercial paper issued by the conduits is backed by sufficient collateral, credit enhancements and commitments to provide liquidity to support receiving at least a liquidity rating of A-1, P-1 and, in certain cases, F1.
As a means of ensuring timely repayment of the commercial paper, each asset pool financed by the conduits has a minimum 100% deal-specific liquidity facility associated with it. In the unlikely event an asset pool is removed from the conduit, the administrator can draw on the liquidity facility to repay the maturing commercial paper. The liquidity facilities are typically in the form of asset purchase agreements and are generally structured such that the bank liquidity is provided by purchasing, or lending against, a pool of non-defaulted, performing assets. Deal-specific liquidity is the primary source of liquidity support for the conduits.
Program-wide liquidity in the form of revolving and short-term lending commitments is provided by the Firm to these vehicles in the event of short-term disruptions in the commercial paper market.
Deal-specific credit enhancement that supports the commercial paper issued by the conduits is generally structured to cover a multiple of historical losses expected on the pool of assets and is primarily provided by customers (i.e., sellers) or other third parties. The deal-specific credit enhancement is typically in the form of over-collateralization provided by the seller but may also include any combination of the following: recourse to the seller or originator, cash collateral accounts, letters of credit, excess spread, retention of subordinated interests or third-party guarantees. In certain instances, the Firm provides limited credit enhancement in the form of standby letters of credit.
The following table summarizes the Firm’s involvement with Firm-administered multi-seller conduits:
| Consolidated | Nonconsolidated | Total | ||||||||||||||||||||||
| December 31, (in billions) | 2004 | (c) | 2003 | (b) | 2004 | (c) | 2003 | (b)(c) | 2004 | (c) | 2003 | (b)(c) | ||||||||||||
Total commercial paper issued by conduits |
$ | 35.8 | $ | 6.3 | $ | 9.3 | $ | 5.4 | $ | 45.1 | $ | 11.7 | ||||||||||||
Commitments |
||||||||||||||||||||||||
Asset-purchase agreements |
$ | 47.2 | $ | 9.3 | $ | 16.3 | $ | 8.7 | $ | 63.5 | $ | 18.0 | ||||||||||||
Program-wide liquidity commitments |
4.0 | 1.6 | 2.0 | 1.0 | 6.0 | 2.6 | ||||||||||||||||||
Limited credit enhancements |
1.4 | 0.9 | 1.2 | 1.0 | 2.6 | 1.9 | ||||||||||||||||||
Maximum exposure to loss(a) |
48.2 | 9.7 | 16.9 | 9.0 | 65.1 | 18.7 | ||||||||||||||||||
| (a) | The Firm’s maximum exposure to loss is limited to the amount of drawn commitments (i.e.,
sellers’ assets held by the multi-seller conduits for which the Firm provides liquidity support) of
$42.2 billion and $11.7 billion at December 31, 2004 and 2003, respectively,
plus contractual but undrawn commitments of $22.9 billion and $7.0 billion at December 31, 2004 and
2003, respectively. Since the Firm provides credit enhancement and liquidity to these multi-seller
conduits, the maximum exposure is not adjusted to exclude exposure absorbed by third-party
liquidity providers. |
|
| (b) | Heritage JPMorgan Chase only. |
|
| (c) | In December 2003 and February 2004, two multi-seller conduits were restructured, with each
conduit issuing preferred securities acquired by an independent third-party investor; the investor
absorbs the majority of the expected losses of the conduit. In determining the primary beneficiary
of the restructured conduits, the Firm leveraged an existing rating agency model – an independent
market standard – to estimate the size of the expected losses, and considered the relative rights
and obligations of each of the variable interest holders. |
The Firm views its credit exposure to multi-seller conduit transactions as limited. This is because, for the most part, the Firm is not required to fund under the liquidity facilities if the assets in the VIE are in default. Additionally, the Firm’s obligations under the letters of credit are secondary to the risk of first loss provided by the customer or other third parties – for example, by the overcollateralization of the VIE with the assets sold to it or notes subordinated to the Firm’s liquidity facilities.
Additionally, the Firm is involved with a structured investment vehicle (“SIV”) that funds a diversified portfolio of highly rated assets by issuing commercial paper, medium-term notes and capital. The assets and liabilities of this SIV were approximately $7.1 billion and are included in the Firm’s Consolidated balance sheet at December 31, 2004.
Client intermediation
The Firm has created structured wholesale loan vehicles managed by third parties, in which loans are purchased from third parties or through the Firm’s syndication and trading functions and funded by issuing commercial paper. The amount of the commercial paper issued by these vehicles totaled $3.4 billion and $5.3 billion as of December 31, 2004 and 2003, respectively. Investors provide collateral and have a first risk of loss up to the amount of collateral pledged. The Firm retains a second-risk-of-loss position and does not absorb a majority of the expected losses of the vehicles. Documentation includes provisions intended, subject to certain conditions, to enable JPMorgan Chase to terminate the transactions related to a particular loan vehicle if the value of the relevant portfolio declines below a specified level. The Firm also provides liquidity support to these VIEs.
| JPMorgan Chase & Co. / 2004 Annual Report | 107 |
Table of Contents
Notes to consolidated financial statements
The Firm structures credit-linked notes in which the VIE purchases highly-rated assets (such as asset-backed securities) and enters into a credit derivative contract with the Firm to obtain exposure to a referenced credit not held by the VIE. Credit-linked notes are issued by the VIE to transfer the risk of the referenced credit to the investors in the VIE. Clients and investors often prefer a VIE structure, since the credit-linked notes generally carry a higher credit rating than they would if issued directly by JPMorgan Chase.
The Firm is involved with municipal bond vehicles for the purpose of creating a series of secondary market trusts that allow tax-exempt investors to finance their investments at short-term tax-exempt rates. The VIE purchases fixed-rate, longer-term highly rated municipal bonds by issuing puttable floating-rate certificates and inverse floating-rate certificates; the investors in the inverse floating-rate certificates are exposed to the residual losses of the VIE (the “residual interests”). For vehicles in which the Firm owns the residual interests, the Firm consolidates the VIE. In vehicles where third-party investors own the residual interests, the Firm’s exposure is limited because of the high credit quality of the underlying municipal bonds, the unwind triggers based on the market value of the underlying collateral and the residual interests held by third parties. The Firm often serves as remarketing agent for the VIE and provides liquidity to support the remarketing.
Additionally, JPMorgan Chase structures, on behalf of clients, other client intermediation vehicles in which the Firm transfers the risks and returns of the assets held by the VIE, typically debt and equity instruments, to clients through derivative contracts.
Assets held by certain client intermediation–related VIEs at December 31, 2004 and 2003, were as follows:
| December 31, (in billions) | 2004 | 2003 | (e) | |||||
Structured wholesale loan vehicles(a) |
$ | 3.4 | $ | 5.3 | ||||
Credit-linked note vehicles(b) |
17.8 | 17.7 | ||||||
Municipal bond vehicles(c) |
7.5 | 5.5 | ||||||
Other client intermediation vehicles(d) |
4.0 | 5.8 | ||||||
| (a) | JPMorgan Chase was committed to provide
liquidity to these VIEs of up to $5.2 billion and
$8.0 billion at December 31, 2004 and 2003,
respectively, of which $3.8 billion at December 31,
2004, and $6.3 billion at December 31, 2003, was in
the form of asset purchase agreements. The Firm’s
maximum exposure to loss to these vehicles at
December 31, 2004 and 2003, was $3.2 billion and
$5.5 billion, respectively, which reflects the
netting of collateral and other program limits. |
|
| (b) | The fair value of the Firm’s derivative
contracts with credit-linked note vehicles was not
material at December 31, 2004. Assets of $2.3
billion and $2.1 billion reported in the table
above were recorded on the Firm’s Consolidated
balance sheets at December 31, 2004 and 2003,
respectively, due to contractual relationships held
by the Firm that relate to collateral held by the
VIE. |
|
| (c) | Total amounts consolidated due to the Firm
owning residual interests were $2.6 billion at
December 31, 2004 and $2.5 billion at December 31,
2003, and are reported in the table.
Total liquidity commitments were $3.1 billion
and $1.8 billion at December 31, 2004 and 2003,
respectively. The Firm’s maximum credit exposure
to all municipal bond vehicles was $5.7 billion
and $4.3 billion at December 31, 2004 and 2003,
respectively. |
|
| (d) | The Firm’s net exposure arising from
these intermediations is not significant. |
|
| (e) | Heritage JPMorgan Chase only. |
Finally, the Firm may enter into transactions with VIEs structured by other parties. These transactions can include, for example, acting as a derivative counterparty, liquidity provider, investor, underwriter, placement agent, trustee or custodian. These transactions are conducted at arm’s length, and individual credit decisions are based upon the analysis of the specific VIE, taking into consideration the quality of the underlying assets. JPMorgan Chase records and reports these positions similarly to any other third-party transaction. These activities do not cause JPMorgan Chase to absorb a majority of the expected losses of the VIEs or to receive a majority of the residual returns of the VIE, and they are not considered significant for disclosure purposes.
Consolidated VIE assets
| December 31, (in billions) | 2004 | 2003 | (c) | |||||
Consolidated VIE assets(a) |
||||||||
Investment securities |
$ | 10.6 | $ | 3.8 | ||||
Trading assets(b) |
4.7 | 2.7 | ||||||
Loans |
3.4 | 1.1 | ||||||
Interests in purchased receivables |
31.6 | 4.7 | ||||||
Other assets |
0.4 | 0.1 | ||||||
Total consolidated assets |
$ | 50.7 | $ | 12.4 | ||||
| (a) | The Firm also holds $3.4 billion and $3.0
billion of assets, at December 31, 2004 and
December 31, 2003, respectively, primarily as a
seller’s interest, in certain consumer
securitizations in a segregated entity, as part of
a two-step securitization transaction. This
interest is included in the securitization
activities disclosed in Note 13 on pages 103–106 of
this Annual Report. |
|
| (b) | Includes the fair value
of securities and
derivatives. |
|
| (c) | Heritage
JPMorgan Chase only. |
Interests in purchased receivables include interests in receivables purchased by Firm-administered conduits, which have been consolidated in accordance with FIN 46R. Interests in purchased receivables are carried at cost and are reviewed to determine whether an other-than-temporary impairment exists. Based on the current level of credit protection specified in each transaction, primarily through overcollateralization, the Firm determined that no other-than-temporary impairment existed at December 31, 2004.
The interest-bearing beneficial interest liabilities issued by consolidated VIEs are classified in the line item titled “Beneficial interests issued by consolidated variable interest entities” on the Consolidated balance sheets. The holders of these beneficial interests do not have recourse to the general credit of JPMorgan Chase. See Note 17 on page 112 of this Annual Report for the maturity profile of FIN 46 long-term beneficial interests.
FIN 46 transition
Upon adoption of FIN 46, the assets, liabilities and noncontrolling interests of VIEs were generally measured at the amounts at which such interests would have been carried had FIN 46 been effective when the Firm first met the conditions to be considered the primary beneficiary. The difference between the net amount added to the balance sheet and the amount of any previously recognized interest in the newly consolidated entity was recognized as a cumulative effect of an accounting change at July 1, 2003, which resulted in a $2 million (after-tax) reduction to the Firm’s consolidated earnings. The Firm also recorded a $34 million (after-tax) reduction in Other comprehensive income, related to AFS securities and derivative cash flow hedges; these were related to entities measured at the amount at which such interests would have been carried had FIN 46 been effective when the Firm first met the conditions of being the primary beneficiary.
| 108 | JPMorgan Chase & Co. / 2004 Annual Report |
Table of Contents
FIN 46R transition
The application of FIN 46R involved significant judgments and interpretations by management. The Firm is aware of differing interpretations being developed among accounting professionals and the EITF with regard to analyzing derivatives under FIN 46R. Management’s current interpretation is that derivatives should be evaluated by focusing on an economic analysis of the rights and obligations of a VIE’s assets, liabilities, equity and other contracts, while considering the entity’s activities and design; the terms of the derivative contract and the role it has with the entity; and whether the derivative contract creates and/or absorbs variability of the VIE. The Firm will continue to monitor developing interpretations.
Note 15 – Goodwill and other intangible assets
Effective January 1, 2002, the Firm adopted SFAS 142, reclassifying certain intangible assets from Goodwill to Other intangible assets. There was no impairment of goodwill upon adoption of SFAS 142.
Goodwill is not amortized but instead tested for impairment at the reporting-unit segment (which is generally one level below the six major reportable business segments as described in Note 31 on pages 126-127 of this Annual Report; plus Private Equity, which is included in Corporate). Goodwill is tested annually (during the fourth quarter) or more often if events or circumstances, such as adverse changes in the business climate, indicate there may be impairment. Intangible assets determined to have indefinite lives are not amortized but instead are tested for impairment at least annually, or more frequently if events or changes in circumstances indicate that the asset might be impaired. The impairment test compares the fair value of the indefinite lived intangible asset to its carrying amount. Other acquired intangible assets determined to have finite lives, such as core deposits and credit card relationships, are amortized over their estimated useful lives in a manner that best reflects the economic benefits of the intangible asset. In addition, impairment testing is performed periodically on these amortizing intangible assets.
Goodwill and Other intangible assets consist of the following:
| December 31, (in millions) | 2004 | 2003 | (a) | |||||
Goodwill |
$ | 43,203 | $ | 8,511 | ||||
Mortgage servicing rights |
5,080 | 4,781 | ||||||
Purchased credit card relationships |
3,878 | 1,014 | ||||||
All other intangibles: |
||||||||
Other credit card-related intangibles |
$ | 272 | $ | — | ||||
Core deposit intangibles |
3,328 | 8 | ||||||
All other intangibles |
2,126 | 677 | ||||||
Total other intangible assets |
$ | 5,726 | $ | 685 | ||||
| (a) | Heritage JPMorgan Chase only. |
Goodwill
impaired at December 31, 2004 or 2003, nor was any goodwill written off during the years ended December 31, 2004, 2003 or 2002.
Under SFAS 142, goodwill must be allocated to reporting units and tested for impairment. Goodwill attributed to the business segments was as follows:
| Goodwill resulting | ||||||||||||
| Dec. 31, | Dec. 31, | from the Merger, | ||||||||||
| (in millions) | 2004 | 2003 | (a) | July 1, 2004 | ||||||||
Investment Bank |
$ | 3,309 | $ | 2,084 | $ | 1,233 | ||||||
Retail Financial Services |
15,022 | 446 | 14,559 | |||||||||
Card Services |
12,781 | — | 12,765 | |||||||||
Commercial Banking |
2,650 | 61 | 2,592 | |||||||||
Treasury & Securities Services |
2,044 | 1,390 | 461 | |||||||||
Asset & Wealth Management |
7,020 | 4,153 | 2,536 | |||||||||
Corporate (Private Equity) |
377 | 377 | — | |||||||||
Total goodwill |
$ | 43,203 | $ | 8,511 | $ | 34,146 | ||||||
| (a) | Heritage JPMorgan Chase only. |
Mortgage servicing rights
The amount capitalized as MSRs represents the amount paid to third parties to acquire MSRs or is based on fair value, if retained upon the sale or securitization of mortgage loans. The Firm estimates the fair value of MSRs using a discounted future cash flow model. The model considers portfolio characteristics, contractually specified servicing fees, prepayment assumptions, delinquency rates, late charges, other ancillary revenues, costs to service and other economic factors. The Firm compares its fair value estimates and assumptions to observable market data where available and to recent market activity and actual portfolio experience. Management believes that the assumptions used to estimate fair values are supportable and reasonable.
The Firm accounts for its MSRs at the lower of cost or market, in accordance with SFAS 140. MSRs are amortized as a reduction of the actual servicing income received in proportion to, and over the period of the estimated future net servicing income stream of, the underlying mortgage loans. For purposes of evaluating and measuring impairment of MSRs, the Firm stratifies its portfolio on the basis of the predominant risk characteristics, which are loan type and interest rate. Any indicated impairment is recognized as a reduction in revenue through a valuation allowance, to the extent that the carrying value of an individual stratum exceeds its estimated fair value.
The Firm evaluates other-than-temporary impairment by reviewing changes in mortgage and other market interest rates over historical periods and then determines an interest rate scenario to estimate the amounts of the MSRs’ gross carrying value and the related valuation allowance that could be expected to be recovered in the foreseeable future. Any gross carrying value and related valuation allowance amount that are not expected to be recovered in the foreseeable future, based upon the interest rate scenario, are considered to be other-than-temporary.
| JPMorgan Chase & Co./2004 Annual Report | 109 |
Table of Contents
Notes to consolidated financial statements
JPMorgan Chase & Co.
The carrying value of MSRs is sensitive to changes in interest rates, including their effect on prepayment speeds. JPMorgan Chase uses a combination of derivatives, AFS securities and trading instruments to manage changes in the fair value of MSRs. The intent is to offset any changes in the fair value of MSRs with changes in the fair value of the related risk management instrument. MSRs decrease in value when interest rates decline. Conversely, securities (such as mortgage-backed securities), principal-only certificates and derivatives (when the Firm receives fixed-rate interest payments) decrease in value when interest rates increase. The Firm offsets the interest rate risk of its MSRs by designating certain derivatives (e.g., a combination of swaps, swaptions and floors that produces an interest rate profile opposite to the designated risk of the hedged MSRs) as fair value hedges of specified MSRs under SFAS 133. SFAS 133 hedge accounting allows the carrying value of the hedged MSRs to be adjusted through earnings in the same period that the change in value of the hedging derivatives is recognized through earnings. Both of these valuation adjustments are recorded in Mortgage fees and related income.
When applying SFAS 133, the loans underlying the MSRs being hedged are stratified into specific SFAS 133 asset groupings that possess similar interest rate and prepayment risk exposures. The documented hedge period for the Firm is daily. Daily adjustments are performed to incorporate new or terminated derivative contracts and to modify the amount of the corresponding similar asset grouping that is being hedged. The Firm has designated changes in the benchmark interest rate (LIBOR) as the hedged risk. In designating the benchmark interest rate, the Firm considers the impact that the change in the benchmark rate has on the prepayment speed estimates in determining the fair value of the MSRs. The Firm performs both prospective and retrospective hedge effectiveness evaluations, using a regression analysis, to determine whether the hedge relationship is expected to be highly effective. Hedge effectiveness is assessed by comparing the change in value of the MSRs, as a result of changes in benchmark interest rates, to the change in the value of the designated derivatives. For a further discussion on derivative instruments and hedging activities, see Note 26 on pages 118-119 of this Annual Report.
Securities (both AFS and Trading) are also used to manage the risk exposure of MSRs. Because these securities do not qualify as hedges under SFAS 133, they are accounted for under SFAS 115, with realized gains and losses and unrealized gains and losses on trading securities recognized in earnings in Securities/private equity gains, interest income on the AFS securities is recognized in earnings in Net interest income, and unrealized gains and losses on AFS securities are reported in Other comprehensive income. Finally, certain non-hedge derivatives, which have not been designated by management in SFAS 133 hedge relationships, are used to manage the economic risk exposure of MSRs and are recorded in Mortgage fees and related income.
The following table summarizes MSR activity and related amortization for the dates indicated. It also includes the key assumptions and the sensitivity of the fair value of MSRs at December 31, 2004, to immediate 10% and 20% adverse changes in each of those assumptions.
| Year ended December 31, (in millions)(a) | 2004 | 2003 | 2002 | |||||||||
Balance at January 1 |
$ | 6,159 | $ | 4,864 | $ | 7,749 | ||||||
Additions |
1,757 | 3,201 | 2,071 | |||||||||
Bank One merger |
90 | NA | NA | |||||||||
Sales |
(3 | ) | — | — | ||||||||
Other-than-temporary impairment |
(149 | ) | (283 | ) | — | |||||||
Amortization |
(1,297 | ) | (1,397 | ) | (1,367 | ) | ||||||
SFAS 133 hedge valuation adjustments |
(446 | ) | (226 | ) | (3,589 | ) | ||||||
Balance at December 31 |
6,111 | 6,159 | 4,864 | |||||||||
Less: valuation allowance |
1,031 | 1,378 | 1,634 | |||||||||
Balance at December 31, after
valuation allowance |
$ | 5,080 | $ | 4,781 | $ | 3,230 | ||||||
Estimated fair value at December 31 |
$ | 5,124 | $ | 4,781 | $ | 3,230 | ||||||
Weighted-average prepayment
speed assumption (CPR) |
17.29 | % | 17.67 | % | 28.50 | % | ||||||
Weighted-average discount rate |
7.93 | % | 7.31 | % | 7.70 | % | ||||||
| (a) | 2004 results include six months of the combined Firm’s results and six months of heritage
JPMorgan Chase results. All other periods reflect the results of heritage JPMorgan Chase only. |
| 2004 | ||||
Weighted-average prepayment speed assumption (CPR) |
17.29 | % | ||
Impact on fair value with 10% adverse change |
(295 | ) | ||
Impact on fair value with 20% adverse change |
(558 | ) | ||
Weighted-average discount rate |
7.93 | % | ||
Impact on fair value with 10% adverse change |
(128 | ) | ||
Impact on fair value with 20% adverse change |
(249 | ) | ||
The sensitivity analysis in the preceding table is hypothetical and should be used with caution. As the figures indicate, changes in fair value based on a 10% and 20% variation in assumptions generally cannot be easily extrapolated because the relationship of the change in the assumptions to the change in fair value may not be linear. Also, in this table, the effect that a change in a particular assumption may have on the fair value is calculated without changing any other assumption. In reality, changes in one factor may result in changes in another, which might magnify or counteract the sensitivities.
The valuation allowance represents the extent to which the carrying value of MSRs exceeds its estimated fair value for its applicable SFAS 140 strata. Changes in the valuation allowance are the result of the recognition of impairment or the recovery of previously recognized impairment charges, due to changes in market conditions during the period. The changes in the valuation allowance for MSRs were as follows:
| Year Ended December 31, (in millions)(a) | 2004 | 2003 | 2002 | |||||||||
Balance at January 1 |
$ | 1,378 | $ | 1,634 | $ | 1,170 | ||||||
Other-than-temporary impairment |
(149 | ) | (283 | ) | — | |||||||
SFAS 140 impairment (recovery) adjustment |
(198 | ) | 27 | 464 | ||||||||
Balance at December 31 |
$ | 1,031 | $ | 1,378 | $ | 1,634 | ||||||
| (a) | 2004 results include six months of the combined Firm’s results
and six months of heritage JPMorgan Chase results, while 2003 results include heritage JPMorgan Chase only. |
| 110 | JPMorgan Chase & Co./2004 Annual Report |
Table of Contents
During 2004 and 2003, the Firm recorded an other-than-temporary impairment of its MSRs of $149 million and $283 million, respectively, which permanently reduced the gross carrying value of the MSRs and the related valuation allowance. The permanent reduction precludes subsequent reversals. This write-down had no impact on the results of operations or financial condition of the Firm.
All other intangible assets
The components of credit card relationships, core deposits and other intangible assets were as follows:
| 2004 | 2003(b) | |||||||||||||||||||||||
| Net | Net | |||||||||||||||||||||||
| Gross | Accumulated | carrying | Gross | Accumulated | carrying | |||||||||||||||||||
| December 31, (in millions) | amount | amortization | value | amount | amortization | value | ||||||||||||||||||
Purchased credit card relationships |
$ | 5,225 | $ | 1,347 | $ | 3,878 | $ | 1,885 | $ | 871 | $ | 1,014 | ||||||||||||
Other credit card-related intangibles |
295 | 23 | 272 | — | — | — | ||||||||||||||||||
Core deposit intangibles |
3,797 | 469 | 3,328 | 147 | 139 | 8 | ||||||||||||||||||
All other intangibles |
2,528 | 402 | (a) | 2,126 | 946 | 269 | 677 | |||||||||||||||||
| Amortization expense (in millions)(c) | 2004 | 2003 | 2002 | |||||||||
Purchased credit card relationships |
$ | 476 | $ | 256 | $ | 280 | ||||||
Other credit card-related intangibles |
23 | — | — | |||||||||
Core deposit intangibles |
330 | 6 | 10 | |||||||||
All other intangibles |
117 | 32 | 33 | |||||||||
Total amortization expense |
$ | 946 | $ | 294 | $ | 323 | ||||||
| (a) | Includes $16 million of amortization expense related to servicing assets on
securitized automobile loans, which is recorded in Asset management, administration and
commissions, for 2004. |
|
| (b) | Heritage JPMorgan Chase only. |
|
| (c) | 2004 results include six months of the combined Firm’s results and six months of heritage
JPMorgan Chase results. All other periods reflect the results of heritage JPMorgan Chase only. |
Future amortization expense
The following table presents estimated amortization expenses related to credit card relationships, core deposits and All other intangible assets at December 31, 2004:
| Other credit | ||||||||||||||||||||
| (in millions) | Purchased credit | card-related | Core deposit | All other | ||||||||||||||||
| Year ended December 31, | card relationships | intangibles | intangibles | intangible assets | Total | |||||||||||||||
2005 |
$ | 701 | $ | 45 | $ | 622 | $ | 165 | $ | 1,533 | ||||||||||
2006 |
674 | 40 | 531 | 153 | 1,398 | |||||||||||||||
2007 |
606 | 35 | 403 | 136 | 1,180 | |||||||||||||||
2008 |
502 | 33 | 294 | 128 | 957 | |||||||||||||||
2009 |
360 | 29 | 239 | 124 | 752 | |||||||||||||||
Note 16 – Premises and equipment
Premises and equipment, including leasehold improvements, are carried at cost less accumulated depreciation and amortization. JPMorgan Chase computes depreciation using the straight-line method over the estimated useful life of an asset. For leasehold improvements, the Firm uses the straight-line method computed over the lesser of the remaining term of the leased facility or 10 years.
JPMorgan Chase capitalizes certain costs associated with the acquisition or development of internal-use software under SOP 98-1. Once the software is ready for its intended use, these costs are amortized on a straight-line basis over the software’s expected useful life.
| JPMorgan Chase & Co./2004 Annual Report | 111 |
Table of Contents
Notes to consolidated financial statements
Note 17 – Long-term debt
JPMorgan Chase issues long-term debt denominated in various currencies, although predominantly U.S. dollars, with both fixed and variable interest rates. The following table is a summary of long-term debt (net of unamortized original issue debt discount and SFAS 133 valuation adjustments):
| By remaining contractual maturity at December 31, 2004 | Under | After | 2004 | 2003 | ||||||||||||||||||||
| (in millions) | 1 year | 1-5 years | 5 years | total | total(g) | |||||||||||||||||||
Parent company |
||||||||||||||||||||||||
Senior debt:(a) |
Fixed rate | $ | 2,864 | $ | 20,029 | $ | 2,670 | $ | 25,563 | $ | 15,044 | |||||||||||||
| Variable rate | 6,221 | 8,295 | 612 | 15,128 | 10,696 | |||||||||||||||||||
| Interest rates(b) | 1.22-7.63 | % | 0.20-6.88 | % | 1.12-5.00 | % | 0.20-7.63 | % | 0.96-7.50 | % | ||||||||||||||
Subordinated debt: |
Fixed rate | $ | 1,419 | $ | 7,536 | $ | 13,100 | $ | 22,055 | $ | 14,382 | |||||||||||||
| Variable rate | 309 | 46 | 2,331 | 2,686 | 513 | |||||||||||||||||||
| Interest rates(b) | 4.78-7.13 | % | 5.75-9.88 | % | 1.92-10.00 | % | 1.92-10.00 | % | 4.78-8.25 | % | ||||||||||||||
| Subtotal | $ | 10,813 | $ | 35,906 | $ | 18,713 | $ | 65,432 | $ | 40,635 | ||||||||||||||
Subsidiaries |
||||||||||||||||||||||||
Senior debt:(a) |
Fixed rate | $ | 283 | $ | 4,133 | $ | 1,833 | $ | 6,249 | $ | 2,829 | |||||||||||||
| Variable rate | 4,234 | 13,547 | 4,316 | 22,097 | 3,842 | |||||||||||||||||||
| Interest rates(b) | 2.13-10.45 | % | 1.71-11.74 | % | 2.19-13.00 | % | 1.71-13.00 | % | 1.13-13.00 | % | ||||||||||||||
Subordinated debt: |
Fixed rate | $ | 503 | $ | 831 | $ | 310 | $ | 1,644 | $ | 708 | |||||||||||||
| Variable rate | — | — | — | — | — | |||||||||||||||||||
| Interest rates(b) | 6.00-7.00 | % | 6.13-6.70 | % | 8.25 | % | 6.00-8.25 | % | 6.13-7.00 | % | ||||||||||||||
| Subtotal | $ | 5,020 | $ | 18,511 | $ | 6,459 | $ | 29,990 | $ | 7,379 | ||||||||||||||
Total long-term debt |
$ | 15,833 | $ | 54,417 | $ | 25,172 | $ | 95,422 | (d)(e)(f) | $ | 48,014 | |||||||||||||
| FIN 46R long-term beneficial interests:(c) | ||||||||||||||||||||||||
| Fixed rate | $ | — | $ | 341 | $ | 434 | $ | 775 | $ | 353 | ||||||||||||||
| Variable rate | 3,072 | 570 | 1,976 | 5,618 | 2,076 | |||||||||||||||||||
| Interest rates(b) | 2.02-2.84 | % | 0.54-7.35 | % | 2.25-12.79 | % | 0.54-12.79 | % | 1.12-10.00 | % | ||||||||||||||
| Total FIN 46R long-term beneficial interests | $ | 3,072 | $ | 911 | $ | 2,410 | $ | 6,393 | $ | 2,429 | ||||||||||||||
| (a) | Included are various equity-linked or other indexed instruments. Embedded derivatives
separated from hybrid securities in accordance with SFAS 133 are reported at fair value and
shown net with the host contract on the balance sheet. Changes in fair value of separated derivatives are
recorded in Trading revenue. |
|
| (b) | The interest rates shown are the range of contractual rates in effect at year-end, including
non-U.S. dollar fixed and variable-rate issuances, which excludes the effects of related
derivative instruments. The use of these derivative instruments modifies the Firm’s exposure to the contractual
interest rates disclosed in the table above. Including the effects of derivatives, the range of
modified rates in effect at December 31, 2004, for total long-term debt was 0.14% to 11.74%, versus the
contractual range of 0.20% to 13.00% presented in the table above. |
|
| (c) | Included on the Consolidated balance sheets in Beneficial interests issued by consolidated
variable interest entities. |
|
| (d) | At December 31, 2004, long-term debt aggregating $23.3 billion was redeemable at the option
of JPMorgan Chase, in whole or in part, prior to maturity, based on the terms specified in the respective notes. |
|
| (e) | The aggregate principal amount of debt that matures in each of the five years subsequent to
2004 is $15.8 billion in 2005, $15.4 billion in 2006, $15.5 billion in 2007, $11.6 billion in
2008 and $11.9 billion in 2009. |
|
| (f) | Includes $1.5 billion of outstanding zero-coupon notes at December 31, 2004. The aggregate
principal amount of these notes at their respective maturities is $4.6 billion. |
|
| (g) | Heritage JPMorgan Chase only. |
The weighted-average contractual interest rate for total long-term debt was 4.50% and 4.71% as of December 31, 2004 and 2003, respectively. In order to modify exposure to interest rate and currency exchange rate movements, JPMorgan Chase utilizes derivative instruments, primarily interest rate and cross-currency interest rate swaps, in conjunction with some of its debt issues. The use of these instruments modifies the Firm’s interest expense on the associated debt. The modified weighted-average interest rate for total long-term debt, including the effects of related derivative instruments, was 3.97% and 2.79% as of December 31, 2004 and 2003, respectively.
JPMorgan Chase has guaranteed certain debt of its subsidiaries, including both long-term debt and structured notes sold as part of the Firm’s trading activities. These guarantees rank on a parity with all of the Firm’s other unsecured and unsubordinated indebtedness. Guaranteed liabilities totaled $320 million and $509 million at December 31, 2004 and 2003, respectively.
Junior subordinated deferrable interest debentures held by trusts that issued guaranteed capital debt securities
As a result of the adoption of FIN 46, JPMorgan Chase deconsolidated all the issuer trusts. Accordingly, the junior subordinated deferrable interest debentures issued by the Firm to the issuer trusts, totaling $10.3 billion and $6.8 billion at December 31, 2004 and 2003, respectively, were reflected in the Firm’s Consolidated balance sheets in the Liabilities section under the caption “Junior subordinated deferrable interest debentures held by trusts that issued guaranteed capital debt securities.” JPMorgan Chase records interest expenses on the corresponding junior subordinated debentures in its Consolidated statements of income. The Firm also records the common capital securities issued by the issuer trusts in Other assets in its Consolidated balance sheets at December 31, 2004 and 2003.
| 112 | JPMorgan Chase & Co./2004 Annual Report |
Table of Contents
The debentures issued to the issuer trusts by the Firm, less the capital securities of the issuer trusts, qualify as Tier 1 capital. The following is a summary of the outstanding capital securities, net of discount, issued by each trust and
the junior subordinated deferrable interest debenture issued by JPMorgan Chase to each trust as of December 31, 2004:
| Amount | Principal | Stated maturity | ||||||||||||||||||||||
| of capital | amount of | of capital | ||||||||||||||||||||||
| securities | debenture, | securities | Earliest | Interest rate of | Interest | |||||||||||||||||||
| issued | held | Issue | and | redemption | capital securities | payment/ | ||||||||||||||||||
| December 31, 2004 (in millions) | by trust(a) | by trust(b) | date | debentures | date | and debentures | distribution dates | |||||||||||||||||
Bank One Capital II |
$ | 280 | $ | 312 | 2000 | 2030 | 2005 | 8.50 | % | Quarterly | ||||||||||||||
Bank One Capital III |
474 | 621 | 2000 | 2030 | Any time | 8.75 | % | Semiannually | ||||||||||||||||
Bank One Capital IV |
158 | 163 | 2000 | 2030 | 2005 | LIBOR + 1.50% | Quarterly | |||||||||||||||||
Bank One Capital V |
300 | 336 | 2001 | 2031 | 2006 | 8.00 | % | Quarterly | ||||||||||||||||
Bank One Capital VI |
525 | 565 | 2001 | 2031 | 2006 | 7.20 | % | Quarterly | ||||||||||||||||
Chase Capital I |
600 | 619 | 1996 | 2026 | 2006 | 7.67 | % | Semiannually | ||||||||||||||||
Chase Capital II |
495 | 510 | 1997 | 2027 | 2007 | LIBOR + 0.50% | Quarterly | |||||||||||||||||
Chase Capital III |
296 | 306 | 1997 | 2027 | 2007 | LIBOR + 0.55% | Quarterly | |||||||||||||||||
Chase Capital VI |
248 | 256 | 1998 | 2028 | Any time | LIBOR + 0.625% | Quarterly | |||||||||||||||||
Chase Capital VIII |
250 | 258 | 2000 | 2030 | 2005 | 8.25 | % | Quarterly | ||||||||||||||||
First Chicago NBD Capital I |
248 | 256 | 1997 | 2027 | 2007 | LIBOR + 0.55% | Quarterly | |||||||||||||||||
First Chicago NBD
Institutional Capital A |
499 | 553 | 1996 | 2026 | 2006 | 7.95 | % | Semiannually | ||||||||||||||||
First Chicago NBD
Institutional Capital B |
250 | 274 | 1996 | 2026 | 2006 | 7.75 | % | Semiannually | ||||||||||||||||
First USA Capital Trust I |
3 | 3 | 1996 | 2027 | 2007 | 9.33 | % | Semiannually | ||||||||||||||||
JPM Capital Trust I |
750 | 773 | 1996 | 2027 | 2007 | 7.54 | % | Semiannually | ||||||||||||||||
JPM Capital Trust II |
400 | 412 | 1997 | 2027 | 2007 | 7.95 | % | Semiannually | ||||||||||||||||
J.P. Morgan Chase Capital IX |
500 | 515 | 2001 | 2031 | 2006 | 7.50 | % | Quarterly | ||||||||||||||||
J.P. Morgan Chase Capital X |
1,000 | 1,046 | 2002 | 2032 | 2007 | 7.00 | % | Quarterly | ||||||||||||||||
J.P. Morgan Chase Capital XI |
1,075 | 1,022 | 2003 | 2033 | 2008 | 5.88 | % | Quarterly | ||||||||||||||||
J.P. Morgan Chase Capital XII |
400 | 403 | 2003 | 2033 | 2008 | 6.25 | % | Quarterly | ||||||||||||||||
J.P. Morgan Chase Capital XIII |
472 | 486 | 2004 | 2034 | 2014 | LIBOR + 0.95% | Quarterly | |||||||||||||||||
JPMorgan Chase Capital XIV |
600 | 607 | 2004 | 2034 | 2009 | 6.20 | % | Quarterly | ||||||||||||||||
Total |
$ | 9,823 | $ | 10,296 | ||||||||||||||||||||
| (a) | Represents the amount of capital securities issued to the public by each trust, net of
unamortized discount. |
|
| (b) | Represents the principal amount of JPMorgan Chase debentures held as assets by each
trust, net of unamortized discount amounts. The principal amount of debentures held by
the trusts includes the impact of hedging and purchase accounting fair value adjustments that are recorded on
the Firm’s financial statements. |
Note 18 – Preferred stock
JPMorgan Chase is authorized to issue 200 million shares of preferred stock, in one or more series, with a par value of $1 per share. Outstanding preferred stock at December 31, 2004 and 2003, was 4 million and 18 million shares, respectively. On December 31, 2004, JPMorgan Chase redeemed a total of 14 million shares of its Series A, L and N variable cumulative preferred stocks.
Dividends on shares of each outstanding series of preferred stock are payable quarterly. All of the preferred stock outstanding takes precedence over JPMorgan Chase’s common stock for the payment of dividends and the distribution of assets in the event of a liquidation or dissolution of the Firm.
The following is a summary of JPMorgan Chase’s preferred stock outstanding:
| Stated value and | Rate in effect at | |||||||||||||||||||||||||||
| (in millions, except | redemption | Shares | Outstanding at December 31, | Earliest | December 31, | |||||||||||||||||||||||
| per share amounts and rates) | price per share(a) | 2004 | 2003 | 2004 | 2003 | redemption date | 2004 | |||||||||||||||||||||
Fixed/adjustable rate, noncumulative |
$ | 50.00 | 4.00 | 4.00 | $ | 200 | $ | 200 | See Note(c) | 5.46% | (d) | |||||||||||||||||
6.63% Series H cumulative(b) |
500.00 | 0.28 | 0.28 | 139 | 139 | 3/31/2006 | 6.63 | |||||||||||||||||||||
Adjustable rate, Series A cumulative |
100.00 | — | 2.42 | — | 242 | — | — | |||||||||||||||||||||
Adjustable rate, Series L cumulative |
100.00 | — | 2.00 | — | 200 | — | — | |||||||||||||||||||||
Adjustable rate, Series N cumulative |
25.00 | — | 9.10 | — | 228 | — | — | |||||||||||||||||||||
Total preferred stock |
4.28 | 17.80 | $ | 339 | $ | 1,009 | ||||||||||||||||||||||
| (a) | Redemption price includes amount shown in the table plus any accrued but unpaid
dividends. |
|
| (b) | Represented by depositary shares. |
|
| (c) | The shares are redeemable at any time with not less than 30 nor more than 60 days’ notice. |
|
| (d) | The fixed/adjustable rate preferred stock remained fixed at 4.96% through June 30, 2003;
thereafter, the minimum and maximum rates are 5.46% and 11.46%, respectively. |
| JPMorgan Chase & Co./2004 Annual Report | 113 |
Table of Contents
Notes to consolidated financial statements
Note 19 – Common stock
At December 31, 2004, JPMorgan Chase was authorized to issue 9.0 billion shares of common stock, with a $1 par value per share. In connection with the Merger, the shareholders approved an increase in the amount of authorized shares of 4.5 billion from the 4.5 billion that had been authorized as of December 31, 2003. Common shares issued (newly issued or distributed from treasury) by JPMorgan Chase during 2004, 2003 and 2002 were as follows:
| December 31, (in millions) | 2004 | 2003(a) | 2002(a) | |||||||||
Issued – balance at January 1 |
2,044.4 | 2,023.6 | 1,996.9 | |||||||||
Newly issued: |
||||||||||||
Employee benefits and
compensation plans |
69.0 | 20.9 | 25.9 | |||||||||
Employee stock purchase plans |
3.1 | 0.7 | 0.8 | |||||||||
Purchase accounting acquisitions
and other |
1,469.4 | — | — | |||||||||
Total newly issued |
1,541.5 | 21.6 | 26.7 | |||||||||
Cancelled shares |
(1.1 | ) | (0.8 | ) | — | |||||||
Total issued – balance at December 31 |
3,584.8 | 2,044.4 | 2,023.6 | |||||||||
Treasury – balance at January 1 |
(1.8 | ) | (24.9 | ) | (23.5 | ) | ||||||
Purchase of treasury stock |
(19.3 | ) | — | — | ||||||||
Share repurchases related to employee
stock-based awards(b) |
(7.5 | ) | (3.0 | ) | (3.9 | ) | ||||||
Issued from treasury: |
||||||||||||
Employee benefits and
compensation plans |
— | 25.8 | 2.1 | |||||||||
Employee stock purchase plans |
— | 0.3 | 0.4 | |||||||||
Total issued from treasury |
— | 26.1 | 2.5 | |||||||||
Total treasury – balance at December 31 |
(28.6 | ) | (1.8 | ) | (24.9 | ) | ||||||
Outstanding |
3,556.2 | 2,042.6 | 1,998.7 | |||||||||
| (a) | Heritage JPMorgan Chase only. |
|
| (b) | Participants in the 1996 Long-Term Incentive Plan and Stock Option Plan have shares
with-held to cover income taxes. The shares withheld amounted to 5.7 million, 2.3 million and
2.9 million for 2004, 2003 and 2002, respectively. |
During 2004, the Firm repurchased 19.3 million shares of common stock under a stock repurchase program which was approved by the Board of Directors on July 20, 2004. The Firm did not repurchase shares of its common stock during 2003 or 2002 under the prior stock repurchase program.
As of December 31, 2004, approximately 531 million unissued shares of common stock were reserved for issuance under various employee incentive, option and stock-purchase plans.
Note 20 – Earnings per share
SFAS 128 requires the presentation of basic and diluted earnings per share (“EPS”) in the income statement. Basic EPS is computed by dividing net income applicable to common stock by the weighted-average number of common shares outstanding for the period. Diluted EPS is computed using the same method as basic EPS but, in the denominator, the number of common shares reflect, in addition to outstanding shares, the potential dilution that could occur if convertible securities or other contracts to issue common stock were converted or exercised into common stock. Net income available for common stock is the same for basic EPS and diluted EPS, as JPMorgan Chase had no convertible securities, and therefore, no adjustments to net income available for common stock were necessary. The following table presents the calculation of basic and diluted EPS for 2004, 2003 and 2002:
| Year ended December 31, | ||||||||||||
| (in millions, except per share amounts)(a) | 2004 | 2003 | 2002 | |||||||||
Basic earnings per share |
||||||||||||
Net income |
$ | 4,466 | $ | 6,719 | $ | 1,663 | ||||||
Less: preferred stock dividends |
52 | 51 | 51 | |||||||||
Net income applicable to
common stock |
$ | 4,414 | $ | 6,668 | $ | 1,612 | ||||||
Weighted-average basic
shares outstanding |
2,779.9 | 2,008.6 | 1,984.3 | |||||||||
Net income per share |
$ | 1.59 | $ | 3.32 | $ | 0.81 | ||||||
Diluted earnings per share |
||||||||||||
Net income applicable to
common stock |
$ | 4,414 | $ | 6,668 | $ | 1,612 | ||||||
Weighted-average basic
shares outstanding |
2,779.9 | 2,008.6 | 1,984.3 | |||||||||
Add: Broad-based options |
5.4 | 4.1 | 2.8 | |||||||||
Key employee options |
65.3 | 42.4 | 22.0 | |||||||||
Weighted-average diluted
shares outstanding |
2,850.6 | 2,055.1 | 2,009.1 | |||||||||
Net income per share(b) |
$ | 1.55 | $ | 3.24 | $ | 0.80 | ||||||
| (a) | 2004 results include six months of the combined Firm’s results and six months of
heritage
JPMorgan Chase results. All other periods reflect the results of heritage JPMorgan Chase only. |
|
| (b) | Options issued under employee benefit plans to purchase 300 million, 335 million and 362
million shares of common stock were outstanding for the years ended 2004, 2003 and
2002, respectively, but were not included in the computation of diluted EPS because the
options’ exercise prices were greater than the average market price of the common shares. |
Note 21 – Accumulated other comprehensive income (loss)
Accumulated other comprehensive income includes the after-tax change in unrealized gains and losses on AFS securities, cash flow hedging activities and foreign currency translation adjustments (including the impact of related derivatives).
| Accumulated | ||||||||||||||||
| Year ended | Unrealized | Cash | other | |||||||||||||
| December 31,(a) | gains (losses) | Translation | flow | comprehensive | ||||||||||||
| (in millions) | on AFS securities(b) | adjustments | hedges | income (loss) | ||||||||||||
Balance at
December 31, 2001 |
$ | (135 | ) | $ | (2 | ) | $ | (305 | ) | $ | (442 | ) | ||||
Net change |
866 | (4 | ) | 807 | 1,669 | |||||||||||
Balance at
December 31, 2002 |
731 | (6 | ) | 502 | 1,227 | |||||||||||
Net change |
(712 | ) | — | (545 | ) | (1,257 | ) | |||||||||
Balance at
December 31, 2003 |
19 | (6 | ) | (43 | ) | (30 | ) | |||||||||
Net change |
(80) | (c) | (2) | (d) | (96 | ) | (178 | ) | ||||||||
Balance at
December 31, 2004 |
$ | (61 | ) | $ | (8) | (e) | $ | (139 | ) | $ | (208 | ) | ||||
| (a) | 2004 results include six months of the combined Firm’s results and six months of heritage
JPMorgan Chase results. All other periods reflect the results of heritage JPMorgan Chase only. |
|
| (b) | Represents the after-tax difference between the fair value and amortized cost of the AFS
securities portfolio and retained interests in securitizations recorded in Other assets. |
|
| (c) | The net change during 2004 is primarily due to increasing rates and recognition of
unrealized gains through securities sales. |
|
| (d) | Includes $280 million of after-tax gains (losses) on foreign currency translation from operations for which the functional currency is other than the U.S. dollar, offset by $(282) million
of after-tax gains (losses) on hedges. |
|
| (e) | Includes after-tax gains and losses on foreign currency translation, including related hedge
results from operations, for which the functional currency is other than the U.S. dollar. |
| 114 | JPMorgan Chase & Co./2004 Annual Report |
Table of Contents
The following table presents the after-tax changes in net unrealized holdings gains (losses) and the reclassification adjustments in unrealized gains and losses on AFS securities and cash flow hedges. Reclassification adjustments include amounts recognized in net income during the current year that had been previously recorded in Other comprehensive income.
| Year ended December 31, (in millions)(a) | 2004 | 2003 | 2002 | |||||||||
Unrealized gains (losses) on AFS securities: |
||||||||||||
Net unrealized holdings gains (losses)
arising during the period, net of taxes(b) |
$ | 41 | $ | 149 | $ | 1,090 | ||||||
Reclassification adjustment for gains
included in income, net of taxes(c) |
(121 | ) | (861 | ) | (224 | ) | ||||||
Net change |
$ | (80 | ) | $ | (712 | ) | $ | 866 | ||||
Cash flow hedges: |
||||||||||||
Net unrealized holdings gains (losses)
arising during the period, net of taxes(d) |
$ | 34 | $ | 86 | $ | 663 | ||||||
Reclassification adjustment for (gains) losses
included in income, net of taxes(e) |
(130 | ) | (631 | ) | 144 | |||||||
Net change |
$ | (96 | ) | $ | (545 | ) | $ | 807 | ||||
| (a) | 2004 results include six months of the combined Firm’s results and six months of heritage
JPMorgan Chase results. All other periods reflect the results of heritage JPMorgan Chase only. |
|
| (b) | Net of tax expense of $27 million for 2004, $92 million for 2003 and $758
million for 2002. |
|
| (c) | Net of tax expense of $79 million for 2004, $528 million for 2003 and $156 million for
2002. |
|
| (d) | Net of tax expense of $23 million for 2004, $60 million for 2003 and $461 million for 2002. |
|
| (e) | Net of tax expense of $86 million for 2004 and $438 million for 2003, and net of tax benefit of $100 million for 2002. |
Note 22 – Income taxes
JPMorgan Chase and its eligible subsidiaries file a consolidated U.S. federal income tax return. JPMorgan Chase uses the asset-and-liability method required by SFAS 109 to provide income taxes on all transactions recorded in the Consolidated financial statements. This requires that income taxes reflect the expected future tax consequences of temporary differences between the carrying amounts of assets or liabilities for book and tax purposes. Accordingly, a deferred tax liability or asset for each temporary difference is determined based on the tax rates that the Firm expects to be in effect when the underlying items of income and expense are realized. JPMorgan Chase’s expense for income taxes includes the current and deferred portions of that expense. A valuation allowance is established to reduce deferred tax assets to the amount the Firm expects to realize.
Due to the inherent complexities arising from the nature of the Firm’s businesses, and from conducting business and being taxed in a substantial number of jurisdictions, significant judgments and estimates are required to be made. Thus, the Firm’s final tax-related assets and liabilities may ultimately be different.
Deferred income tax expense (benefit) results from differences between assets and liabilities measured for financial reporting and for income-tax return purposes. The significant components of deferred tax assets and liabilities are reflected in the following table:
| December 31, (in millions) | 2004 | 2003(a) | ||||||
Deferred tax assets |
||||||||
Allowance for other than loan losses |
$ | 3,711 | $ | 1,152 | ||||
Allowance for loan losses |
2,739 | 1,410 | ||||||
Employee benefits |
2,677 | 2,245 | ||||||
Non-U.S. operations |
743 | 741 | ||||||
Gross deferred tax assets |
$ | 9,870 | $ | 5,548 | ||||
Deferred tax liabilities |
||||||||
Leasing transactions |
$ | 4,266 | $ | 3,703 | ||||
Depreciation and amortization |
3,558 | 1,037 | ||||||
Fee income |
1,162 | 387 | ||||||
Non-U.S. operations |
1,144 | 687 | ||||||
Fair value adjustments |
186 | 538 | ||||||
Other, net |
348 | 68 | ||||||
Gross deferred tax liabilities |
$ | 10,664 | $ | 6,420 | ||||
Valuation allowance |
$ | 150 | $ | 200 | ||||
Net deferred tax liability |
$ | (944 | ) | $ | (1,072 | ) | ||
| (a) | Heritage JPMorgan Chase only. |
A valuation allowance has been recorded in accordance with SFAS 109, primarily relating to deferred tax assets associated with non-U.S. operations.
The components of income tax expense included in the Consolidated statements of income were as follows:
| Year ended December 31, (in millions)(a) | 2004 | 2003 | 2002 | |||||||||
Current income tax expense (benefit) |
||||||||||||
U.S. federal |
$ | 1,695 | $ | 965 | $ | (1,334 | ) | |||||
Non-U.S. |
679 | 741 | 461 | |||||||||
U.S. state and local |
181 | 175 | 93 | |||||||||
Total current expense (benefit) |
2,555 | 1,881 | (780 | ) | ||||||||
Deferred income tax (benefit) expense |
||||||||||||
U.S. federal |
(382 | ) | 1,341 | 1,630 | ||||||||
Non-U.S. |
(322 | ) | 14 | (352 | ) | |||||||
U.S. state and local |
(123 | ) | 73 | 358 | ||||||||
Total deferred (benefit) expense |
(827 | ) | 1,428 | 1,636 | ||||||||
Total income tax expense |
$ | 1,728 | $ | 3,309 | $ | 856 | ||||||
| (a) | 2004 results include six months of the combined Firm’s results and six months of heritage
JPMorgan Chase results. All other periods reflect the results of heritage JPMorgan Chase only. |
The preceding table does not reflect the tax effects of unrealized gains and losses on AFS securities, SFAS 133 hedge transactions and certain tax benefits associated with the Firm’s employee stock plans. The tax effect of these items is recorded directly in Stockholders’ equity. Stockholders’ equity increased by $190 million and $898 million in 2004 and 2003, respectively, and decreased by $1.1 billion in 2002 as a result of these tax effects.
U.S. federal income taxes have not been provided on the undistributed earnings of certain non-U.S. subsidiaries, to the extent that such earnings have been reinvested abroad for an indefinite period of time. For 2004, such earnings approximated $369 million on a pre-tax basis. At December 31, 2004, the cumulative amount of undistributed earnings in these subsidiaries approximated $2.6 billion. It is not practicable at this time to determine the income tax liability that would result upon repatriation of these earnings.
| JPMorgan Chase & Co./2004 Annual Report | 115 |
Table of Contents
Notes to consolidated financial statements
On October 22, 2004, the American Jobs Creation Act of 2004 (the “Act”) was signed into law. The Act creates a temporary incentive for U.S. companies to repatriate accumulated foreign earnings at a substantially reduced U.S. effective tax rate by providing a dividends received deduction on the repatriation of certain foreign earnings to the U.S. taxpayer (the “repatriation provision”). The new deduction is subject to a number of limitations and requirements and is effective for either the 2004 or 2005 tax years for calendar year taxpayers. The range of possible amounts that may be considered for repatriation under this provision is between zero and $1.9 billion. The Firm is currently assessing the impact of the repatriation provision and, at this time, cannot reasonably estimate the related range of income tax effects of such repatriation provision. Accordingly, the Firm has not reflected the tax effect of the repatriation provision in income tax expense or income tax liabilities.
The tax expense applicable to securities gains and losses for the years 2004, 2003 and 2002 was $126 million, $477 million and $531 million, respectively.
A reconciliation of the applicable statutory U.S. income tax rate to the effective tax rate for the past three years is shown in the following table:
| Year ended December 31,(a) | 2004 | 2003 | 2002 | |||||||||
Statutory U.S. federal tax rate |
35.0 | % | 35.0 | % | 35.0 | % | ||||||
Increase (decrease) in tax rate resulting from: |
||||||||||||
U.S. state and local income taxes, net of
federal income tax benefit |
0.6 | (b) | 2.1 | 11.6 | ||||||||
Tax-exempt income |
(4.1 | ) | (2.4 | ) | (6.2 | ) | ||||||
Non-U.S. subsidiary earnings |
(1.3 | ) | (0.7 | ) | (2.2 | ) | ||||||
Business tax credits |
(4.1 | ) | (0.9 | ) | (3.5 | ) | ||||||
Other, net |
1.8 | (0.1 | ) | (0.7 | ) | |||||||
Effective tax rate |
27.9 | % | 33.0 | % | 34.0 | % | ||||||
| (a) | 2004 results include six months of the combined Firm’s results and six months of heritage
JPMorgan Chase results. All other periods reflect the results of heritage JPMorgan Chase only. |
|
| (b) | The decrease in 2004 is attributable to changes in the proportion of income subject to
different state and local taxes. |
The following table presents the U.S. and non-U.S. components of income before income tax expense:
| Year ended December 31, (in millions)(a) | 2004 | 2003 | 2002 | |||||||||
U.S. |
$ | 3,817 | $ | 7,333 | $1,834 | |||||||
Non-U.S.(b) |
2,377 | 2,695 | 685 | |||||||||
Income before income tax expense |
$ | 6,194 | $ | 10,028 | $2,519 | |||||||
| (a) | 2004 results include six months of the combined Firm’s results and six months
of heritage
JPMorgan Chase results. All other periods reflect the results of heritage JPMorgan Chase only. |
|
| (b) | For purposes of this table, non-U.S. income is defined as income generated from operations
located outside the United States. |
Note 23 – Restrictions on cash and intercompany funds transfers
The Federal Reserve Board requires depository institutions to maintain cash reserves with a Federal Reserve Bank. The average amount of reserve balances deposited by the Firm’s bank subsidiaries with various Federal Reserve Banks was approximately $3.8 billion in 2004 and $2.6 billion in 2003.
Restrictions imposed by federal law prohibit JPMorgan Chase and certain other affiliates from borrowing from banking subsidiaries unless the loans are secured in specified amounts. Such secured loans to the Firm or to other affiliates are generally limited to 10% of the banking subsidiary’s total capital, as determined by the risk-based capital guidelines; the aggregate amount of all such loans is limited to 20% of the banking subsidiary’s total capital.
The principal sources of JPMorgan Chase’s income (on a parent company-only basis) are dividends and interest from JPMorgan Chase Bank and the other banking and nonbanking subsidiaries of JPMorgan Chase. In addition to dividend restrictions set forth in statutes and regulations, the FRB, the Office of the Comptroller of the Currency (“OCC”) and the Federal Deposit Insurance Corporation (“FDIC”) have authority under the Financial Institutions Supervisory Act to prohibit or to limit the payment of dividends by the banking organizations they supervise, including JPMorgan Chase and its subsidiaries that are banks or bank holding companies, if, in the banking regulator’s opinion, payment of a dividend would constitute an unsafe or unsound practice in light of the financial condition of the banking organization.
At January 1, 2005 and 2004, JPMorgan Chase’s bank subsidiaries could pay, in the aggregate, $6.2 billion and $4.4 billion, respectively, in dividends to their respective bank holding companies without prior approval of their relevant banking regulators. Dividend capacity in 2005 will be supplemented by the banks’ earnings during the year.
In compliance with rules and regulations established by U.S. and non-U.S. regulators, as of December 31, 2004 and 2003, cash in the amount of $4.3 billion and $3.5 billion, respectively, and securities with a fair value of $3.6 billion and $3.1 billion, respectively, were segregated in special bank accounts for the benefit of securities and futures brokerage customers.
Note 24 – Capital
There are two categories of risk-based capital: Tier 1 capital and Tier 2 capital. Tier 1 capital includes common stockholders’ equity, qualifying preferred stock and minority interest less goodwill and other adjustments. Tier 2 capital consists of preferred stock not qualifying as Tier 1, subordinated long-term debt and other instruments qualifying as Tier 2, and the aggregate allowance for credit losses up to a certain percentage of risk-weighted assets. Total regulatory capital is subject to deductions for investments in certain subsidiaries. Under the risk-based capital guidelines of the FRB, JPMorgan Chase is required to maintain minimum ratios of Tier 1 and total (Tier 1 plus Tier 2) capital to risk-weighted assets, as well as minimum leverage ratios (which are defined as Tier 1 capital to average adjusted on-balance sheet assets). Failure to meet these minimum requirements could cause the FRB to take action. Bank subsidiaries also are subject to these capital requirements by their respective primary regulators. As of December 31, 2004 and 2003, JPMorgan Chase and its primary banking subsidiaries met all capital requirements to which each was subject.
| 116 | JPMorgan Chase & Co./2004 Annual Report |
Table of Contents
The following table presents the risk-based capital ratios for JPMorgan Chase and its significant banking subsidiaries at December 31, 2004 and 2003:
| Tier 1 | Total | Risk-weighted | Adjusted | Tier 1 | Total | Tier 1 | ||||||||||||||||||||||
| (in millions, except ratios) | capital | capital | assets(b) | average assets(c) | capital ratio | capital ratio | leverage ratio | |||||||||||||||||||||
December 31, 2004 |
||||||||||||||||||||||||||||
JPMorgan Chase & Co.(a) |
$ | 68,621 | $ | 96,807 | $ | 791,373 | $ | 1,102,456 | 8.7 | % | 12.2 | % | 6.2 | % | ||||||||||||||
JPMorgan Chase Bank, N.A. |
55,489 | 78,478 | 670,295 | 922,877 | 8.3 | 11.7 | 6.0 | |||||||||||||||||||||
Chase Bank USA, N.A. |
8,726 | 11,186 | 86,955 | 71,797 | 10.0 | 12.9 | 12.2 | |||||||||||||||||||||
| December 31, 2003(d) JPMorgan Chase & Co.(a) |
$ | 43,167 | $ | 59,816 | $ | 507,456 | $ | 765,910 | 8.5 | % | 11.8 | % | 5.6 | % | ||||||||||||||
JPMorgan Chase Bank |
34,972 | 45,290 | 434,218 | 628,076 | 8.1 | 10.4 | 5.6 | |||||||||||||||||||||
Chase Manhattan Bank USA, N.A. |
4,950 | 6,939 | 48,030 | 34,565 | 10.3 | 14.4 | 14.3 | |||||||||||||||||||||
Well-capitalized ratios(e) |
6.0 | % | 10.0 | % | 5.0 | %(f) | ||||||||||||||||||||||
Minimum capital ratios(e) |
4.0 | 8.0 | 3.0 | |||||||||||||||||||||||||
| (a) | Asset and capital amounts for JPMorgan Chase’s banking subsidiaries reflect
intercompany transactions, whereas the respective amounts for JPMorgan Chase reflect the
elimination
of intercompany transactions. |
|
| (b) | Includes off-balance sheet risk-weighted assets in the amounts of $250.3 billion, $229.6
billion and $15.5 billion, respectively, at December 31, 2004, and $174.2 billion, $152.1
billion
and $13.3 billion, respectively, at December 31, 2003. |
|
| (c) | Average adjusted
assets for purposes of calculating the leverage ratio include total
average assets adjusted for unrealized gains/losses on securities,
less deductions for disallowed goodwill and other intangible assets,
investments in subsidiaries and the total adjusted carrying value of
nonfinancial equity investments that are subject to deductions from
Tier 1 capital. |
|
| (d) | Heritage JPMorgan Chase only. |
|
| (e) | As defined by the regulations issued by the FRB, FDIC and OCC. |
|
| (f) | Represents requirements for bank subsidiaries pursuant to regulations issued under the
Federal Deposit Insurance Corporation Improvement Act. There is no Tier 1 leverage component
in
the definition of a well-capitalized bank holding company. |
The following table shows the components of the Firm’s Tier 1 and total capital:
| December 31, (in millions) | 2004 | 2003(a) | ||||||
Tier 1 capital |
||||||||
Total stockholders’ equity |
$ | 105,653 | $ | 46,154 | ||||
Effect of net unrealized losses on AFS
securities and cash flow hedging activities |
200 | 24 | ||||||
Adjusted stockholders’ equity |
105,853 | 46,178 | ||||||
Minority interest(b) |
11,050 | 6,882 | ||||||
Less: Goodwill |
43,203 | 8,511 | ||||||
Investments in certain subsidiaries |
370 | 266 | ||||||
Nonqualifying intangible assets |
4,709 | 1,116 | ||||||
Tier 1 capital |
$ | 68,621 | $ | 43,167 | ||||
Tier 2 capital |
||||||||
Long-term debt and other instruments
qualifying as Tier 2 |
$ | 20,690 | $ | 12,128 | ||||
Qualifying allowance for credit losses |
7,798 | 4,777 | ||||||
Less: Investments in certain subsidiaries
and other |
302 | 256 | ||||||
Tier 2 capital |
$ | 28,186 | $ | 16,649 | ||||
Total qualifying capital |
$ | 96,807 | $ | 59,816 | ||||
| (a) | Heritage JPMorgan Chase only. |
|
| (b) | Primarily includes trust preferred securities of certain business trusts. |
Note 25 – Commitments and contingencies
At December 31, 2004, JPMorgan Chase and its subsidiaries were obligated under a number of noncancelable operating leases for premises and equipment used primarily for banking purposes. Certain leases contain rent escalation clauses for real estate taxes; they may also contain other operating expenses and renewal-option clauses calling for increased rents. No lease agreement imposes restrictions on the Firm’s ability to pay dividends, engage in debt or equity financing transactions, or enter into further lease agreements.
The following table shows required future minimum rental payments under operating leases with noncancelable lease terms that expire after December 31, 2004:
| Year ended December 31, (in millions) | ||||
2005 |
$ | 1,060 | ||
2006 |
979 | |||
2007 |
899 | |||
2008 |
838 | |||
2009 |
776 | |||
After |
5,301 | |||
Total minimum payments required |
9,853 | |||
Less: Sublease rentals under noncancelable subleases |
(689 | ) | ||
Net minimum payment required |
$ | 9,164 | ||
Total rental expense was as follows:
| Year ended December 31, (in millions)(a) | 2004 | 2003 | 2002 | |||||||||
Gross rentals |
$ | 1,187 | $ | 1,061 | $ | 1,012 | ||||||
Sublease rentals |
(158 | ) | (106 | ) | (134 | ) | ||||||
Net rental expense |
$ | 1,029 | $ | 955 | $ | 878 | ||||||
| (a) | 2004 results include six months of the combined Firm’s results and six months of heritage
JPMorgan Chase results. All other periods reflect the results of heritage JPMorgan Chase only. |
At December 31, 2004, assets were pledged to secure public deposits and for other purposes. The significant components of the assets pledged were as follows:
| December 31, (in billions) | 2004 | 2003(b) | ||||||
Reverse repurchase/securities
borrowing agreements |
$ | 238 | $ | 197 | ||||
Securities |
49 | 45 | ||||||
Loans |
75 | 48 | ||||||
Other(a) |
90 | 96 | ||||||
Total assets pledged |
$ | 452 | $ | 386 | ||||
| (a) | Primarily composed of trading assets. |
|
| (b) | Heritage JPMorgan Chase only. |
| JPMorgan Chase & Co./2004 Annual Report | 117 |
Table of Contents
Notes to consolidated financial statements
Litigation reserve
Note 26 – Accounting for derivative instruments and hedging activities
Derivative instruments enable end users to increase, reduce or alter exposure to credit or market risks. The value of a derivative is derived from its reference to an underlying variable or combination of variables such as equity, foreign exchange, credit, commodity or interest rate prices or indices. JPMorgan Chase makes markets in derivatives for its customers and also is an end-user of derivatives in order to manage the Firm’s exposure to credit and market risks.
SFAS 133, as amended by SFAS 138 and SFAS 149, establishes accounting and reporting standards for derivative instruments, including those used for trading and hedging activities, and derivative instruments embedded in other contracts. All free-standing derivatives, whether designated for hedging relationships or not, are required to be recorded on the balance sheet at fair value. The accounting for changes in value of a derivative depends on whether the contract is for trading purposes or has been designated and qualifies for hedge accounting. The majority of the Firm’s derivatives are entered into for trading purposes. The Firm also uses derivatives as an end user to hedge market exposures, modify the interest rate characteristics of related balance sheet instruments or meet longer-term investment objectives. Both trading and end-user derivatives are recorded at fair value in Trading assets and Trading liabilities as set forth in Note 3 on pages 90–91 of this Annual Report.
In order to qualify for hedge accounting, a derivative must be considered highly effective at reducing the risk associated with the exposure being hedged. Each derivative must be designated as a hedge, with documentation of the risk management objective and strategy, including identification of the hedging instrument, the hedged item and the risk exposure, and how effectiveness is to be assessed prospectively and retrospectively. The extent to which a hedging instrument is effective at achieving offsetting changes in fair value or cash flows must be assessed at least quarterly. Any ineffectiveness must be reported in current-period earnings. For certain types of hedge relationships meeting stringent criteria, SFAS 133’s “shortcut” method provides for an assumption of zero ineffectiveness. Under the shortcut method, quarterly effectiveness assessment is not required, and the entire change in the fair value of the hedging derivative is considered to be effective at achieving offsetting changes in fair values or cash flows. Due to the strict criteria of the shortcut method, the Firm’s use of this method is primarily limited to hedges of Long-term debt.
For qualifying fair value hedges, all changes in the fair value of the derivative and in the fair value of the item for the risk being hedged are recognized in earnings. If the hedge relationship is terminated, then the fair value adjustment to the hedged item continues to be reported as part of the basis of the item and is amortized to earnings as a yield adjustment. For qualifying cash flow hedges, the effective portion of the change in the fair value of the derivative is recorded
in Other comprehensive income and recognized in the income statement when the hedged cash flows affect earnings. The ineffective portions of cash flow hedges are immediately recognized in earnings. If the hedge relationship is terminated, then the change in fair value of the derivative recorded in Other comprehensive income is recognized when the cash flows that were hedged occur, consistent with the original hedge strategy. For hedge relationships discontinued because the forecasted transaction is not expected to occur according to the original strategy, any related derivative amounts recorded in Other comprehensive income are immediately recognized in earnings. For qualifying net investment hedges, changes in the fair value of the derivative or the revaluation of the foreign currency–denominated debt instrument are recorded in the translation adjustments account within Other comprehensive income. Any ineffective portions of net investment hedges are immediately recognized in earnings.
JPMorgan Chase’s fair value hedges primarily include hedges of fixed-rate long-term debt, loans, AFS securities and MSRs. Interest rate swaps are the most common type of derivative contract used to modify exposure to interest rate risk, converting fixed-rate assets and liabilities to a floating rate. Interest rate options, swaptions and forwards are also used in combination with interest rate swaps to hedge the fair value of the Firm’s MSRs. For a further discussion of MSR risk management activities, see Note 15 on pages 109–111 of this Annual Report. All amounts have been included in earnings consistent with the classification of the hedged item, primarily Net interest income, Mortgage fees and related income, and Other income. The Firm did not recognize any gains or losses during 2004 on commitments that no longer qualify as fair value hedges.
JPMorgan Chase also enters into derivative contracts to hedge exposure to variability in cash flows from floating-rate financial instruments and forecasted transactions, primarily the rollover of short-term assets and liabilities, and foreign currency-denominated revenues and expenses. Interest rate swaps, futures and forward contracts are the most common instruments used to reduce the impact of interest rate and foreign exchange rate changes on future earnings. All amounts affecting earnings have been recognized consistent with the classification of the hedged item, primarily Net interest income.
The Firm uses forward foreign exchange contracts and foreign currency-denominated debt instruments to protect the value of its net investments in foreign currencies in its non-U.S. subsidiaries. The portion of the hedging instruments excluded from the assessment of hedge effectiveness (forward points) is recorded in Net interest income.
The following table presents derivative instrument hedging-related activities for the periods indicated:
| Year ended December 31, (in millions)(a) | 2004 | 2003 | ||||||
Fair value hedge ineffective net gains/(losses)(b)
|
$ | 199 | $731(c) | |||||
Cash flow hedge ineffective net gains/(losses)(b)
|
— | (5 | ) | |||||
Cash flow hedging gains on forecasted
transactions that failed to occur
|
1 | — | ||||||
| (a) | 2004 results include six months of the combined Firm’s results and six months of
heritage
JPMorgan Chase results. 2003 reflects the results of heritage JPMorgan Chase only. |
|
| (b) | Includes ineffectiveness and the components of hedging instruments that have been
excluded from the assessment of hedge effectiveness. |
|
| (c) | Amount restated to include the ineffectiveness and amounts excluded from the assessment
of effectiveness associated with MSR hedging results. |
Over the next 12 months, it is expected that $157 million (after-tax) of net gains recorded in Other comprehensive income at December 31, 2004, will be recognized in earnings. The maximum length of time over which forecasted transactions are hedged is 10 years, related to core lending and borrowing activities.
| 118 | JPMorgan Chase & Co./2004 Annual Report |
Table of Contents
JPMorgan Chase does not seek to apply hedge accounting to all of its economic hedges. For example, the Firm does not apply hedge accounting to credit derivatives used to manage the credit risk of loans and commitments because of the difficulties in qualifying such contracts as hedges under SFAS 133. Similarly, the Firm does not apply hedge accounting to certain interest rate derivatives used as economic hedges.
Note 27 – Off-balance sheet lending-related financial instruments and guarantees
JPMorgan Chase utilizes lending-related financial instruments (e.g., commitments and guarantees) to meet the financing needs of its customers. The contractual amount of these financial instruments represents the maximum possible credit risk should the counterparty draw down the commitment or the Firm fulfill its obligation under the guarantee, and the counterparty subsequently failed to perform according to the terms of the contract. Most of these commitments and guarantees expire without a default occurring or without being drawn. As a result, the total contractual amount of these instruments is not, in the Firm’s view, representative of its actual future credit exposure or funding requirements. Further, certain commitments, primarily related to consumer financings, are cancelable, upon notice, at the option of the Firm.
To provide for the risk of loss inherent in wholesale-related contracts, an allowance for credit losses on lending-related commitments is maintained. See Note 12 on pages 102–103 of this Annual Report for a further discussion on the allowance for credit losses on lending-related commitments.
The following table summarizes the contractual amounts of off–balance sheet lending-related financial instruments and guarantees and the related allowance for credit losses on lending-related commitments at December 31, 2004 and 2003:
Off-balance sheet lending-related financial instruments
| Allowance for | ||||||||||||||||
| Contractual | lending-related | |||||||||||||||
| amount | commitments | |||||||||||||||
| December 31, (in millions) | 2004 | 2003 | (a) | 2004 | 2003 | (a) | ||||||||||
Consumer |
$ | 601,196 | $ | 181,198 | $ | 12 | $ | 4 | ||||||||
Wholesale: |
||||||||||||||||
Other unfunded commitments
to extend credit(b)(c)(d) |
$ | 225,152 | $ | 172,369 | $ | 185 | $ | 153 | ||||||||
Standby letters of credit
and guarantees(b) |
78,084 | 34,922 | 292 | 165 | ||||||||||||
Other letters of credit(b) |
6,163 | 4,192 | 3 | 2 | ||||||||||||
Total wholesale |
$ | 309,399 | $ | 211,483 | $ | 480 | $ | 320 | ||||||||
Total |
$ | 910,595 | $ | 392,681 | $ | 492 | $ | 324 | ||||||||
Customers’ securities lent |
$ | 215,972 | $ | 143,143 | NA | NA | ||||||||||
| (a) | Heritage JPMorgan Chase only. |
|
| (b) | Represents contractual amount net of risk participations totaling $26.4 billion and $16.5
billion at December 31, 2004 and 2003, respectively. |
|
| (c) | Includes unused advised lines of credit totaling $22.8 billion and $19.4 billion at December
31, 2004 and 2003, respectively, which are not legally binding. In regulatory filings with the
Federal Reserve Board, unused advised lines are not reportable. |
|
| (d) | Includes certain asset purchase agreements to the Firm’s administered multi-seller asset-backed commercial paper conduits of $31.8 billion and $11.7 billion at December 31, 2004
and 2003, respectively; excludes $31.7 billion and $6.3 billion at December 31, 2004 and
2003, respectively, of asset purchase agreements related to the Firm’s administered multi-seller asset-backed commercial paper conduits consolidated in accordance with FIN 46R,
as the underlying assets of the conduits are reported in the Firm’s Consolidated balance sheets.
It also includes $7.5 billion and $9.2 billion at December 31, 2004 and 2003, respectively, of
asset purchase agreements to structured wholesale loan vehicles and other third-party entities.
The allowance for credit losses on lending-related commitments related to these agreements was
insignificant at December 31, 2004 and 2003. |
FIN 45 establishes accounting and disclosure requirements for guarantees, requiring that a guarantor recognize, at the inception of a guarantee, a liability in an amount equal to the fair value of the obligation undertaken in issuing the guarantee. FIN 45 defines a guarantee as a contract that contingently requires the Firm to pay a guaranteed party, based on: (a) changes in an underlying asset, liability or equity security of the guaranteed party; or (b) a third party’s failure to perform under a specified agreement. The Firm considers the following off–balance sheet lending arrangements to be guarantees under FIN 45: certain asset purchase agreements, standby letters of credit and financial guarantees, securities lending indemnifications, certain indemnification agreements included within third-party contractual arrangements and certain derivative contracts. These guarantees are described in further detail below.
As of January 1, 2003, newly issued or modified guarantees that are not derivative contracts have been recorded on the Firm’s Consolidated balance sheets at their fair value at inception. The fair value of the obligation undertaken in issuing the guarantee at inception is typically equal to the net present value of the future amount of premium receivable under the contract. The Firm has recorded this amount in Other Liabilities with an offsetting entry recorded in Other Assets. As cash is received under the contract, it is applied to the premium receivable recorded in Other Assets, and the fair value of the liability recorded at inception is amortized into income as Lending & deposit related fees over the life of the guarantee contract. The amount of the liability related to guarantees recorded at December 31, 2004 and 2003, excluding the allowance for credit losses on lending-related commitments and derivative contracts discussed below, was approximately $341 million and $59 million, respectively.
Unfunded commitments to extend credit are agreements to lend only when a customer has complied with predetermined conditions, and they generally expire on fixed dates. The allowance for credit losses on wholesale lending-related commitments includes $185 million and $153 million at December 31, 2004 and 2003, respectively, related to unfunded commitments to extend credit. The majority of the Firm’s unfunded commitments are not guarantees as defined in FIN 45, except for certain asset purchase agreements. These asset-purchase agreements are principally used as a mechanism to provide liquidity to SPEs, primarily multi-seller conduits, as described in Note 14 on pages 106–109 of this Annual Report.
Certain asset purchase agreements can be exercised at any time by the SPE’s administrator, while others require a triggering event to occur. Triggering events include, but are not limited to, a need for liquidity, a market value decline of the assets or a downgrade in the rating of JPMorgan Chase Bank. These agreements may cause the Firm to purchase an asset from the SPE at an amount above the asset’s fair value, in effect providing a guarantee of the initial value of the reference asset as of the date of the agreement. In most instances, third-party credit enhancements of the SPE mitigate the Firm’s potential losses on these agreements. The allowance for credit losses on wholesale lending-related commitments related to these agreements was insignificant at December 31, 2004.
Standby letters of credit and financial guarantees are conditional lending commitments issued by JPMorgan Chase to guarantee the performance of a customer to a third party under certain arrangements, such as commercial paper facilities, bond financings, acquisition financings and similar transactions. Approximately 70% of these arrangements mature within three years. The Firm typically has recourse to recover from the customer any amounts paid under these guarantees; in addition, the Firm may hold cash or other highly liquid collateral to support these guarantees. At December 31, 2004 and 2003,
| JPMorgan Chase & Co./2004 Annual Report | 119 |
Table of Contents
Notes to consolidated financial statements
the Firm held collateral relating to $7.4 billion and $7.7 billion, respectively, of these arrangements. The allowance for credit losses on lending-related commitments at December 31, 2004 and 2003, included $292 million and $165 million, respectively, related to standby letters of credit and financial guarantees.
The Firm holds customers’ securities under custodial arrangements. At times, these securities are loaned to third parties, and the Firm issues securities lending indemnification agreements to the customer that protect the customer against the risk of loss if the third party fails to return the securities. To support these indemnification agreements, the Firm obtains from the third party cash or other highly liquid collateral with a market value exceeding 100% of the value of the loaned securities. At December 31, 2004 and 2003, the Firm held $221.6 billion and $146.7 billion, respectively, in collateral in support of these agreements.
In connection with issuing securities to investors, the Firm may enter into contractual arrangements with third parties that may require the Firm to make a payment to them in the event of a change in tax law or an adverse interpretation of tax law. In certain cases, the contract may also include a termination clause, which would allow the Firm to settle the contract at its fair value; thus, such a clause would not require the Firm to make a payment under the indemnification agreement. Even without the termination clause, management does not expect such indemnification agreements to have a material adverse effect on the consolidated financial condition of JPMorgan Chase. The Firm may also enter into indemnification clauses when it sells a business or assets to a third party, pursuant to which it indemnifies that third party for losses it may incur due to actions taken by the Firm prior to the sale. See below for more information regarding the Firm’s loan securitization activities. It is difficult to estimate the Firm’s maximum exposure under these indemnification arrangements, since this would require an assessment of future changes in tax law and future claims that may be made against the Firm that have not yet occurred. However, based on historical experience, management expects the risk of loss to be remote.
As part of the Firm’s loan securitization activities, as described in Note 13 on pages 103–106 of this Annual Report, the Firm provides representations and warranties that certain securitized loans meet specific requirements. The Firm may be required to repurchase the loans and/or indemnify the purchaser of the loans against losses due to any breaches of such representations or warranties. Generally, the maximum amount of future payments the Firm would be required to make under such repurchase and/or indemnification provisions would be equal to the current amount of assets held by such securitization-related SPEs as of December 31, 2004, plus, in certain circumstances, accrued and unpaid interest on such loans and certain expenses. The potential loss due to such repurchase and/or indemnity is mitigated by the due diligence the Firm performs to ensure that the assets comply with the requirements set forth in the representations and warranties. Historically, losses incurred on such repurchases and/or indemnifications have been insignificant, and therefore management expects the risk of material loss to be remote.
In connection with Card Services, the Firm is a partner with one of the leading companies in electronic payment services in two separate ventures, Chase Merchant Services and Paymentech (the “ventures”), the latter of which was acquired as a result of the Merger. These ventures provide merchant processing services in the United States and Canada. The ventures are each individually contingently liable for processed credit card sales transactions in the event of a dispute between the cardmember and a merchant. If a dispute is resolved in the cardmember’s favor, the ventures will credit or refund the amount to the cardmember and charge back the transaction to the merchant. If the ventures are unable to collect the amount from the merchant, the
ventures will bear the loss for the amount credited or refunded to the card-member. The ventures mitigate this risk by withholding settlement, or by obtaining escrow deposits or letters of credit from certain merchants. However, in the unlikely event that: 1) a merchant ceases operations and is unable to deliver products, services or a refund; 2) the ventures do not have sufficient collateral from the merchants to provide customer refunds; and 3) the ventures do not have sufficient financial resources to provide customer refunds, the Firm would be liable to refund the cardholder in proportion to its approximate equity interest in the ventures. For the year ended December 31, 2004, the ventures incurred aggregate credit losses of $7.1 million on $396 billion of aggregate volume processed, of which the Firm shared liability only on $205 billion of aggregate volume processed. At December 31, 2004, the ventures held $620 million of collateral. In 2003, the Chase Merchant Services venture incurred aggregate credit losses of $2.0 million on $260 billion of aggregate volume processed, of which the Firm shared liability only on $77 billion of aggregate volume processed. At December 31, 2003, the Chase Merchant Services venture held $242 million of collateral. The Firm believes that, based on historical experience and the collateral held by the ventures, the fair value of the guarantee would not be materially different from the credit loss allowance recorded by the ventures; therefore, the Firm has not recorded any allowance for losses in excess of the allowance recorded by the ventures.
The Firm is a member of several securities and futures exchanges and clearinghouses both in the United States and overseas. Membership in some of these organizations requires the Firm to pay a pro rata share of the losses incurred by the organization as a result of the default of another member. Such obligation varies with different organizations. It may be limited to members who dealt with the defaulting member or to the amount (or a multiple of the amount) of the Firm’s contribution to a members’ guaranty fund, or, in a few cases, it may be unlimited. It is difficult to estimate the Firm’s maximum exposure under these membership agreements, since this would require an assessment of future claims that may be made against the Firm that have not yet occurred. However, based on historical experience, management expects the risk of loss to be remote.
In addition to the contracts described above, there are certain derivative contracts to which the Firm is a counterparty that meet the characteristics of a guarantee under FIN 45. These derivatives are recorded on the Consolidated balance sheets at fair value. These contracts include written put options that require the Firm to purchase assets from the option holder at a specified price by a specified date in the future, as well as derivatives that effectively guarantee the return on a counterparty’s reference portfolio of assets. The total notional value of the derivatives that the Firm deems to be guarantees was $53 billion and $50 billion at December 31, 2004 and 2003, respectively. The Firm reduces its exposures to these contracts by entering into offsetting transactions or by entering into contracts that hedge the market risk related to these contracts. The fair value related to these contracts was a derivative receivable of $180 million and $163 million, and a derivative payable of $622 million and $333 million at December 31, 2004 and 2003, respectively. Finally, certain written put options and credit derivatives permit cash settlement and do not require the option holder or the buyer of credit protection to own the reference asset. The Firm does not consider these contracts to be guarantees as described in FIN 45.
| 120 | JPMorgan Chase & Co./2004 Annual Report |
Table of Contents
Note 28 – Credit risk concentrations
Concentrations of credit risk arise when a number of customers are engaged in similar business activities or activities in the same geographic region, or when they have similar economic features that would cause their ability to meet contractual obligations to be similarly affected by changes in economic conditions.
JPMorgan Chase regularly monitors various segments of its credit risk portfolio to assess potential concentration risks and to obtain collateral when deemed necessary. In the Firm’s wholesale portfolio, risk concentrations are primarily evaluated by industry and by geographic region. In the consumer portfolio, concentrations are primarily evaluated by product and by U.S. geographic region.
For further information regarding on-balance sheet credit concentrations by major product and geography, see Note 11 on page 101 of this Annual Report. For information regarding concentrations of off-balance sheet lending-related financial instruments by major product, see Note 27 on page 119 of this Annual Report. More information about concentrations can be found in the following tables or discussion in the MD&A:
Wholesale exposure
|
Page 60 | |
Wholesale selected industry concentrations
|
Page 61 | |
Country exposure
|
Page 65 | |
Consumer real estate by geographic location
|
Page 67 | |
The table below presents both on-balance sheet and off-balance sheet wholesale- and consumer-related credit exposure as of December 31, 2004 and 2003:
| 2004 | 2003(c) | |||||||||||||||||||||||
| Credit | On-balance | Off-balance | Credit | On-balance | Off-balance | |||||||||||||||||||
| December 31, (in billions) | exposure | sheet(a) | sheet(b) | exposure | sheet(a) | sheet(b) | ||||||||||||||||||
Wholesale-related: |
||||||||||||||||||||||||
Banks and finance companies |
$ | 56.2 | $ | 25.7 | $ | 30.5 | $ | 62.7 | $ | 39.7 | $ | 23.0 | ||||||||||||
Real estate |
28.2 | 16.7 | 11.5 | 14.5 | 8.8 | 5.7 | ||||||||||||||||||
Healthcare |
22.0 | 4.5 | 17.5 | 11.3 | 1.8 | 9.5 | ||||||||||||||||||
Retail and consumer services |
21.7 | 6.0 | 15.7 | 14.5 | 4.2 | 10.3 | ||||||||||||||||||
Consumer products |
21.4 | 7.1 | 14.3 | 13.8 | 3.6 | 10.2 | ||||||||||||||||||
All other wholesale |
392.7 | 172.8 | 219.9 | 258.7 | 105.9 | 152.8 | ||||||||||||||||||
Total wholesale-related |
542.2 | 232.8 | 309.4 | 375.5 | 164.0 | 211.5 | ||||||||||||||||||
Consumer-related: |
||||||||||||||||||||||||
Home finance |
177.9 | 124.7 | 53.2 | 106.2 | 74.6 | 31.6 | ||||||||||||||||||
Auto & education finance |
67.9 | 62.7 | 5.2 | 45.8 | 43.2 | 2.6 | ||||||||||||||||||
Consumer & small business and other |
25.4 | 15.1 | 10.3 | 10.0 | 4.2 | 5.8 | ||||||||||||||||||
Credit card receivables(d) |
597.0 | 64.5 | 532.5 | 158.5 | 17.4 | 141.1 | ||||||||||||||||||
Total consumer-related |
868.2 | 267.0 | 601.2 | 320.5 | 139.4 | 181.1 | ||||||||||||||||||
Total exposure |
$ | 1,410.4 | $ | 499.8 | $ | 910.6 | $ | 696.0 | $ | 303.4 | $ | 392.6 | ||||||||||||
| (a) | Represents loans, derivative receivables, interests in purchased receivables and other
receivables. |
|
| (b) | Represents lending-related financial instruments. |
|
| (c) | Heritage JPMorgan Chase only. |
|
| (d) | Excludes $70.8 billion and $34.9 billion of securitized credit card receivables at December 31,
2004 and 2003, respectively. |
Note 29 – Fair value of financial instruments
The fair value of a financial instrument is the amount at which the instrument could be exchanged in a current transaction between willing parties, other than in a forced or liquidation sale.
The accounting for an asset or liability may differ based on the type of instrument and/or its use in a trading or investing strategy. Generally, the measurement framework in financial statements is one of the following:
| • | at fair value on the Consolidated balance sheets, with changes in fair value
recorded each period in the Consolidated statements of income; |
|||
| • | at fair value on the Consolidated balance sheets, with changes in fair value
recorded each period in a separate component of Stockholders’ equity and
as part of Other comprehensive income; |
|||
| • | at cost (less other-than-temporary impairments), with changes in fair value
not recorded in the financial statements but disclosed in the notes thereto;
or |
|||
| • | at the lower of cost or fair value. |
|||
The Firm has an established and well-documented process for determining fair values. Fair value is based on quoted market prices, where available. If listed prices or quotes are not available, fair value is based on internally-developed models that primarily use market-based or independent information as inputs to the valuation model. Valuation adjustments may be necessary to ensure that financial instruments are recorded at fair value. These adjustments include amounts to reflect counterparty credit quality, liquidity and concentration concerns and are based on defined methodologies that are applied consistently over time.
| JPMorgan Chase & Co./2004 Annual Report | 121 |
Table of Contents
Notes to consolidated financial statements
| • | Credit valuation adjustments are necessary when the market price (or
parameter) is not indicative of the credit quality of the counterparty. As few
derivative contracts are listed on an exchange, the majority of derivative
positions are valued using internally developed models that use as their
basis observable market parameters. Market practice is to quote parameters equivalent to a AA credit rating; thus, all counterparties are assumed
to have the same credit quality. An adjustment is therefore necessary to
reflect the credit quality of each derivative counterparty and to arrive at
fair value. Without this adjustment, derivative positions would not be
appropriately valued. |
|||
| • | Liquidity adjustments are necessary when the Firm may not be able to
observe a recent market price for a financial instrument that trades in inactive (or less active) markets. Thus, valuation adjustments for risk of loss due
to a lack of liquidity are applied to those positions to arrive at fair value.
The Firm tries to ascertain the amount of uncertainty in the initial valuation
based upon the liquidity or illiquidity, as the case may be, of the market in
which the instrument trades and makes liquidity adjustments to the financial instruments. The Firm measures the liquidity adjustment based on the
following factors: (1) the amount of time since the last relevant pricing
point; (2) whether there was an actual trade or relevant external quote;
and (3) the volatility of the principal component of the financial instrument. |
|||
| • | Concentration valuation adjustments are necessary to reflect the cost of
unwinding larger-than-normal market-size risk positions. The cost is determined based on the size of the adverse market move that is likely to occur
during the extended period required to bring a position down to a nonconcentrated level. An estimate of the period needed to reduce, without market disruption, a position to a nonconcentrated level is generally based on
the relationship of the position to the average daily trading volume of that
position. Without these adjustments, larger positions would be valued at a
price greater than the price at which the Firm could exit the positions. |
|||
Valuation adjustments are determined based on established policies and are controlled by a price verification group independent of the risk-taking function. Economic substantiation of models, prices, market inputs and revenue through price/input testing, as well as backtesting, is done to validate the appropriateness of the valuation methodology. Any changes to the valuation methodology are reviewed by management to ensure the changes are justified.
The methods described above may produce a fair value calculation that may not be indicative of net realizable value or reflective of future fair values. Furthermore, the use of different methodologies to determine the fair value of certain financial instruments could result in a different estimate of fair value at the reporting date.
Certain financial instruments and all nonfinancial instruments are excluded from the scope of SFAS 107. Accordingly, the fair value disclosures required by SFAS 107 provide only a partial estimate of the fair value of JPMorgan Chase. For example, the Firm has developed long-term relationships with its customers through its deposit base and credit card accounts, commonly referred to as core deposit intangibles and credit card relationships. In the opinion of management, these items, in the aggregate, add significant value to JPMorgan Chase, but their fair value is not disclosed in this Note.
The following describes the methodologies and assumptions used, by financial instrument, to determine fair value.
Financial assets
Assets for which fair value approximates carrying value
Assets where fair value differs from cost
Federal funds sold and securities purchased under resale agreements
Securities
Derivatives
| • | position valuation, principally based on liquid market pricing as evidenced
by exchange-traded prices, broker-dealer quotations or related input
parameters, which assume all counterparties have the same credit rating; |
|||
| • | credit valuation adjustments to the resulting portfolio valuation, to reflect
the credit quality of individual counterparties; and |
|||
| • | other fair value adjustments to take into consideration liquidity, concentration and other factors. |
|||
For those derivatives valued based on models with significant unobservable market parameters, the Firm defers the initial trading profit for these financial instruments. The deferred profit is recognized in Trading revenue on a systematic basis and when observable market data becomes available.
The fair value of derivative payables does not incorporate a valuation adjustment to reflect JPMorgan Chase’s credit quality.
Interests in purchased receivables
| 122 | JPMorgan Chase & Co./2004 Annual Report |
Table of Contents
Loans
| • | Fair value for the wholesale loan portfolio is estimated primarily using the
cost of credit derivatives, which is adjusted to account for the differences
in recovery rates between bonds, on which the cost of credit derivatives is
based, and loans. |
|||
| • | Fair values for consumer installment loans (including automobile financings) and consumer real estate, for which market rates for comparable
loans are readily available, are based on discounted cash flows, adjusted
for prepayments. The discount rates used for consumer installment loans
are current rates offered by commercial banks. For consumer real estate,
secondary market yields for comparable mortgage-backed securities,
adjusted for risk, are used. |
|||
| • | Fair value for credit card receivables is based on discounted expected cash
flows. The discount rates used for credit card receivables incorporate only
the effects of interest rate changes, since the expected cash flows already
reflect an adjustment for credit risk. |
|||
| • | The fair value of loans in the held-for-sale and trading portfolios is generally based on observable market prices and on prices of similar instruments,
including bonds, credit derivatives and loans with similar characteristics. If
market prices are not available, the fair value is based on the estimated cash
flows adjusted for credit risk; that risk is discounted, using a rate appropriate for each maturity that incorporates the effects of interest rate changes. |
|||
Other assets
For a discussion of the fair value methodology for private equity investments, see Note 9 on page 100 of this Annual Report.
For a discussion of the fair value methodology for MSRs, see Note 15 on pages 109-111 of this Annual Report.
Financial liabilities
Liabilities for which fair value approximates carrying value
Fair value of commercial paper, other borrowed funds, accounts payable and accrued liabilities is considered to approximate their respective carrying values due to their short-term nature.
Interest-bearing deposits
Federal funds purchased and securities sold under repurchase agreements
Beneficial interests issued by consolidated VIEs
Long-term debt-related instruments
Lending-related commitments
On this basis, at December 31, 2004 and 2003, the fair value of the Firm’s lending-related commitments approximated the Allowance for lending-related commitments of $492 million and $324 million, respectively.
| JPMorgan Chase & Co./2004 Annual Report | 123 |
Table of Contents
Notes to consolidated financial statements
The following table presents the carrying value and estimated fair value of financial assets and liabilities valued under SFAS 107; accordingly, certain assets and liabilities that are not considered financial instruments are excluded from the table.
| 2004 | 2003(a)(b) | |||||||||||||||||||||||
| Carrying | Estimated | Appreciation/ | Carrying | Estimated | Appreciation/ | |||||||||||||||||||
| December 31, (in billions) | value | fair value | (depreciation) | value | fair value | (depreciation) | ||||||||||||||||||
Financial assets |
||||||||||||||||||||||||
Assets for which fair value approximates carrying value |
$ | 125.7 | $ | 125.7 | $ | — | $ | 84.6 | $ | 84.6 | $ | — | ||||||||||||
Federal funds sold and securities purchased under resale
agreements |
101.4 | 101.3 | (0.1 | ) | 76.9 | 77.2 | 0.3 | |||||||||||||||||
Trading assets |
288.8 | 288.8 | — | 252.9 | 252.9 | — | ||||||||||||||||||
Securities |
94.5 | 94.5 | — | 60.3 | 60.3 | — | ||||||||||||||||||
Loans: |
||||||||||||||||||||||||
Wholesale, net of allowance for loan losses |
132.0 | 134.6 | 2.6 | 73.2 | 74.5 | 1.3 | ||||||||||||||||||
Consumer, net of allowance for loan losses |
262.8 | 262.5 | (0.3 | ) | 137.0 | 138.2 | 1.2 | |||||||||||||||||
Interests in purchased receivables |
31.7 | 31.8 | 0.1 | 4.8 | 4.8 | — | ||||||||||||||||||
Other assets |
50.4 | 51.1 | 0.7 | 61.0 | 61.5 | 0.5 | ||||||||||||||||||
Total financial assets |
$ | 1,087.3 | $ | 1,090.3 | $ | 3.0 | $ | 750.7 | $ | 754.0 | $ | 3.3 | ||||||||||||
Financial liabilities |
||||||||||||||||||||||||
Liabilities for which fair value approximates carrying value |
$ | 228.8 | $ | 228.8 | $ | — | $ | 146.6 | $ | 146.6 | $ | — | ||||||||||||
Interest-bearing deposits |
385.3 | 385.5 | (0.2 | ) | 247.0 | 247.1 | (0.1 | ) | ||||||||||||||||
Federal funds purchased and securities
sold under repurchase agreements |
127.8 | 127.8 | — | 113.5 | 113.6 | (0.1 | ) | |||||||||||||||||
Trading liabilities |
151.2 | 151.2 | — | 149.4 | 149.4 | — | ||||||||||||||||||
Beneficial interests issued by consolidated VIEs |
48.1 | 48.0 | 0.1 | 12.3 | 12.3 | — | ||||||||||||||||||
Long-term debt-related instruments |
105.7 | 107.7 | (2.0 | ) | 54.8 | 57.0 | (2.2 | ) | ||||||||||||||||
Total financial liabilities |
$ | 1,046.9 | $ | 1,049.0 | $ | (2.1 | ) | $ | 723.6 | $ | 726.0 | $ | (2.4 | ) | ||||||||||
Net appreciation |
$ | 0.9 | $ | 0.9 | ||||||||||||||||||||
| (a) | Heritage JPMorgan Chase only. |
|
| (b) | Amounts have been revised to reflect the current year’s presentation. |
| 124 | JPMorgan Chase & Co. / 2004 Annual Report |
Table of Contents
Note 30 – International operations
The following table presents income statement information of JPMorgan Chase by major geographic area. The Firm defines international activities as business transactions that involve customers residing outside of the United States, and the information presented below is based primarily on the domicile of the customer. However, many of the Firm’s U.S. operations serve international businesses.
As the Firm’s operations are highly integrated, estimates and subjective assumptions have been made to apportion revenue and expense between U.S. and international operations. These estimates and assumptions are consistent with the allocations used for the Firm’s segment reporting as set forth in Note 31 on pages 126-127 of this Annual Report.
The Firm’s long-lived assets for the periods presented are not considered by management to be significant in relation to total assets. The majority of the Firm’s long-lived assets are located in the United States.
| Income before | ||||||||||||||||
| For the year ended December 31, (in millions)(a) | Revenue | (b) | Expense | (c) | income taxes | Net income | ||||||||||
2004 |
||||||||||||||||
Europe/Middle East and Africa |
$ | 6,566 | $ | 4,635 | $ | 1,931 | $ | 1,305 | ||||||||
Asia and Pacific |
2,631 | 1,766 | 865 | 547 | ||||||||||||
Latin America and the Caribbean |
816 | 411 | 405 | 255 | ||||||||||||
Other |
112 | 77 | 35 | 25 | ||||||||||||
Total international |
10,125 | 6,889 | 3,236 | 2,132 | ||||||||||||
Total U.S. |
32,972 | 30,014 | 2,958 | 2,334 | ||||||||||||
Total |
$ | 43,097 | $ | 36,903 | $ | 6,194 | $ | 4,466 | ||||||||
2003 |
||||||||||||||||
Europe/Middle East and Africa |
$ | 6,344 | $ | 4,076 | $ | 2,268 | $ | 1,467 | ||||||||
Asia and Pacific |
1,902 | 1,772 | 130 | 91 | ||||||||||||
Latin America and the Caribbean |
1,000 | 531 | 469 | 287 | ||||||||||||
Other |
50 | 17 | 33 | 34 | ||||||||||||
Total international |
9,296 | 6,396 | 2,900 | 1,879 | ||||||||||||
Total U.S. |
24,088 | 16,960 | 7,128 | 4,840 | ||||||||||||
Total |
$ | 33,384 | $ | 23,356 | $ | 10,028 | $ | 6,719 | ||||||||
2002 |
||||||||||||||||
Europe/Middle East and Africa |
$ | 5,120 | $ | 4,882 | $ | 238 | $ | 157 | ||||||||
Asia and Pacific |
1,900 | 1,820 | 80 | 53 | ||||||||||||
Latin America and the Caribbean |
685 | 557 | 128 | 85 | ||||||||||||
Other |
42 | 34 | 8 | 5 | ||||||||||||
Total international |
7,747 | 7,293 | 454 | 300 | ||||||||||||
Total U.S. |
21,867 | 19,802 | 2,065 | 1,363 | ||||||||||||
Total |
$ | 29,614 | $ | 27,095 | $ | 2,519 | $ | 1,663 | ||||||||
| (a) | 2004 results include six months of the combined Firm’s results and six months of heritage
JPMorgan Chase results. All other periods reflect the results of heritage JPMorgan Chase only. |
|
| (b) | Revenue is composed of Net interest income and noninterest revenue. |
|
| (c) | Expense is composed of Noninterest expense and Provision for credit losses. |
| JPMorgan Chase & Co. / 2004 Annual Report | 125 |
Table of Contents
Notes to consolidated financial statements
Note 31 – Business segments
JPMorgan Chase is organized into six major reportable business segments: the Investment Bank, Retail Financial Services, Card Services, Commercial Banking, Treasury & Securities Services and Asset & Wealth Management, as well as a Corporate segment. The segments are based on the products and services provided or the type of customer served, and they reflect the manner in which financial information is currently evaluated by management. Results of these lines of business are presented on an operating basis. For a definition of operating basis, see the footnotes to the table below. For a further discussion concerning JPMorgan Chase’s business segments, see Business segment results on pages 28-29 of this Annual Report.
In connection with the Merger, business segment reporting was realigned to reflect the new business structure of the combined Firm. Treasury was transferred from the Investment Bank into Corporate. The segment formerly known as Chase Financial Services had been comprised of Chase Home Finance, Chase Cardmember Services, Chase Auto Finance, Chase Regional Banking and Chase Middle Market; as a result of the Merger, this segment is now called Retail Financial Services and is comprised of Home Finance, Auto & Education Finance, Consumer & Small Business Banking and Insurance. Chase Middle Market moved into Commercial Banking, and Chase Cardmember Services is now its own segment called Card Services. Treasury & Securities Services remains unchanged. Investment Management & Private Banking has been renamed Asset & Wealth Management. JPMorgan Partners, which formerly was a stand-alone business segment, was moved into Corporate. Lastly,
Segment results and reconciliation(a) (table continued on next page)
| Year ended December 31,(b) | Investment Bank(e) | Retail Financial Services | Card Services(f) | Commercial Banking | ||||||||||||||||||||||||||||||||||||||||||||
| (in millions, except ratios) | 2004 | 2003 | 2002 | 2004 | 2003 | 2002 | 2004 | 2003 | 2002 | 2004 | 2003 | 2002 | ||||||||||||||||||||||||||||||||||||
Net interest income |
$ | 1,325 | $ | 1,667 | $ | 1,978 | $ | 7,714 | $ | 5,220 | $ | 3,823 | $ | 8,374 | $ | 5,052 | $ | 4,930 | $ | 1,692 | $ | 959 | $ | 999 | ||||||||||||||||||||||||
Noninterest revenue |
11,705 | 11,270 | 8,881 | 3,119 | 2,232 | 2,541 | 2,349 | 1,097 | 995 | 561 | 354 | 348 | ||||||||||||||||||||||||||||||||||||
Intersegment revenue(c) |
(425 | ) | (253 | ) | (177 | ) | (42 | ) | (24 | ) | (16 | ) | 22 | (5 | ) | (12 | ) | 121 | 39 | 18 | ||||||||||||||||||||||||||||
Total net revenue |
12,605 | 12,684 | 10,682 | 10,791 | 7,428 | 6,348 | 10,745 | 6,144 | 5,913 | 2,374 | 1,352 | 1,365 | ||||||||||||||||||||||||||||||||||||
Provision for credit losses |
(640 | ) | (181 | ) | 2,392 | 449 | 521 | 334 | 4,851 | 2,904 | 2,751 | 41 | 6 | 72 | ||||||||||||||||||||||||||||||||||
Credit
reimbursement (to)/from TSS(d) |
90 | (36 | ) | (82 | ) | — | — | — | — | — | — | — | — | — | ||||||||||||||||||||||||||||||||||
Merger costs |
— | — | — | — | — | — | — | — | — | — | — | — | ||||||||||||||||||||||||||||||||||||
Litigation reserve charge |
— | 100 | — | — | — | — | — | — | — | — | — | — | ||||||||||||||||||||||||||||||||||||
Excess real estate charge |
— | — | — | — | — | — | — | — | — | — | — | — | ||||||||||||||||||||||||||||||||||||
Other noninterest expense |
8,696 | 8,202 | 7,798 | 6,825 | 4,471 | 3,733 | 3,883 | 2,178 | 2,129 | 1,343 | 822 | 809 | ||||||||||||||||||||||||||||||||||||
Income (loss) before income tax expense |
4,639 | 4,527 | 410 | 3,517 | 2,436 | 2,281 | 2,011 | 1,062 | 1,033 | 990 | 524 | 484 | ||||||||||||||||||||||||||||||||||||
Income tax expense (benefit) |
1,691 | 1,722 | (3 | ) | 1,318 | 889 | 849 | 737 | 379 | 369 | 382 | 217 | 201 | |||||||||||||||||||||||||||||||||||
Net income (loss) |
$ | 2,948 | $ | 2,805 | $ | 413 | $ | 2,199 | $ | 1,547 | $ | 1,432 | $ | 1,274 | $ | 683 | $ | 664 | $ | 608 | $ | 307 | $ | 283 | ||||||||||||||||||||||||
Average equity |
$ | 17,290 | $ | 18,350 | $ | 19,134 | $ | 9,092 | $ | 4,220 | $ | 3,907 | $ | 7,608 | $ | 3,440 | $ | 3,444 | $ | 2,093 | $ | 1,059 | $ | 1,199 | ||||||||||||||||||||||||
Average assets |
473,121 | 436,488 | 429,866 | 185,928 | 147,435 | 114,248 | 94,741 | 51,406 | 49,648 | 36,435 | 16,460 | 15,973 | ||||||||||||||||||||||||||||||||||||
Return on average equity |
17 | % | 15 | % | 2 | % | 24 | % | 37 | % | 37 | % | 17 | % | 20 | % | 19 | % | 29 | % | 29 | % | 24 | % | ||||||||||||||||||||||||
Overhead ratio |
69 | 65 | 73 | 63 | 60 | 59 | 36 | 35 | 36 | 57 | 61 | 59 | ||||||||||||||||||||||||||||||||||||
| (a) | In addition to analyzing the Firm’s results on a reported basis,
management looks at results on an “operating basis,” which is a non-GAAP financial measure.
Operating basis starts with the reported U.S. GAAP results. In the case of the Investment Bank, the operating basis includes the
reclassification of net interest income related to trading activities to Trading revenue. In
the case of Card Services, refer to footnote (f). These adjustments do not change JPMorgan Chase’s reported net income.
Finally, operating basis excludes the Merger costs, the Litigation reserve charge and
accounting policy conformity adjustments related to the Merger, as management believes these items are not part of the
Firm’s normal daily business operations (and, therefore, not indicative of trends) and do not
provide meaningful comparisons with other periods. |
|
| (b) | 2004 results include six months of the combined Firm’s results and six months of heritage
JPMorgan Chase results. All other periods reflect the results of heritage JPMorgan Chase only. |
|
| (c) | Intersegment revenue includes intercompany revenue and revenue-sharing agreements,
net of intersegment expenses. Transactions between business segments are primarily
conducted at fair value. |
|
| (d) | TSS reimburses the IB for credit portfolio exposures the IB manages on behalf of
clients the segments share. At the time of the Merger, the reimbursement methodology was
revised to be based on pre-tax earnings, net of the cost of capital related to those exposures. Prior to the Merger, the
credit reimbursement was based on pre-tax earnings, plus the allocated capital associated with
the shared clients. |
|
| (e) | Segment operating results include the reclassification of Net interest income (“NII”)
related to trading activities to Trading revenue within Noninterest revenue, which
primarily impacts the Investment Bank. Trading-related NII reclassified to Trading revenue was $2.0 billion, $2.1 billion and
$1.9 billion for 2004, 2003 and 2002, respectively. These amounts are eliminated in
Corporate/reconciling items to arrive at NII and Noninterest revenue on a reported GAAP basis for JPMorgan Chase. |
|
| (f) | Operating results for Card Services exclude the impact of credit card securitizations on
revenue, provision for credit losses and average assets, as JPMorgan Chase treats the sold
receivables as if they were still on the balance sheet in evaluating the overall performance of the credit card
portfolio. The related securitization adjustments for 2004, 2003 and 2002 were: $5.3 billion,
$3.3 billion and $2.8 billion, respectively, in NII; $(2.4) billion, $(1.4) billion and $(1.4) billion,
respectively, in Noninterest revenue; $2.9 billion, $1.9 billion and $1.4 billion,
respectively, in Provision for credit losses;
and $51.1 billion, $32.4 billion and $26.5 billion, respectively, in Average assets. These
adjustments are eliminated in Corporate/reconciling items to arrive at the Firm’s reported GAAP
results. |
|
| (g) | Includes
$858 million of accounting policy conformity adjustments
consisting of approximately $1.4 billion related to the
decertification of the seller’s retained interest in credit card
securitizations, partially offset by a benefit of $584 million related to conforming wholesale and consumer provision methodologies for the combined Firm. |
|
| (h) | Merger costs attributed to the lines of business for 2004 were as follows: $74
million, Investment Bank; $201 million, Retail Financial Services; $79 million, Card
Services; $23 million, Commercial Banking; $68 million, Treasury & Securities Services;
$31 million, Asset & Wealth Management; and $889 million, Corporate. |
| 126 | JPMorgan Chase & Co./2004 Annual Report |
Table of Contents
Corporate is currently comprised of Private Equity (JPMorgan Partners and ONE Equity Partners), Treasury, as well as corporate support areas, which include Central Technology and Operations, Internal Audit, Executive Office, Finance, General Services, Human Resources, Marketing & Communications, Office of the General Counsel, Real Estate and Business Services, Risk Management and Strategy and Development.
Segment results, which are presented on an operating basis, reflect revenues on a tax-equivalent basis. The tax-equivalent gross-up for each business segment is based upon the level, type and tax jurisdiction of the earnings and assets within each business segment. Operating revenue for the Investment Bank includes tax-equivalent adjustments for income tax credits primarily related to affordable housing investments as well as tax-exempt
income from municipal bond investments. Information prior to the Merger has not been restated to conform with this new presentation. The amount of the tax-equivalent gross-up for each business segment is eliminated within the Corporate segment and was $(303) million, $(122) million and $(116) million for the years ended December 31, 2004, 2003 and 2002, respectively.
The following table provides a summary of the Firm’s segment results for 2004, 2003 and 2002 on an operating basis. The impact of credit card securitizations, merger costs, litigation charges and accounting policy conformity adjustments have been included in Corporate/reconciling items so that the total Firm results are on a reported basis. Segment results for periods prior to July 1, 2004, reflect heritage JPMorgan Chase-only results and have been restated to reflect the current business segment organization and reporting classifications.
(table continued from previous page)
| Corporate/ | ||||||||||||||||||||||||||||||||||||||||||||
| Treasury & Securities Services | Asset & Wealth Management | reconciling items(e)(f) | Total | |||||||||||||||||||||||||||||||||||||||||
| 2004 | 2003 | 2002 | 2004 | 2003 | 2002 | 2004 | 2003 | 2002 | 2004 | 2003 | 2002 | |||||||||||||||||||||||||||||||||
$1,383 |
$ | 947 | $ | 962 | $ | 796 | $ | 488 | $ | 467 | $ | (4,523 | ) | $ | (1,368 | ) | $ | (981 | ) | $ | 16,761 | $ | 12,965 | $ | 12,178 | |||||||||||||||||||
3,226 |
2,475 | 2,387 | 3,297 | 2,415 | 2,328 | 2,079 | 576 | (44 | ) | 26,336 | 20,419 | 17,436 | ||||||||||||||||||||||||||||||||
248 |
186 | 186 | 86 | 67 | 137 | (10 | ) | (10 | ) | (136 | ) | — | — | — | ||||||||||||||||||||||||||||||
4,857 |
3,608 | 3,535 | 4,179 | 2,970 | 2,932 | (2,454 | ) | (802 | ) | (1,161 | ) | 43,097 | 33,384 | 29,614 | ||||||||||||||||||||||||||||||
7 |
1 | 3 | (14 | ) | 35 | 85 | (2,150 | )(g) | (1,746 | ) | (1,306 | ) | 2,544 | 1,540 | 4,331 | |||||||||||||||||||||||||||||
(90 |
) | 36 | 82 | — | — | — | — | — | — | — | — | — | ||||||||||||||||||||||||||||||||
— |
— | — | — | — | — | 1,365 | (h) | — | 1,210 | 1,365 | — | 1,210 | ||||||||||||||||||||||||||||||||
— |
— | — | — | — | — | 3,700 | — | 1,300 | 3,700 | 100 | 1,300 | |||||||||||||||||||||||||||||||||
— |
— | — | — | — | — | — | — | 98 | — | — | 98 | |||||||||||||||||||||||||||||||||
4,113 |
3,028 | 2,771 | 3,133 | 2,486 | 2,408 | 1,301 | 529 | 508 | 29,294 | 21,716 | 20,156 | |||||||||||||||||||||||||||||||||
647 |
615 | 843 | 1,060 | 449 | 439 | (6,670 | ) | 415 | (2,971 | ) | 6,194 | 10,028 | 2,519 | |||||||||||||||||||||||||||||||
207 |
193 | 294 | 379 | 162 | 161 | (2,986 | ) | (253 | ) | (1,015 | ) | 1,728 | 3,309 | 856 | ||||||||||||||||||||||||||||||
$440 |
$ | 422 | $ | 549 | $ | 681 | $ | 287 | $ | 278 | $ | (3,684 | ) | $ | 668 | $ | (1,956 | ) | $ | 4,466 | $ | 6,719 | $ | 1,663 | ||||||||||||||||||||
$2,544 |
$ | 2,738 | $ | 2,700 | $ | 3,902 | $ | 5,507 | $ | 5,649 | $ | 33,112 | $ | 7,674 | $ | 5,335 | $ | 75,641 | $ | 42,988 | $ | 41,368 | ||||||||||||||||||||||
23,430 |
18,379 | 17,239 | 37,751 | 33,780 | 35,813 | 111,150 | 72,030 | 70,570 | 962,556 | 775,978 | 733,357 | |||||||||||||||||||||||||||||||||
17 |
% | 15 | % | 20 | % | 17 | % | 5 | % | 5 | % | NM | NM | NM | 6 | % | 16 | % | 4 | % | ||||||||||||||||||||||||
85 |
84 | 78 | 75 | 84 | 82 | NM | NM | NM | 80 | 65 | 77 | |||||||||||||||||||||||||||||||||
| JPMorgan Chase & Co./2004 Annual Report | 127 |
Table of Contents
Notes to consolidated financial statements
Note 32 – Parent company
Parent company – statements of income
| Year ended December 31, (in millions)(a) | 2004 | 2003 | 2002 | |||||||||
Income |
||||||||||||
Dividends from bank and bank
holding company subsidiaries(b) |
$ | 1,208 | $ | 2,436 | $ | 3,079 | ||||||
Dividends from nonbank subsidiaries(c) |
773 | 2,688 | 422 | |||||||||
Interest income from subsidiaries |
1,370 | 945 | 1,174 | |||||||||
Other interest income |
137 | 130 | 148 | |||||||||
Other income from subsidiaries, primarily fees: |
||||||||||||
Bank and bank holding company |
833 | 632 | 277 | |||||||||
Nonbank |
499 | 385 | 390 | |||||||||
Other income |
204 | (25 | ) | 264 | ||||||||
Total income |
5,024 | 7,191 | 5,754 | |||||||||
Expense |
||||||||||||
Interest expense to subsidiaries(c) |
603 | 422 | 405 | |||||||||
Other interest expense |
1,834 | 1,329 | 1,511 | |||||||||
Compensation expense |
353 | 348 | 378 | |||||||||
Other noninterest expense |
1,105 | 747 | 699 | |||||||||
Total expense |
3,895 | 2,846 | 2,993 | |||||||||
Income before income tax benefit and
undistributed net income of subsidiaries |
1,129 | 4,345 | 2,761 | |||||||||
Income tax benefit |
556 | 474 | 432 | |||||||||
Equity in undistributed net income (loss)
of subsidiaries |
2,781 | 1,900 | (1,530 | ) | ||||||||
Net income |
$ | 4,466 | $ | 6,719 | $ | 1,663 | ||||||
| Parent company - balance sheets | ||||||||
| December 31, (in millions) | 2004 | 2003(d) | ||||||
Assets |
||||||||
Cash with banks, primarily with bank subsidiaries |
$ | 513 | $ | 148 | ||||
Deposits with banking subsidiaries |
10,703 | 12,554 | ||||||
Securities purchased under resale agreements,
primarily with nonbank subsidiaries |
— | 285 | ||||||
Trading assets |
3,606 | 3,915 | ||||||
Available-for-sale securities |
2,376 | 2,099 | ||||||
Loans |
162 | 550 | ||||||
Advances to, and receivables from, subsidiaries: |
||||||||
Bank and bank holding company |
19,076 | 9,239 | ||||||
Nonbank |
34,456 | 24,489 | ||||||
Investment (at equity) in subsidiaries: |
||||||||
Bank and bank holding company |
105,599 | 43,853 | ||||||
Nonbank(c) |
17,701 | 10,399 | ||||||
Goodwill and other intangibles |
890 | 860 | ||||||
Other assets |
11,557 | 9,213 | ||||||
Total assets |
$ | 206,639 | $ | 117,604 | ||||
Liabilities and stockholders’ equity |
||||||||
Borrowings from, and payables to, subsidiaries(c) |
$ | 14,195 | $ | 9,488 | ||||
Other borrowed funds, primarily commercial paper |
15,050 | 16,560 | ||||||
Other liabilities |
6,309 | 4,767 | ||||||
Long-term debt(e) |
65,432 | 40,635 | ||||||
Total liabilities |
100,986 | 71,450 | ||||||
Stockholders’ equity |
105,653 | 46,154 | ||||||
Total liabilities and stockholders’ equity |
$ | 206,639 | $ | 117,604 | ||||
Parent company – statements of cash flows
| Year ended December 31, (in millions)(a) | 2004 | 2003 | 2002 | |||||||||
Operating activities |
||||||||||||
Net income |
$ | 4,466 | $ | 6,719 | $ | 1,663 | ||||||
Less: Net income of subsidiaries |
4,762 | 7,017 | 1,971 | |||||||||
Parent company net loss |
(296 | ) | (298 | ) | (308 | ) | ||||||
Add: Cash dividends from subsidiaries(b)(c) |
1,964 | 5,098 | 2,320 | |||||||||
Other, net |
(81 | ) | (272 | ) | (912 | ) | ||||||
Net cash provided by operating activities |
1,587 | 4,528 | 1,100 | |||||||||
Investing activities |
||||||||||||
Net cash change in: |
||||||||||||
Deposits with banking subsidiaries |
1,851 | (2,560 | ) | (3,755 | ) | |||||||
Securities purchased under resale agreements,
primarily with nonbank subsidiaries |
355 | 99 | (40 | ) | ||||||||
Loans |
407 | (490 | ) | (27 | ) | |||||||
Advances to subsidiaries |
(5,772 | ) | (3,165 | ) | 6,172 | |||||||
Investment (at equity) in subsidiaries |
(4,015 | ) | (2,052 | ) | (2,284 | ) | ||||||
Other, net |
11 | 12 | (37 | ) | ||||||||
Available-for-sale securities: |
||||||||||||
Purchases |
(392 | ) | (607 | ) | (1,171 | ) | ||||||
Proceeds from sales and maturities |
114 | 654 | 1,877 | |||||||||
Cash received in business acquisitions |
4,608 | — | — | |||||||||
Net cash (used in) provided by
investing activities |
(2,833 | ) | (8,109 | ) | 735 | |||||||
Financing activities |
||||||||||||
Net cash change in borrowings
from subsidiaries(c) |
941 | 2,005 | 573 | |||||||||
Net cash change in other borrowed funds |
(1,510 | ) | (2,104 | ) | (915 | ) | ||||||
Proceeds from the issuance of
long-term debt |
12,816 | 12,105 | 12,533 | |||||||||
Repayments of long-term debt |
(6,149 | ) | (6,733 | ) | (12,271 | ) | ||||||
Proceeds from the issuance of stock
and stock-related awards |
848 | 1,213 | 725 | |||||||||
Redemption of preferred stock |
(670 | ) | — | — | ||||||||
Treasury stock purchased |
(738 | ) | — | — | ||||||||
Cash dividends paid |
(3,927 | ) | (2,865 | ) | (2,784 | ) | ||||||
Net cash provided by (used in)
financing activities |
1,611 | 3,621 | (2,139 | ) | ||||||||
Net increase (decrease) in cash with banks |
365 | 40 | (304 | ) | ||||||||
Cash with banks
at the beginning of the year |
148 | 108 | 412 | |||||||||
Cash with banks at the end of
the year, primarily with bank subsidiaries |
$ | 513 | $ | 148 | $ | 108 | ||||||
Cash interest paid |
$ | 2,383 | $ | 1,918 | $ | 1,829 | ||||||
Cash income taxes paid |
$ | 701 | $ | 754 | $ | 592 | ||||||
| (a) | 2004 results include six months of the combined Firm’s results and six months of heritage
JPMorgan Chase results. All other periods reflect the results of heritage JPMorgan Chase only.
For a further discussion of the Merger, see Note 2 on pages 89-90 of this Annual Report. |
|
| (b) | Dividends in 2002 include a stock dividend of $1.2 billion from the mortgage business,
which was contributed to JPMorgan Chase Bank. |
|
| (c) | Subsidiaries include trusts that issued guaranteed capital debt securities (“issuer trusts”).
As a result of FIN 46, the Parent deconsolidated these trusts in 2003. The Parent received
dividends of $15 million and $11 million from the issuer trusts in 2004 and 2003, respectively. For a further discussion on these issuer trusts, see Note 17 on pages 112-113 of this
Annual Report. |
|
| (d) | Heritage JPMorgan Chase only. |
|
| (e) | At December 31, 2004, all debt that contractually matures in 2005 through 2009 totaled $10.8 billion, $10.5 billion, $9.4 billion, $6.8 billion and $9.2 billion, respectively. |
| 128 | JPMorgan Chase & Co./2004 Annual Report |
Table of Contents
Supplementary information
Selected quarterly financial data (unaudited)
| (in millions, except per share, ratio and headcount data) | 2004 | 2003(b) | ||||||||||||||||||||||||||||||||||||||||||||||
| As of or for the period ended | 4th(a) | 3rd(a) | 2nd(b) | 1st(b) | 4th | 3rd | 2nd | 1st | ||||||||||||||||||||||||||||||||||||||||
| Selected income statement data | ||||||||||||||||||||||||||||||||||||||||||||||||
| Net interest income | $ | 5,329 | $ | 5,452 | $ | 2,994 | $ | 2,986 | $ | 3,182 | $ | 3,198 | $ | 3,228 | $ | 3,357 | ||||||||||||||||||||||||||||||||
| Noninterest revenue | 7,621 | 7,053 | 5,637 | 6,025 | 4,924 | 4,582 | 5,840 | 5,073 | ||||||||||||||||||||||||||||||||||||||||
| Total net revenue | 12,950 | 12,505 | 8,631 | 9,011 | 8,106 | 7,780 | 9,068 | 8,430 | ||||||||||||||||||||||||||||||||||||||||
| Provision for credit losses | 1,157 | 1,169 | 203 | 15 | 139 | 223 | 435 | 743 | ||||||||||||||||||||||||||||||||||||||||
Noninterest expense before Merger costs and Litigation reserve charge |
8,863 | 8,625 | 5,713 | 6,093 | 5,258 | 5,127 | 5,766 | 5,565 | ||||||||||||||||||||||||||||||||||||||||
| Merger costs | 523 | 752 | 90 | — | — | — | — | — | ||||||||||||||||||||||||||||||||||||||||
| Litigation reserve charge | — | — | 3,700 | — | — | — | 100 | — | ||||||||||||||||||||||||||||||||||||||||
Total noninterest expense |
9,386 | 9,377 | 9,503 | 6,093 | 5,258 | 5,127 | 5,866 | 5,565 | ||||||||||||||||||||||||||||||||||||||||
| Income (loss) before income tax expense (benefit) | 2,407 | 1,959 | (1,075 | ) | 2,903 | 2,709 | 2,430 | 2,767 | 2,122 | |||||||||||||||||||||||||||||||||||||||
| Income tax expense (benefit) | 741 | 541 | (527 | ) | 973 | 845 | 802 | 940 | 722 | |||||||||||||||||||||||||||||||||||||||
| Net income (loss) | $ | 1,666 | $ | 1,418 | $ | (548 | ) | $ | 1,930 | $ | 1,864 | $ | 1,628 | $ | 1,827 | $ | 1,400 | |||||||||||||||||||||||||||||||
| Per common share | ||||||||||||||||||||||||||||||||||||||||||||||||
| Net income (loss) per share: Basic |
$ | 0.47 | $ | 0.40 | $ | (0.27 | ) | $ | 0.94 | $ | 0.92 | $ | 0.80 | $ | 0.90 | $ | 0.69 | |||||||||||||||||||||||||||||||
| Diluted |
0.46 | 0.39 | (0.27 | ) | 0.92 | 0.89 | 0.78 | 0.89 | 0.69 | |||||||||||||||||||||||||||||||||||||||
| Cash dividends declared per share | 0.34 | 0.34 | 0.34 | 0.34 | 0.34 | 0.34 | 0.34 | 0.34 | ||||||||||||||||||||||||||||||||||||||||
| Book value per share | 29.61 | 29.42 | 21.52 | 22.62 | 22.10 | 21.55 | 21.53 | 20.73 | ||||||||||||||||||||||||||||||||||||||||
| Common shares outstanding | ||||||||||||||||||||||||||||||||||||||||||||||||
Average: |
Basic |
3,515 | 3,514 | 2,043 | 2,032 | 2,016 | 2,012 | 2,006 | 2,000 | |||||||||||||||||||||||||||||||||||||||
| Diluted |
3,602 | 3,592 | 2,043 | 2,093 | 2,079 | 2,068 | 2,051 | 2,022 | ||||||||||||||||||||||||||||||||||||||||
| Common shares at period end | 3,556 | 3,564 | 2,088 | 2,082 | 2,043 | 2,039 | 2,035 | 2,030 | ||||||||||||||||||||||||||||||||||||||||
| Selected ratios | ||||||||||||||||||||||||||||||||||||||||||||||||
Return on common equity (“ROE”)(c) |
6 | % | 5 | % | NM | 17 | % | 17 | % | 15 | % | 17 | % | 13 | % | |||||||||||||||||||||||||||||||||
Return on assets (“ROA”)(c)(d) |
0.57 | 0.50 | NM | 1.01 | 0.95 | 0.83 | 0.96 | 0.73 | ||||||||||||||||||||||||||||||||||||||||
| Tier 1 capital ratio | 8.7 | 8.6 | 8.2 | % | 8.4 | 8.5 | 8.7 | 8.4 | 8.4 | |||||||||||||||||||||||||||||||||||||||
| Total capital ratio | 12.2 | 12.0 | 11.2 | 11.4 | 11.8 | 12.1 | 12.0 | 12.2 | ||||||||||||||||||||||||||||||||||||||||
| Tier 1 leverage ratio | 6.2 | 6.5 | 5.5 | 5.9 | 5.6 | 5.5 | 5.5 | 5.0 | ||||||||||||||||||||||||||||||||||||||||
| Selected balance sheet (period-end) | ||||||||||||||||||||||||||||||||||||||||||||||||
| Total assets | $ | 1,157,248 | $ | 1,138,469 | $ | 817,763 | $ | 801,078 | $ | 770,912 | $ | 792,700 | $ | 802,603 | $ | 755,156 | ||||||||||||||||||||||||||||||||
| Securities | 94,512 | 92,816 | 64,915 | 70,747 | 60,244 | 65,152 | 82,549 | 85,178 | ||||||||||||||||||||||||||||||||||||||||
| Total loans | 402,114 | 393,701 | 225,938 | 217,630 | 214,766 | 225,287 | 227,394 | 217,471 | ||||||||||||||||||||||||||||||||||||||||
| Deposits | 521,456 | 496,454 | 346,539 | 336,886 | 326,492 | 313,626 | 318,248 | 300,667 | ||||||||||||||||||||||||||||||||||||||||
| Long-term debt | 95,422 | 91,754 | 52,981 | 50,062 | 48,014 | 43,945 | 43,371 | 42,851 | ||||||||||||||||||||||||||||||||||||||||
| Common stockholders’ equity | 105,314 | 104,844 | 44,932 | 47,092 | 45,145 | 43,948 | 43,812 | 42,075 | ||||||||||||||||||||||||||||||||||||||||
| Total stockholders’ equity | 105,653 | 105,853 | 45,941 | 48,101 | 46,154 | 44,957 | 44,821 | 43,084 | ||||||||||||||||||||||||||||||||||||||||
| Credit quality metrics | ||||||||||||||||||||||||||||||||||||||||||||||||
| Allowance for credit losses | $ | 7,812 | $ | 8,034 | $ | 4,227 | $ | 4,417 | $ | 4,847 | $ | 5,082 | $ | 5,471 | $ | 5,651 | ||||||||||||||||||||||||||||||||
| Nonperforming assets | 3,231 | 3,637 | 2,482 | 2,882 | 3,161 | 3,853 | 4,111 | 4,448 | ||||||||||||||||||||||||||||||||||||||||
| Allowance for loan losses to total loans(e) | 1.94 | % | 2.01 | % | 1.92 | % | 2.08 | % | 2.33 | % | 2.51 | % | 2.60 | % | 2.73 | % | ||||||||||||||||||||||||||||||||
| Net charge-offs | $ | 1,398 | $ | 865 | $ | 392 | $ | 444 | $ | 374 | $ | 614 | $ | 614 | $ | 670 | ||||||||||||||||||||||||||||||||
| Net charge-off rate(c)(f) | 1.47 | % | 0.93 | % | 0.77 | % | 0.92 | % | 0.76 | % | 1.27 | % | 1.31 | % | 1.43 | % | ||||||||||||||||||||||||||||||||
| Wholesale net charge-off rate(c)(f) | 0.21 | (0.08 | ) | 0.29 | 0.50 | (0.05 | ) | 1.25 | 1.25 | 1.36 | ||||||||||||||||||||||||||||||||||||||
| Managed Card net charge-off rate(c) | 5.24 | 4.88 | 5.85 | 5.81 | 5.77 | 5.84 | 6.04 | 5.95 | ||||||||||||||||||||||||||||||||||||||||
| Headcount | 160,968 | 162,275 | 94,615 | 96,010 | 96,367 | 95,931 | 95,862 | 96,637 | ||||||||||||||||||||||||||||||||||||||||
| Share price(g) | ||||||||||||||||||||||||||||||||||||||||||||||||
| High | $ | 40.45 | $ | 40.25 | $ | 42.57 | $ | 43.84 | $ | 36.99 | $ | 38.26 | $ | 36.52 | $ | 28.29 | ||||||||||||||||||||||||||||||||
| Low | 36.32 | 35.50 | 34.62 | 36.30 | 34.45 | 32.40 | 23.75 | 20.13 | ||||||||||||||||||||||||||||||||||||||||
| Close | 39.01 | 39.73 | 38.77 | 41.95 | 36.73 | 34.33 | 34.18 | 23.71 | ||||||||||||||||||||||||||||||||||||||||
| (a) | Quarterly results include three months of the combined Firm’s results. |
|
| (b) | Heritage JPMorgan Chase only. |
|
| (c) | Based on annualized amounts. |
|
| (d) | Represents Net income /Total average assets. |
|
| (e) | Excluded from this ratio were loans held for sale. |
|
| (f) | Excluded from this ratio were average loans held for sale. |
|
| (g) | JPMorgan Chase’s common stock is listed and traded on the New York Stock Exchange,
the London Stock Exchange Limited and the Tokyo Stock Exchange. The high, low and
closing prices of JPMorgan Chase’s common stock are from The New York Stock Exchange Composite Transaction Tape. |
| NM — Not meaningful due to net loss. |
| JPMorgan Chase & Co./2004 Annual Report | 129 |
Table of Contents
Five-year summary of consolidated financial highlights
| (unaudited) | ||||||||||||||||||||||||||||
| (in millions, except per share, headcount and ratio data) | Heritage JPMorgan Chase only | |||||||||||||||||||||||||||
| As of or for the year ended December 31, | 2004 | (a) | 2003 | 2002 | 2001 | 2000 | ||||||||||||||||||||||
| Selected income statement data | ||||||||||||||||||||||||||||
| Net interest income | $ | 16,761 | $ | 12,965 | $ | 12,178 | $ | 11,401 | $ | 9,865 | ||||||||||||||||||
| Noninterest revenue | 26,336 | 20,419 | 17,436 | 17,943 | 23,321 | |||||||||||||||||||||||
| Total net revenue | 43,097 | 33,384 | 29,614 | 29,344 | 33,186 | |||||||||||||||||||||||
| Provision for credit losses | 2,544 | 1,540 | 4,331 | 3,182 | 1,380 | |||||||||||||||||||||||
| Noninterest expense before Merger costs and Litigation reserve charge | 29,294 | 21,716 | 20,254 | 21,073 | 21,642 | |||||||||||||||||||||||
| Merger and restructuring costs | 1,365 | — | 1,210 | 2,523 | 1,431 | |||||||||||||||||||||||
| Litigation reserve charge | 3,700 | 100 | 1,300 | — | — | |||||||||||||||||||||||
Total noninterest expense |
34,359 | 21,816 | 22,764 | 23,596 | 23,073 | |||||||||||||||||||||||
| Income before income tax expense and effect of accounting change | 6,194 | 10,028 | 2,519 | 2,566 | 8,733 | |||||||||||||||||||||||
| Income tax expense | 1,728 | 3,309 | 856 | 847 | 3,006 | |||||||||||||||||||||||
| Income before effect of accounting change | 4,466 | 6,719 | 1,663 | 1,719 | 5,727 | |||||||||||||||||||||||
| Cumulative effect of change in accounting principle (net of tax) | — | — | — | (25 | ) | — | ||||||||||||||||||||||
| Net income | $ | 4,466 | $ | 6,719 | $ | 1,663 | $ | 1,694 | $ | 5,727 | ||||||||||||||||||
| Per common share | ||||||||||||||||||||||||||||
Net income per share: |
Basic | $ | 1.59 | $ | 3.32 | $ | 0.81 | $ | 0.83 | (f) | $ | 2.99 | ||||||||||||||||
| Diluted | 1.55 | 3.24 | 0.80 | 0.80 | (f) | 2.86 | ||||||||||||||||||||||
| Cash dividends declared per share | 1.36 | 1.36 | 1.36 | 1.36 | 1.28 | |||||||||||||||||||||||
| Book value per share | 29.61 | 22.10 | 20.66 | 20.32 | 21.17 | |||||||||||||||||||||||
| Common shares outstanding | ||||||||||||||||||||||||||||
Average: |
Basic | 2,780 | 2,009 | 1,984 | 1,972 | 1,884 | ||||||||||||||||||||||
| Diluted | 2,851 | 2,055 | 2,009 | 2,024 | 1,969 | |||||||||||||||||||||||
| Common shares at period-end | 3,556 | 2,043 | 1,999 | 1,973 | 1,928 | |||||||||||||||||||||||
| Selected ratios | ||||||||||||||||||||||||||||
| Return on common equity (“ROE”) | 6 | % | 16 | % | 4 | % | 4 | % | 16 | % | ||||||||||||||||||
| Return on assets (“ROA”)(b) | 0.46 | 0.87 | 0.23 | 0.23 | 0.85 | |||||||||||||||||||||||
| Tier 1 capital ratio | 8.7 | 8.5 | 8.2 | 8.3 | 8.5 | |||||||||||||||||||||||
| Total capital ratio | 12.2 | 11.8 | 12.0 | 11.9 | 12.0 | |||||||||||||||||||||||
| Tier 1 leverage ratio | 6.2 | 5.6 | 5.1 | 5.2 | 5.4 | |||||||||||||||||||||||
| Selected balance sheet (period-end) | ||||||||||||||||||||||||||||
| Total assets | $ | 1,157,248 | $ | 770,912 | $ | 758,800 | $ | 693,575 | $ | 715,348 | ||||||||||||||||||
| Securities | 94,512 | 60,244 | 84,463 | 59,760 | 73,695 | |||||||||||||||||||||||
| Loans | 402,114 | 214,766 | 216,364 | 217,444 | 216,050 | |||||||||||||||||||||||
| Deposits | 521,456 | 326,492 | 304,753 | 293,650 | 279,365 | |||||||||||||||||||||||
| Long-term debt | 95,422 | 48,014 | 39,751 | 39,183 | 43,299 | |||||||||||||||||||||||
| Common stockholders’ equity | 105,314 | 45,145 | 41,297 | 40,090 | 40,818 | |||||||||||||||||||||||
| Total stockholders’ equity | 105,653 | 46,154 | 42,306 | 41,099 | 42,338 | |||||||||||||||||||||||
| Credit quality metrics | ||||||||||||||||||||||||||||
| Allowance for credit losses | $ | 7,812 | $ | 4,847 | $ | 5,713 | $ | 4,806 | $ | 3,948 | ||||||||||||||||||
| Nonperforming assets | 3,231 | 3,161 | 4,821 | 4,037 | 1,923 | |||||||||||||||||||||||
| Allowance for loan losses to total loans(c) | 1.94 | % | 2.33 | % | 2.80 | % | 2.25 | % | 1.77 | % | ||||||||||||||||||
| Net charge-offs | $ | 3,099 | $ | 2,272 | $ | 3,676 | $ | 2,335 | $ | 1,480 | ||||||||||||||||||
| Net charge-off rate(d) | 1.08 | % | 1.19 | % | 1.90 | % | 1.13 | % | 0.73 | % | ||||||||||||||||||
| Headcount | 160,968 | 96,367 | 97,124 | 95,812 | (g) | 99,757 | (g) | |||||||||||||||||||||
| Share price(e) | ||||||||||||||||||||||||||||
| High | $ | 43.84 | $ | 38.26 | $ | 39.68 | $ | 59.19 | $ | 67.17 | ||||||||||||||||||
| Low | 34.62 | 20.13 | 15.26 | 29.04 | 32.38 | |||||||||||||||||||||||
| Close | 39.01 | 36.73 | 24.00 | 36.35 | 45.44 | |||||||||||||||||||||||
| (a) | 2004 results include six months of the combined Firm’s
results and six months of heritage JPMorgan Chase results. |
|
| (b) | Represents Net income / Total average assets. |
|
| (c) | Excluded from this ratio were loans held for sale of $25.7 billion, $20.8 billion, $25.0
billion, $16.6 billion and $8.8 billion at December 31, 2004, 2003, 2002, 2001 and 2000,
respectively. |
|
| (d) | Excluded from the net charge-off rates were average loans held for sale of $21.1
billion, $29.1 billion, $17.8 billion, $12.7 billion and $7.1 billion as of December 31, 2004,
2003, 2002, 2001 and 2000, respectively. |
|
| (e) | JPMorgan Chase’s common stock is listed and traded on the New York Stock Exchange, the London
Stock Exchange Limited and the Tokyo Stock Exchange. The high, low and closing prices of JPMorgan
Chase’s common stock are from The New York Stock Exchange Composite Transaction Tape. |
|
| (f) | Basic and diluted earnings per share were each reduced by $0.01 in 2001 because of the impact
of the adoption of SFAS 133 relating to the accounting for derivative instruments and hedging
activities. |
|
| (g) | Represents full-time equivalent employees, as headcount data is
unavailable. |
130 |
JPMorgan Chase & Co. / 2004 Annual Report |
Table of Contents
Glossary of terms
JPMorgan Chase & Co.
AICPA: American Institute of Certified Public Accountants.
APB: Accounting Principles Board Opinion.
APB 25: “Accounting for Stock Issued to Employees.”
Assets under management: Represent assets actively managed by Asset & Wealth Management on behalf of institutional, private banking, private client services and retail clients.
Assets under supervision: Represent assets under management as well as custody, brokerage, administration and deposit accounts.
Average managed assets: Refers to total assets on the Firm’s balance sheet plus credit card receivables that have been securitized.
bp: Denotes basis points; 100 bp equals 1%.
Contractual credit card charge-off: In accordance with the Federal Financial Institutions Examination Council policy, credit card loans are charged-off by the end of the month in which the account becomes 180 days past due or within 60 days from receiving notification of the filing of bankruptcy, whichever is earlier.
Core deposits: U.S. deposits insured by the Federal Deposit Insurance Corporation, up to the legal limit of $100,000 per depositor.
EITF: Emerging Issues Task Force.
EITF Issue 03-01: “The Meaning of Other-than-temporary Impairment and Its Application to Certain Investments.”
FASB: Financial Accounting Standards Board.
FIN 39: FASB Interpretation No. 39, “Offsetting of Amounts Related to Certain Contracts.”
FIN 41: FASB Interpretation No. 41, “Offsetting of Amounts Related to Certain Repurchase and Reverse Repurchase Agreements.”
FIN 45: FASB Interpretation No. 45, “Guarantor’s Accounting and Disclosure Requirement for Guarantees, including Indirect Guarantees of Indebtedness of Others.”
FIN 46R: FASB Interpretation No. 46 (revised December 2003), “Consolidation of Variable Interest Entities, an interpretation of Accounting Research Bulletin No. 51.”
FASB Staff Position (“FSP”) EITF Issue 03-1-1: “Effective Date of Paragraphs 10–20 of EITF Issue No. 03-01, ‘The Meaning of Other-than-temporary Impairment and Its Application to Certain Investments.’ ”
FSP SFAS 106-2: “Accounting and Disclosure Requirements Related to the Medicare Prescription Drug, Improvement and Modernization Act of 2003.”
FSP SFAS 109-2: “Accounting and Disclosure Guidance for the Foreign Earnings Repatriation Provision within the American Jobs Creation Act of 2004.”
Investment-grade: An indication of credit quality based on JPMorgan Chase’s internal risk assessment system. “Investment-grade” generally represents a risk profile similar to a rating of a BBB-/Baa3 or better, as defined by independent rating agencies.
Mark-to-market exposure: A measure, at a point in time, of the value of a derivative or foreign exchange contract in the open market. When the mark-to-market value is positive, it indicates the counterparty owes JPMorgan Chase and, therefore, creates a repayment risk for the Firm. When the mark-to-market value is negative, JPMorgan Chase owes the counterparty. In this situation, the Firm does not have repayment risk.
Master netting agreement: An agreement between two counterparties that have multiple derivative contracts with each other that provides for the net settlement of all contracts through a single payment, in a single currency, in the event of default on or termination of any one contract. See FIN 39.
NA: Data is not applicable for the period presented.
Net yield on interest-earning assets: The average rate for interest-earning assets less the average rate paid for all sources of funds.
NM: Not meaningful.
Overhead ratio: Noninterest expense as a percentage of total net revenue.
SFAS: Statement of Financial Accounting Standards.
SFAS 87: “Employers’ Accounting for Pensions.”
SFAS 88: “Employers’ Accounting for Settlements and Curtailments of Defined Benefit Pension Plans and for Termination Benefits.”
SFAS 106: “Employers’ Accounting for Postretirement Benefits Other Than Pensions.”
SFAS 107: “Disclosures about Fair Value of Financial Instruments.”
SFAS 109: “Accounting for Income Taxes.”
SFAS 114: “Accounting by Creditors for Impairment of a Loan.”
SFAS 115: “Accounting for Certain Investments in Debt and Equity Securities.”
SFAS 123: “Accounting for Stock-Based Compensation.”
SFAS 123R: “Share-Based Payment.”
SFAS 128: “Earnings per Share.”
SFAS 133: “Accounting for Derivative Instruments and Hedging Activities.”
SFAS 138: “Accounting for Certain Derivative Instruments and Certain Hedging Activities – an amendment of FASB Statement No. 133.”
SFAS 140: “Accounting for Transfers and Servicing of Financial Assets and Extinguishments of Liabilities – a replacement of FASB Statement No. 125.”
SFAS 142: “Goodwill and Other Intangible Assets.”
SFAS 149: “Amendment of Statement No. 133 on Derivative Instruments and Hedging Activities.”
Staff Accounting Bulletin (“SAB”) 105: “Application of Accounting Principles to Loan Commitments.”
Statement of Position (“SOP”) 98-1: “Accounting for the Costs of Computer Software Developed or Obtained for Internal Use.”
Statement of Position (“SOP”) 03-3: “Accounting for Certain Loans or Debt Securities Acquired in a Transfer.”
Stress testing: A scenario that measures market risk under unlikely but plausible events in abnormal markets.
U.S. GAAP: Accounting principles generally accepted in the United States of America.
Value-at-Risk (“VAR”): A measure of the dollar amount of potential loss from adverse market moves in an ordinary market environment.
| JPMorgan Chase & Co. / 2004 Annual Report | 131 |
Table of Contents
Distribution of assets, liabilities and stockholders’ equity;
interest rates and interest differentials
Consolidated average balance sheet, interest and rates
Provided below is a summary of JPMorgan Chase’s consolidated average balances, interest rates and interest differentials on a taxable-equivalent basis for the years 2002 through 2004. Income computed on a taxable-equivalent basis is the income reported in the Consolidated statements of income, adjusted to make income and earnings yields on assets
exempt from income taxes (primarily federal taxes) comparable with other taxable income. The incremental tax rate used for calculating the taxable-equivalent adjustment was approximately 40% in 2004 and 41% in 2003 and 2002. A substantial portion of JPMorgan Chase’s securities is taxable.
| (Table continued on next page) | 2004 | |||||||||||
| Year ended December 31,(a) | Average | Average | ||||||||||
| (Taxable-equivalent interest and rates; in millions, except rates) | balance | Interest | rate | |||||||||
Assets |
||||||||||||
Deposits with banks |
$ | 28,625 | $ | 539 | 1.88 | % | ||||||
Federal funds sold and securities purchased under resale agreements |
93,979 | 1,627 | 1.73 | |||||||||
Securities borrowed |
49,387 | 463 | 0.94 | |||||||||
Trading assets – debt and equity instruments |
169,203 | 7,535 | 4.45 | |||||||||
Securities: |
||||||||||||
Available-for-sale |
78,697 | 3,463 | 4.40 | (b) | ||||||||
Held-to-maturity |
172 | 11 | 6.50 | |||||||||
Interests in purchased receivables(e) |
15,564 | 291 | 1.87 | |||||||||
Loans |
308,450 | 16,808 | (c) | 5.45 | ||||||||
Total interest-earning assets |
744,077 | 30,737 | 4.13 | |||||||||
Allowance for loan losses |
(5,951 | ) | ||||||||||
Cash and due from banks |
25,390 | |||||||||||
Trading assets — derivative receivables |
59,521 | |||||||||||
All other assets |
139,519 | |||||||||||
Total assets |
$ | 962,556 | ||||||||||
Liabilities |
||||||||||||
Interest-bearing deposits |
$ | 309,020 | $ | 4,600 | 1.49 | % | ||||||
Federal funds purchased and securities sold under repurchase agreements |
155,665 | 2,298 | 1.48 | |||||||||
Commercial paper |
12,699 | 175 | 1.38 | |||||||||
Other borrowings(d) |
83,721 | 3,817 | 4.56 | |||||||||
Beneficial interests issued by consolidated VIEs(e) |
26,817 | 478 | 1.78 | |||||||||
Long-term debt |
79,193 | 2,466 | 3.11 | |||||||||
Total interest-bearing liabilities |
667,115 | 13,834 | 2.07 | |||||||||
Noninterest-bearing deposits |
101,994 | |||||||||||
Trading liabilities — derivative payables |
52,761 | |||||||||||
All other liabilities, including the allowance for lending-related
commitments |
64,038 | |||||||||||
Total liabilities |
885,908 | |||||||||||
Preferred stock of subsidiary |
— | |||||||||||
Stockholders’ equity |
||||||||||||
Preferred stock |
1,007 | |||||||||||
Common stockholders’ equity |
75,641 | |||||||||||
Total stockholders’ equity |
76,648 | (f) | ||||||||||
Total liabilities, preferred stock of subsidiary and stockholders’ equity |
$ | 962,556 | ||||||||||
Interest rate spread |
2.06 | % | ||||||||||
Net interest income and net yield on interest-earning assets |
$ | 16,903 | 2.27 | |||||||||
| (a) | 2004 results include six months of the combined Firm’s results and six months of heritage
JPMorgan Chase results. All other periods reflect the results of heritage JPMorgan Chase only. |
|
| (b) |
The annualized rate for available-for-sale securities based on amortized cost was 4.37% in 2004,
4.63% in 2003 and 5.13% in 2002. |
|
| (c) | Fees and commissions on loans included in loan interest amounted to $1,374 million
for 2004, $876 million in 2003 and $928 million in 2002. |
|
| (d) | Includes securities sold
but not yet purchased. |
|
| (e) | Not applicable for years prior to 2003 since the Firm
adopted FIN 46 during 2003. |
|
| (f) | The ratio of average stockholders’ equity to average assets was 8.0% for 2004, 5.7% for 2003
and 5.8% for 2002. The return on average stockholders’ equity was 5.8% for 2004, 15.3% for 2003 and
3.9% for 2002. |
132 |
Table of Contents
Within the Consolidated average balance sheets, interest and rates summary, the principal amounts of nonaccrual loans have been included in the average loan balances used to determine the average interest rate
earned on loans. For additional information on nonaccrual loans, including interest accrued, see Note 11 on pages 101 and 102.
| 2003 | 2002 | |||||||||||||||||||||||
| Average | Average | Average | Average | |||||||||||||||||||||
| balance | Interest | rate | balance | Interest | rate | |||||||||||||||||||
| $ | 9,742 | $ | 214 | 2.20 | % | $ | 11,945 | $ | 303 | 2.54 | % | |||||||||||||
| 87,273 | 1,497 | 1.72 | 84,194 | 2,078 | 2.47 | |||||||||||||||||||
| 40,305 | 323 | 0.80 | 42,703 | 681 | 1.59 | |||||||||||||||||||
| 148,970 | 6,608 | 4.44 | 137,272 | 6,814 | 4.96 | |||||||||||||||||||
| 77,156 | 3,553 | 4.60 | (b) | 66,619 | 3,389 | 5.09 | (b) | |||||||||||||||||
| 286 | 21 | 7.19 | 446 | 29 | 6.45 | |||||||||||||||||||
| 5,414 | 64 | 1.18 | NA | NA | NA | |||||||||||||||||||
| 220,692 | 11,824 | (c) | 5.36 | 211,432 | 12,720 | (c) | 6.02 | |||||||||||||||||
| 589,838 | 24,104 | 4.09 | 554,611 | 26,014 | 4.69 | |||||||||||||||||||
| (5,161 | ) | (5,178 | ) | |||||||||||||||||||||
| 17,951 | 18,850 | |||||||||||||||||||||||
| 85,628 | 73,641 | |||||||||||||||||||||||
| 87,722 | 91,433 | |||||||||||||||||||||||
| $ | 775,978 | $ | 733,357 | |||||||||||||||||||||
| $ | 227,645 | $ | 3,604 | 1.58 | % | $ | 217,417 | $ | 5,253 | 2.42 | % | |||||||||||||
| 161,020 | 2,199 | 1.37 | 168,428 | 3,313 | 1.97 | |||||||||||||||||||
| 13,387 | 151 | 1.13 | 16,134 | 281 | 1.74 | |||||||||||||||||||
| 69,703 | 3,521 | 5.05 | 69,393 | 3,444 | 4.96 | |||||||||||||||||||
| 9,421 | 106 | 1.13 | NA | NA | NA | |||||||||||||||||||
| 49,095 | 1,498 | 3.05 | 43,927 | 1,467 | 3.34 | |||||||||||||||||||
| 530,271 | 11,079 | 2.09 | 515,299 | 13,758 | 2.67 | |||||||||||||||||||
| 77,640 | 69,999 | |||||||||||||||||||||||
| 67,783 | 57,607 | |||||||||||||||||||||||
| 56,287 | 47,988 | |||||||||||||||||||||||
| 731,981 | 690,893 | |||||||||||||||||||||||
| — | 87 | |||||||||||||||||||||||
| 1,009 | 1,009 | |||||||||||||||||||||||
| 42,988 | 41,368 | |||||||||||||||||||||||
| 43,997 | (f) | 42,377 | (f) | |||||||||||||||||||||
| $ | 775,978 | $ | 733,357 | |||||||||||||||||||||
| 2.00 | % | 2.02 | % | |||||||||||||||||||||
| $ | 13,025 | 2.21 | $ | 12,256 | 2.21 | |||||||||||||||||||
133 |
Table of Contents
Interest rates and interest differential analysis of net interest income –
U.S. and non-U.S.
| (Table continued on next page) | ||||||||||||
| 2004 | ||||||||||||
| Year ended December 31,(a) | Average | Average | ||||||||||
| (Taxable-equivalent interest and rates; in millions, except rates) | balance | Interest | rate | |||||||||
Interest-earning assets: |
||||||||||||
Deposits with banks, primarily non-U.S. |
$ | 28,625 | $ | 539 | 1.88 | % | ||||||
Federal funds sold and securities purchased under resale
agreements: |
||||||||||||
U.S. |
64,673 | 1,182 | 1.83 | |||||||||
Non-U.S. |
29,306 | 445 | 1.52 | |||||||||
Securities borrowed, primarily U.S. |
49,387 | 463 | 0.94 | |||||||||
Trading assets — debt and equity instruments: |
||||||||||||
U.S. |
100,658 | 4,361 | 4.33 | |||||||||
Non-U.S. |
68,545 | 3,174 | 4.63 | |||||||||
Securities: |
||||||||||||
U.S. |
65,853 | 3,045 | 4.62 | |||||||||
Non-U.S. |
13,016 | 429 | 3.29 | |||||||||
Interests in purchased receivables, primarily U.S.(b) |
15,564 | 291 | 1.87 | |||||||||
Loans: |
||||||||||||
U.S. |
275,914 | 15,819 | 5.73 | |||||||||
Non-U.S. |
32,536 | 989 | 3.04 | |||||||||
Total interest-earning assets |
744,077 | 30,737 | 4.13 | |||||||||
Interest-bearing liabilities: |
||||||||||||
Interest-bearing deposits: |
||||||||||||
U.S. |
198,075 | 2,671 | 1.35 | |||||||||
Non-U.S. |
110,945 | 1,929 | 1.74 | |||||||||
Federal funds purchased and securities sold under repurchase
agreements: |
||||||||||||
U.S. |
122,760 | 1,816 | 1.48 | |||||||||
Non-U.S. |
32,905 | 482 | 1.47 | |||||||||
Other borrowed funds: |
||||||||||||
U.S. |
61,687 | 2,182 | 3.54 | |||||||||
Non-U.S. |
34,733 | 1,810 | 5.21 | |||||||||
Beneficial interests issued by consolidated VIEs, primarily
U.S.(b) |
26,817 | 478 | 1.78 | |||||||||
Long-term debt, primarily U.S. |
79,193 | 2,466 | 3.11 | |||||||||
Intracompany funding: |
||||||||||||
U.S. |
26,687 | 207 | — | |||||||||
Non-U.S. |
(26,687 | ) | (207 | ) | — | |||||||
Total interest-bearing liabilities |
667,115 | 13,834 | 2.07 | |||||||||
Noninterest-bearing liabilities(c) |
76,962 | |||||||||||
Total investable funds |
$ | 744,077 | $ | 13,834 | 1.86 | % | ||||||
Net interest income and net yield: |
$ | 16,903 | 2.27 | % | ||||||||
U.S. |
15,261 | 2.76 | ||||||||||
Non-U.S. |
1,642 | 0.86 | ||||||||||
Percentage of total assets and liabilities attributable
to non-U.S. operations: |
||||||||||||
Assets |
29.7 | |||||||||||
Liabilities |
30.6 | |||||||||||
| (a) | 2004 results include six months of the combined Firm’s results and six months of heritage
JPMorgan Chase results. All other periods reflect the results of heritage JPMorgan Chase only. |
|
| (b) | Not applicable for years prior to 2003 since the Firm adopted FIN 46 during 2003. |
|
| (c) | Represents the amount of noninterest-bearing liabilities funding interest-earning assets. |
| 134 |
Table of Contents
| (Continuation of table) | 2003 | 2002 | ||||||||||||||||||||||
| Average | Average | Average | Average | |||||||||||||||||||||
| balance | Interest | rate | balance | Interest | rate | |||||||||||||||||||
| $ | 9,742 | $ | 214 | 2.20 | % | $ | 11,945 | $ | 303 | 2.54 | % | |||||||||||||
| 61,925 | 988 | 1.59 | 60,176 | 1,302 | 2.16 | |||||||||||||||||||
| 25,348 | 509 | 2.01 | 24,018 | 776 | 3.23 | |||||||||||||||||||
| 40,305 | 323 | 0.80 | 42,703 | 681 | 1.59 | |||||||||||||||||||
| 86,234 | 4,013 | 4.65 | 81,202 | 4,397 | 5.42 | |||||||||||||||||||
| 62,736 | 2,595 | 4.14 | 56,070 | 2,417 | 4.31 | |||||||||||||||||||
| 67,024 | 3,184 | 4.75 | 53,745 | 2,913 | 5.42 | |||||||||||||||||||
| 10,418 | 390 | 3.75 | 13,320 | 505 | 3.79 | |||||||||||||||||||
| 5,414 | 64 | 1.18 | NA |
NA |
NA |
|||||||||||||||||||
| 188,637 | 10,973 | 5.82 | 174,359 | 11,514 | 6.60 | |||||||||||||||||||
| 32,055 | 851 | 2.66 | 37,073 | 1,206 | 3.25 | |||||||||||||||||||
| 589,838 | 24,104 | 4.09 | 554,611 | 26,014 | 4.69 | |||||||||||||||||||
| 117,035 | 1,688 | 1.44 | 107,823 | 2,412 | 2.24 | |||||||||||||||||||
| 110,610 | 1,916 | 1.73 | 109,594 | 2,841 | 2.59 | |||||||||||||||||||
| 129,715 | 1,599 | 1.23 | 131,213 | 2,800 | 2.13 | |||||||||||||||||||
| 31,305 | 600 | 1.92 | 37,215 | 513 | 1.38 | |||||||||||||||||||
| 59,249 | 2,323 | 3.92 | 58,533 | 2,490 | 4.25 | |||||||||||||||||||
| 23,841 | 1,349 | 5.66 | 26,994 | 1,235 | 4.58 | |||||||||||||||||||
| 9,421 | 106 | 1.13 | NA |
NA |
NA |
|||||||||||||||||||
| 49,095 | 1,498 | 3.05 | 43,927 | 1,467 | 3.34 | |||||||||||||||||||
| 44,856 | 946 | — | 68,736 | 1,758 | — | |||||||||||||||||||
| (44,856 | ) | (946 | ) | — | (68,736 | ) | (1,758 | ) | — | |||||||||||||||
| 530,271 | 11,079 | 2.09 | 515,299 | 13,758 | 2.67 | |||||||||||||||||||
| 59,567 | 39,312 | |||||||||||||||||||||||
| $ | 589,838 | $ | 11,079 | 1.88 | % | $ | 554,611 | $ | 13,758 | 2.48 | % | |||||||||||||
| $ | 13,025 | 2.21 | % | $ | 12,256 | 2.21 | % | |||||||||||||||||
| 11,140 | 2.55 | 9,564 | 2.42 | |||||||||||||||||||||
| 1,885 | 1.24 | 2,692 | 1.69 | |||||||||||||||||||||
| 30.7 | 31.7 | |||||||||||||||||||||||
| 35.5 | 34.9 | |||||||||||||||||||||||
| 135 |
Table of Contents
Changes in net interest income, volume and rate analysis
| 2004 versus 2003 (a) | 2003 versus 2002(a) | |||||||||||||||||||||||
| (On a taxable-equivalent basis; | Increase (decrease) due to change in: | Net | Increase (decrease) due to change in: | Net | ||||||||||||||||||||
| in millions) | Volume | Rate | change | Volume | Rate | change | ||||||||||||||||||
Interest-earning assets |
||||||||||||||||||||||||
Deposits with banks,
primarily non-U.S. |
$ | 356 | $ | (31 | ) | $ | 325 | $ | (48 | ) | $ | (41 | ) | $ | (89 | ) | ||||||||
Federal funds sold and
securities
purchased under resale
agreements: |
||||||||||||||||||||||||
U.S. |
45 | 149 | 194 | 29 | (343 | ) | (314 | ) | ||||||||||||||||
Non-U.S. |
60 | (124 | ) | (64 | ) | 26 | (293 | ) | (267 | ) | ||||||||||||||
Securities borrowed,
primarily U.S. |
84 | 56 | 140 | (21 | ) | (337 | ) | (358 | ) | |||||||||||||||
Trading assets — debt and
equity instruments: |
||||||||||||||||||||||||
U.S. |
624 | (276 | ) | 348 | 241 | (625 | ) | (384 | ) | |||||||||||||||
Non-U.S. |
272 | 307 | 579 | 273 | (95 | ) | 178 | |||||||||||||||||
Securities: |
||||||||||||||||||||||||
U.S. |
(52 | ) | (87 | ) | (139 | ) | 631 | (360 | ) | 271 | ||||||||||||||
Non-U.S. |
87 | (48 | ) | 39 | (110 | ) | (5 | ) | (115 | ) | ||||||||||||||
Interests in purchased
receivables, primarily
U.S.(b) |
190 | 37 | 227 | 64 | — | 64 | ||||||||||||||||||
Loans: |
||||||||||||||||||||||||
U.S. |
5,016 | (170 | ) | 4,846 | 819 | (1,360 | ) | (541 | ) | |||||||||||||||
Non-U.S. |
16 | 122 | 138 | (136 | ) | (219 | ) | (355 | ) | |||||||||||||||
Change in interest income |
6,698 | (65 | ) | 6,633 | 1,768 | (3,678 | ) | (1,910 | ) | |||||||||||||||
Interest-bearing liabilities |
||||||||||||||||||||||||
Interest-bearing deposits: |
||||||||||||||||||||||||
U.S. |
1,088 | (105 | ) | 983 | 139 | (863 | ) | (724 | ) | |||||||||||||||
Non-U.S. |
2 | 11 | 13 | 18 | (943 | ) | (925 | ) | ||||||||||||||||
Federal funds purchased and
securities
sold under repurchase
agreements: |
||||||||||||||||||||||||
U.S. |
(107 | ) | 324 | 217 | (20 | ) | (1,181 | ) | (1,201 | ) | ||||||||||||||
Non-U.S. |
23 | (141 | ) | (118 | ) | (114 | ) | 201 | 87 | |||||||||||||||
Other borrowed funds: |
||||||||||||||||||||||||
U.S. |
84 | (225 | ) | (141 | ) | 26 | (193 | ) | (167 | ) | ||||||||||||||
Non-U.S. |
568 | (107 | ) | 461 | (178 | ) | 292 | 114 | ||||||||||||||||
Beneficial interests issued
by consolidated VIEs,
primarily U.S.(b) |
311 | 61 | 372 | 106 | — | 106 | ||||||||||||||||||
Long-term debt, primarily
U.S. |
939 | 29 | 968 | 158 | (127 | ) | 31 | |||||||||||||||||
Intracompany funding: |
||||||||||||||||||||||||
U.S. |
(142 | ) | (597 | ) | (739 | ) | (503 | ) | (309 | ) | (812 | ) | ||||||||||||
Non-U.S. |
142 | 597 | 739 | 503 | 309 | 812 | ||||||||||||||||||
Change in interest expense |
2,908 | (153 | ) | 2,755 | 135 | (2,814 | ) | (2,679 | ) | |||||||||||||||
Change in net interest income |
$ | 3,790 | $ | 88 | $ | 3,878 | $ | 1,633 | $ | (864 | ) | $ | 769 | |||||||||||
| (a) | 2004 results include six months of the combined Firm’s results and six months of heritage
JPMorgan Chase results. All other periods reflect the results of heritage JPMorgan Chase only. |
|
| (b) | Not applicable for years prior to 2003 since the Firm adopted FIN 46 during 2003. |
| 136 |
Table of Contents
Securities portfolio
| Due in 1 | Due after 1 | Due after 5 | Due after | ||||||||||||||||||
| December 31, 2004 (in millions, rates on a taxable-equivalent basis) | year or less | through 5 years | through 10 years | 10 years(a) | Total | ||||||||||||||||
U.S. government and federal
agencies/corporations obligations: |
|||||||||||||||||||||
Amortized cost |
$ | 1,970 | $ | 9,450 | $ | 3,245 | $ | 47,638 | $ | 62,303 | |||||||||||
Fair value |
1,972 | 9,334 | 3,169 | 47,186 | 61,661 | ||||||||||||||||
Average
yield(b) |
1.67 | % | 3.22 | % | 3.46 | % | 4.77 | % | 4.37 | % | |||||||||||
Other:(c) |
|||||||||||||||||||||
Amortized cost |
$ | 6,671 | $ | 10,190 | $ | 6,025 | $ | 9,632 | $ | 32,518 | |||||||||||
Fair value |
6,672 | 10,266 | 6,109 | 9,694 | 32,741 | ||||||||||||||||
Average
yield(b) |
2.67 | % | 3.15 | % | 3.94 | % | 3.03 | % | 3.16 | % | |||||||||||
Total available-for-sale securities:(d) |
|||||||||||||||||||||
Amortized cost |
$ | 8,641 | $ | 19,640 | $ | 9,270 | $ | 57,270 | $ | 94,821 | |||||||||||
Fair value |
8,644 | 19,600 | 9,278 | 56,880 | 94,402 | ||||||||||||||||
Average
yield(b) |
2.44 | % | 3.18 | % | 3.77 | % | 4.48 | % | 3.95 | % | |||||||||||
Total held-to-maturity securities:(d) |
|||||||||||||||||||||
Amortized cost |
$ | — | $ | — | $ | 16 | $ | 94 | $ | 110 | |||||||||||
Fair value |
— | — | 16 | 101 | 117 | ||||||||||||||||
Average
yield(b) |
— | % | — | % | 6.96 | % | 6.88 | % | 6.89 | % | |||||||||||
| (a) | Securities with no stated maturity are included with securities with a contractual maturity of
10 years or more. Substantially all of JPMorgan Chase’s mortgaged-backed securities (“MBSs”) and
collateralized mortgage obligations (“CMOs”) are due in 10 years or more based on contractual
maturity. The estimated duration, which reflects anticipated future prepayments based on a
consensus of dealers in the market, is approximately four years for MBSs and CMOs. |
|
| (b) | The average yield is based on amortized cost balances at the end of the year. Yields are
derived by dividing interest income (including the effect of related derivatives on
available-for-sale securities and the amortization of premiums and accretion of discounts) by total
amortized cost. Taxable-equivalent yields are used where applicable. |
|
| (c) | Includes obligations of state and political subdivisions, debt securities issued by non-U.S.
governments, corporate debt securities, CMOs of private issuers and other debt and equity
securities. |
|
| (d) | For the amortized cost of the above categories of securities at December 31, 2003, see Note 9
on page 98. At December 31, 2002, the amortized cost of U.S. government and federal agencies and
other available-for-sale securities was $66,289 million and $16,663 million, respectively. At
December 31, 2002, the amortized cost of U.S. government and federal agencies held-to-maturity
securities was $431 million. There were no other held-to-maturity securities at December 31, 2002. |
| 137 |
Table of Contents
Loan portfolio
The table below presents loans based on customer type and collateral type compared to a line of business approach that is presented in Credit risk management on pages 59 and 66, and in Note 11 on page 101:
| December 31, (in millions) | 2004 | 2003 | (a) | 2002 | (a) | 2001 | (a) | 2000 | (a) | |||||||||||
U.S. loans: |
||||||||||||||||||||
Commercial and industrial |
$ | 76,890 | $ | 38,879 | $ | 49,205 | $ | 56,680 | $ | 64,031 | ||||||||||
Commercial
real estate – commercial mortgage(b) |
15,323 | 3,182 | 3,176 | 3,533 | 4,109 | |||||||||||||||
Commercial
real estate – construction(b) |
4,612 | 589 | 516 | 615 | 725 | |||||||||||||||
Financial institutions |
12,664 | 4,622 | 3,770 | 5,608 | 7,342 | |||||||||||||||
Consumer |
255,073 | 136,393 | 124,687 | 111,850 | 95,960 | |||||||||||||||
Total U.S. loans |
364,562 | 183,665 | 181,354 | 178,286 | 172,167 | |||||||||||||||
Non-U.S. loans: |
||||||||||||||||||||
Commercial and industrial |
27,293 | 24,618 | 31,446 | 33,530 | 37,002 | |||||||||||||||
Commercial real estate(b) |
929 | 79 | 381 | 167 | 1,470 | |||||||||||||||
Financial institutions |
6,494 | 5,671 | 2,438 | 3,570 | 3,976 | |||||||||||||||
Non-U.S. governments |
2,778 | 705 | 616 | 1,161 | 805 | |||||||||||||||
Consumer |
58 | 28 | 129 | 730 | 630 | |||||||||||||||
Total non-U.S. loans |
37,552 | 31,101 | 35,010 | 39,158 | 43,883 | |||||||||||||||
Total loans(c) |
$ | 402,114 | $ | 214,766 | $ | 216,364 | $ | 217,444 | $ | 216,050 | ||||||||||
| (a) | Heritage JPMorgan Chase only. |
|
| (b) | Represents loans secured by commercial real estate. |
|
| (c) | Loans are presented net of unearned income of $4.1 billion, $1.3 billion, $1.9 billion, $1.8
billion and $1.6 billion at December 31, 2004, 2003, 2002, 2001 and 2000, respectively. |
Maturities and sensitivity to changes in interest rates
The table below shows, at December 31, 2004, commercial loan maturity and distribution between
fixed and floating interest rates based upon the stated terms of the commercial loan agreements.
The table does not include the impact of derivative instruments.
| Within | 1-5 | After 5 | ||||||||||||||
| December 31, 2004 (in millions) | 1 year | (a) | years | years | Total | |||||||||||
U.S.: |
||||||||||||||||
Commercial and industrial |
$ | 32,087 | $ | 37,162 | $ | 7,641 | $ | 76,890 | ||||||||
Commercial real estate |
4,027 | 11,507 | 4,401 | 19,935 | ||||||||||||
Financial institutions |
6,966 | 4,871 | 827 | 12,664 | ||||||||||||
Non-U.S. |
19,904 | 10,678 | 6,912 | 37,494 | ||||||||||||
Total commercial loans |
$ | 62,984 | $ | 64,218 | $ | 19,781 | $ | 146,983 | ||||||||
Loans at fixed interest rates |
29,745 | 10,107 | ||||||||||||||
Loans at variable interest rates |
34,473 | 9,674 | ||||||||||||||
Total commercial loans |
$ | 64,218 | $ | 19,781 | ||||||||||||
| (a) | Includes demand loans and overdrafts. |
| 138 |
Table of Contents
Cross-border outstandings
Cross-border outstandings exceeding 0.75% of total assets
| Net local | Total | Total | ||||||||||||||||||||||||||||
| country | direct | cross-border | ||||||||||||||||||||||||||||
| (in millions) | At December 31, | Governments | Banks | Other | (b) | assets | exposure | (c) | Commitments | (d) | exposure | |||||||||||||||||||
U.K. |
2004 | $ | 1,531 | $ | 23,421 | $ | 42,357 | $ | — | $ | 67,309 | $ | 102,770 | $ | 170,079 | |||||||||||||||
| 2003(a) | 1,111 | 3,758 | 11,839 | — | 16,708 | 35,983 | 52,691 | |||||||||||||||||||||||
| 2002(a) | 1,386 | 7,821 | 12,191 | — | 21,398 | 20,416 | 41,814 | |||||||||||||||||||||||
Germany |
2004 | $ | 28,114 | $ | 10,547 | $ | 9,759 | $ | 509 | $ | 48,929 | $ | 47,268 | $ | 96,197 | |||||||||||||||
| 2003(a) | 14,741 | 12,353 | 4,383 | — | 31,477 | 31,332 | 62,809 | |||||||||||||||||||||||
| 2002(a) | 21,705 | 10,213 | 4,789 | — | 36,707 | 20,405 | 57,112 | |||||||||||||||||||||||
France |
2004 | $ | 3,315 | $ | 15,178 | $ | 11,790 | $ | 2,082 | $ | 32,365 | $ | 33,724 | $ | 66,089 | |||||||||||||||
| 2003(a) | 2,311 | 3,788 | 6,070 | 599 | 12,768 | 22,385 | 35,153 | |||||||||||||||||||||||
| 2002(a) | 5,212 | 6,461 | 3,136 | 984 | 15,793 | 14,902 | 30,695 | |||||||||||||||||||||||
Japan |
2004 | $ | 25,349 | $ | 3,869 | $ | 5,765 | $ | — | $ | 34,983 | $ | 23,582 | $ | 58,565 | |||||||||||||||
| 2003(a) | 8,902 | 510 | 2,358 | — | 11,770 | 13,474 | 25,244 | |||||||||||||||||||||||
| 2002(a) | 7,990 | 1,534 | 1,443 | — | 10,967 | 10,290 | 21,257 | |||||||||||||||||||||||
Italy |
2004 | $ | 12,431 | $ | 5,589 | $ | 6,911 | $ | 180 | $ | 25,111 | $ | 14,895 | $ | 40,006 | |||||||||||||||
| 2003(a) | 9,336 | 3,743 | 2,570 | 818 | 16,467 | 10,738 | 27,205 | |||||||||||||||||||||||
| 2002(a) | 7,340 | 3,604 | 2,489 | 488 | 13,921 | 6,001 | 19,922 | |||||||||||||||||||||||
Netherlands |
2004 | $ | 1,563 | $ | 4,656 | $ | 13,302 | $ | — | $ | 19,521 | $ | 16,985 | $ | 36,506 | |||||||||||||||
| 2003(a) | 4,571 | 3,997 | 11,152 | — | 19,720 | 11,689 | 31,409 | |||||||||||||||||||||||
| 2002(a) | 4,030 | 2,907 | 8,724 | — | 15,661 | 7,744 | 23,405 | |||||||||||||||||||||||
Spain |
2004 | $ | 4,224 | $ | 3,469 | $ | 4,503 | $ | 659 | $ | 12,855 | $ | 11,086 | $ | 23,941 | |||||||||||||||
| 2003(a) | 1,365 | 1,909 | 2,964 | — | 6,238 | 7,301 | 13,539 | |||||||||||||||||||||||
| 2002(a) | 2,293 | 1,501 | 1,987 | 659 | 6,440 | 5,613 | 12,053 | |||||||||||||||||||||||
Switzerland |
2004 | $ | 327 | $ | 2,379 | $ | 3,000 | $ | 311 | $ | 6,017 | $ | 7,807 | $ | 13,824 | |||||||||||||||
| 2003(a) | 370 | 4,630 | 2,201 | 320 | 7,521 | 4,993 | 12,514 | |||||||||||||||||||||||
| 2002(a) | 463 | 1,684 | 3,129 | 700 | 5,976 | 3,375 | 9,351 | |||||||||||||||||||||||
Luxembourg |
2004 | $ | 397 | $ | 3,897 | $ | 6,194 | $ | — | $ | 10,488 | $ | 1,721 | $ | 12,209 | |||||||||||||||
| 2003(a) | 774 | 718 | 8,336 | — | 9,828 | 1,007 | 10,835 | |||||||||||||||||||||||
| 2002(a) | 572 | 977 | 5,355 | — | 6,904 | 646 | 7,550 | |||||||||||||||||||||||
Belgium |
2004 | $ | 2,899 | $ | 2,382 | $ | 2,568 | $ | — | $ | 7,849 | $ | 1,254 | $ | 9,103 | |||||||||||||||
| 2003(a) | 1,426 | 474 | 1,096 | — | 2,996 | 1,072 | 4,068 | |||||||||||||||||||||||
| 2002(a) | 640 | 761 | 1,283 | — | 2,684 | 1,975 | 4,659 | |||||||||||||||||||||||
| (a) | Heritage JPMorgan Chase only. |
|
| (b) | Consists primarily of commercial and industrial. |
|
| (c) | Exposure includes loans and accrued interest receivable, interest-bearing deposits with
banks, acceptances, resale agreements, other monetary assets, cross-border trading debt and
equity instruments, mark-to-market exposure of foreign exchange and derivative contracts and
local country assets, net of local country liabilities. The amounts associated with foreign exchange and derivative contracts are presented after taking into account the impact of legally enforceable master netting agreements. |
|
| (d) | Commitments include outstanding letters of credit, undrawn commitments to extend credit and
credit derivatives. |
| 139 |
Table of Contents
Risk elements
| December 31, (in millions) | 2004 | 2003 | (a) | 2002 | (a) | 2001 | (a) | 2000 | (a) | |||||||||||
Nonperforming assets |
||||||||||||||||||||
U.S. nonperforming loans:(b) |
||||||||||||||||||||
Commercial and industrial |
$ | 1,175 | $ | 1,060 | $ | 1,769 | $ | 1,186 | $ | 727 | ||||||||||
Commercial real estate |
326 | 31 | 48 | 131 | 65 | |||||||||||||||
Financial institutions |
1 | 1 | 258 | 33 | 29 | |||||||||||||||
Consumer |
895 | 542 | 544 | 537 | 377 | |||||||||||||||
Total U.S. nonperforming loans |
2,397 | 1,634 | 2,619 | 1,887 | 1,198 | |||||||||||||||
Non-U.S. nonperforming loans:(b) |
||||||||||||||||||||
Commercial and industrial |
288 | 909 | 1,566 | 679 | 556 | |||||||||||||||
Commercial real estate |
13 | 13 | 11 | 9 | 9 | |||||||||||||||
Financial institutions |
43 | 25 | 36 | 23 | 13 | |||||||||||||||
Non-U.S. governments |
— | — | — | 11 | 35 | |||||||||||||||
Consumer |
2 | 3 | 2 | 4 | 7 | |||||||||||||||
Total non-U.S. nonperforming loans |
346 | 950 | 1,615 | 726 | 620 | |||||||||||||||
Total nonperforming loans |
2,743 | 2,584 | 4,234 | 2,613 | 1,818 | |||||||||||||||
Derivative receivables |
241 | 253 | 289 | 1,300 | 37 | |||||||||||||||
Other receivables |
— | 108 | 108 | — | — | |||||||||||||||
Assets acquired in loan satisfactions |
247 | 216 | 190 | 124 | 68 | |||||||||||||||
Total nonperforming assets |
$ | 3,231 | $ | 3,161 | $ | 4,821 | $ | 4,037 | $ | 1,923 | ||||||||||
Contractually past-due assets(c) |
||||||||||||||||||||
U.S. loans: |
||||||||||||||||||||
Commercial and industrial |
$ | 34 | $ | 41 | $ | 57 | $ | 11 | $ | 95 | ||||||||||
Commercial real estate |
— | — | — | 19 | 3 | |||||||||||||||
Consumer |
970 | 269 | 473 | 484 | 399 | |||||||||||||||
Total U.S. loans |
1,004 | 310 | 530 | 514 | 497 | |||||||||||||||
Non-U.S. loans |
||||||||||||||||||||
Commercial and industrial |
2 | 5 | — | 5 | 1 | |||||||||||||||
Consumer |
— | — | — | 2 | 2 | |||||||||||||||
Total non-U.S. loans |
2 | 5 | — | 7 | 3 | |||||||||||||||
Total |
$ | 1,006 | $ | 315 | $ | 530 | $ | 521 | $ | 500 | ||||||||||
| (a) | Heritage JPMorgan Chase only. |
|
| (b) | All nonperforming loans accounted for on a nonaccrual basis. There were no nonperforming
renegotiated loans. Renegotiated loans are those for which concessions, such as the
reduction of interest rates or the deferral of interest or principal payments, have been
granted as a result of a deterioration in the borrowers’ financial condition. |
|
| (c) | Accruing loans past-due 90 days or more as to principal and interest, which are not
characterized as nonperforming loans. |
Impact of nonperforming loans on interest income
| Year ended December 31, (in millions)(a) | 2004 | 2003 | 2002 | |||||||||
U.S.: |
||||||||||||
Gross amount of interest that would have been recorded at the original rate |
$ | 124 | $ | 86 | $ | 167 | ||||||
Interest that was recognized in income |
(8 | ) | (5 | ) | (24 | ) | ||||||
Negative
impact - U.S. |
116 | 81 | 143 | |||||||||
Non-U.S.: |
||||||||||||
Gross amount of interest that would have been recorded at the original rate |
36 | 58 | 102 | |||||||||
Interest that was recognized in income |
— | — | — | |||||||||
Negative
impact - non-U.S. |
36 | 58 | 102 | |||||||||
Total negative impact on interest income |
$ | 152 | $ | 139 | $ | 245 | ||||||
| (a) | 2004 results include six months of the combined Firm’s results and six months of heritage
JPMorgan Chase results. All other periods reflect the results of heritage JPMorgan Chase only. |
| 140 |
Table of Contents
Summary of loan and lending-related commitments loss experience
Allowance for loan losses
| Year ended December 31, (in millions)(a) | 2004 | 2003 | 2002 | 2001 | 2000 | |||||||||||||||
Balance at beginning of year |
$ | 4,523 | $ | 5,350 | $ | 4,524 | $ | 3,665 | $ | 3,738 | ||||||||||
Addition resulting from the Merger, July 1, 2004 |
3,123 | — | — | — | — | |||||||||||||||
Provision for loan losses |
2,883 | 1,579 | 4,039 | 3,185 | 1,377 | |||||||||||||||
U.S. charge-offs |
||||||||||||||||||||
Commercial and industrial |
(483 | ) | (668 | ) | (967 | ) | (852 | ) | (293 | ) | ||||||||||
Commercial real estate |
(17 | ) | (2 | ) | (5 | ) | (7 | ) | (3 | ) | ||||||||||
Financial institutions |
(8 | ) | (5 | ) | (19 | ) | (35 | ) | (28 | ) | ||||||||||
Consumer |
(3,079 | ) | (1,646 | ) | (2,070 | ) | (1,485 | ) | (1,067 | ) | ||||||||||
Total U.S. charge-offs |
(3,587 | ) | (2,321 | ) | (3,061 | ) | (2,379 | ) | (1,391 | ) | ||||||||||
Non-U.S. charge-offs |
||||||||||||||||||||
Commercial and industrial |
(211 | ) | (470 | ) | (955 | ) | (192 | ) | (208 | ) | ||||||||||
Financial institutions |
(6 | ) | (26 | ) | (43 | ) | (1 | ) | (2 | ) | ||||||||||
Non-U.S. governments |
— | — | — | (9 | ) | (1 | ) | |||||||||||||
Consumer |
(1 | ) | (1 | ) | (1 | ) | (1 | ) | (32 | ) | ||||||||||
Total non-U.S. charge-offs |
(218 | ) | (497 | ) | (999 | ) | (203 | ) | (243 | ) | ||||||||||
Total charge-offs |
(3,805 | ) | (2,818 | ) | (4,060 | ) | (2,582 | ) | (1,634 | ) | ||||||||||
U.S. recoveries |
||||||||||||||||||||
Commercial and industrial |
202 | 167 | 45 | 56 | 24 | |||||||||||||||
Commercial real estate |
20 | 5 | 24 | 9 | 8 | |||||||||||||||
Financial institutions |
8 | 5 | 1 | 12 | 2 | |||||||||||||||
Consumer |
319 | 191 | 276 | 132 | 96 | |||||||||||||||
Total U.S. recoveries |
549 | 368 | 346 | 209 | 130 | |||||||||||||||
Non-U.S. recoveries |
||||||||||||||||||||
Commercial and industrial |
124 | 155 | 36 | 30 | 90 | |||||||||||||||
Financial institutions |
32 | 23 | 1 | 7 | 10 | |||||||||||||||
Non-U.S. governments |
— | — | 1 | — | 1 | |||||||||||||||
Consumer |
1 | — | — | 1 | 3 | |||||||||||||||
Total non-U.S. recoveries |
157 | 178 | 38 | 38 | 104 | |||||||||||||||
Total recoveries |
706 | 546 | 384 | 247 | 234 | |||||||||||||||
Net charge-offs |
(3,099 | ) | (2,272 | ) | (3,676 | ) | (2,335 | ) | (1,400 | ) | ||||||||||
Charge to conform to FFIEC revised policy |
— | — | — | — | (80 | ) | ||||||||||||||
Allowance related to purchased portfolios |
— | — | 460 | — | 29 | |||||||||||||||
Other(b) |
(110 | ) | (134 | ) | 3 | 9 | 1 | |||||||||||||
Balance at year-end |
$ | 7,320 | $ | 4,523 | $ | 5,350 | $ | 4,524 | $ | 3,665 | ||||||||||
| (a) | 2004 results include six months of the combined Firm’s results and six months
of heritage JPMorgan Chase results. All other periods reflect the results of heritage JPMorgan
Chase only. |
|
| (b) | Primary relates to the transfer of the allowance for accrued interest and fees on reported and
securitized credit card loans in 2004 and 2003. |
Allowance for lending-related commitments
| Year ended December 31, (in millions)(a) | 2004 | 2003 | 2002 | 2001 | 2000 | |||||||||||||||
Balance at beginning of year |
$ | 324 | $ | 363 | $ | 282 | $ | 283 | $ | 295 | ||||||||||
Addition resulting from the Merger, July 1, 2004 |
508 | — | — | — | — | |||||||||||||||
Provision for lending-related commitments |
(339 | ) | (39 | ) | 292 | (3 | ) | 3 | ||||||||||||
U.S.
charge-offs – commercial and industrial |
— | — | (212 | ) | — | — | ||||||||||||||
Non-U.S.
charge-offs – commercial and industrial |
— | — | — | — | (15 | ) | ||||||||||||||
Total charge-offs |
— | — | (212 | ) | — | (15 | ) | |||||||||||||
Non-U.S.
recoveries – commercial and industrial |
— | — | — | 3 | — | |||||||||||||||
Total recoveries |
— | — | — | 3 | — | |||||||||||||||
Net charge-offs |
— | — | (212 | ) | 3 | (15 | ) | |||||||||||||
Other |
(1 | ) | — | 1 | (1 | ) | — | |||||||||||||
Balance at year-end |
$ | 492 | $ | 324 | $ | 363 | $ | 282 | $ | 283 | ||||||||||
| (a) | 2004 results include six months of the combined Firm’s results and six months of heritage
JPMorgan Chase results. All other periods reflect the results of heritage JPMorgan Chase only. |
| 141 |
Table of Contents
| Loan loss analysis | ||||||||||||||||||||
| Year ended December 31, (in millions, except ratios)(a) | 2004 | 2003 | 2002 | 2001 | 2000 | |||||||||||||||
Balances |
||||||||||||||||||||
Loans – average |
$ | 308,450 | $ | 220,692 | $ | 211,432 | $ | 219,843 | $ | 209,488 | ||||||||||
Loans – year-end |
402,114 | 214,766 | 216,364 | 217,444 | 216,050 | |||||||||||||||
Net charge-offs(b) |
3,099 | 2,272 | 3,676 | 2,335 | 1,480 | (c) | ||||||||||||||
Allowance for loan losses: |
||||||||||||||||||||
U.S. |
6,617 | 3,677 | 4,122 | 3,743 | 3,006 | |||||||||||||||
Non-U.S. |
703 | 846 | 1,228 | 781 | 659 | |||||||||||||||
Total allowance for loan losses |
7,320 | 4,523 | 5,350 | 4,524 | 3,665 | |||||||||||||||
Nonperforming loans |
2,743 | 2,584 | 4,234 | 2,613 | 1,818 | |||||||||||||||
Ratios |
||||||||||||||||||||
Net charge-offs to: |
||||||||||||||||||||
Loans – average(d) |
1.08 | % | 1.19 | % | 1.90 | % | 1.13 | % | 0.73 | % | ||||||||||
Allowance for loan losses |
42.34 | 50.23 | 68.71 | 51.61 | 40.38 | |||||||||||||||
Allowance for loan losses to: |
||||||||||||||||||||
Loans – year-end(d) |
1.94 | 2.33 | 2.80 | 2.25 | 1.77 | |||||||||||||||
Nonperforming loans(d) |
268 | 180 | 128 | 181 | 202 | |||||||||||||||
| (a) | 2004 results include six months of the combined Firm’s results and six months of
heritage JPMorgan Chase results. All other periods reflect the results of heritage JPMorgan Chase
only. |
|
| (b) | Excludes net charge-offs (recoveries) on lending-related commitments of $212 million,
$(3) million and $15 million in 2002, 2001 and 2000, respectively. There were no net
charge-offs (recoveries) on lending-related commitments in 2004 or 2003. |
|
| (c) | Includes a charge of $80 million to conform to FFIEC revised policy. |
|
| (d) | Excludes loans held for sale. |
Deposits
| Average balances(a) | Average interest rates(a) | |||||||||||||||||||||||
| (in millions, except interest rates) | 2004 | 2003 | 2002 | 2004 | 2003 | 2002 | ||||||||||||||||||
U.S.: |
||||||||||||||||||||||||
Noninterest-bearing demand |
$ | 31,733 | $ | 22,289 | $ | 23,506 | — | % | — | % | — | % | ||||||||||||
Interest-bearing demand |
11,040 | 4,859 | 4,192 | 1.31 | 1.22 | 1.02 | ||||||||||||||||||
Savings |
176,850 | 104,863 | 84,215 | 0.79 | 0.75 | 0.26 | ||||||||||||||||||
Time |
73,757 | 55,911 | 57,929 | 1.54 | 1.51 | 3.71 | ||||||||||||||||||
Total U.S. deposits |
293,380 | 187,922 | 169,842 | 0.91 | 0.90 | 1.42 | ||||||||||||||||||
Non-U.S.: |
||||||||||||||||||||||||
Noninterest-bearing demand |
6,479 | 6,561 | 7,395 | — | — | — | ||||||||||||||||||
Interest-bearing demand |
56,870 | 66,460 | 56,331 | 1.62 | 1.63 | 2.34 | ||||||||||||||||||
Savings |
746 | 607 | 1,008 | 0.11 | 0.15 | 0.56 | ||||||||||||||||||
Time |
53,539 | 43,735 | 52,840 | 1.88 | 1.90 | 2.87 | ||||||||||||||||||
Total non-U.S. deposits(b) |
117,634 | 117,363 | 117,574 | 1.64 | 1.63 | 2.42 | ||||||||||||||||||
Total deposits |
$ | 411,014 | $ | 305,285 | $ | 287,416 | 1.12 | % | 1.18 | % | 1.83 | % | ||||||||||||
| (a) | 2004 results include six months of the combined Firm’s results and six months of heritage
JPMorgan Chase results. All other periods reflect the results of heritage JPMorgan Chase only. |
|
| (b) | The majority of non-U.S. deposits were in denominations of $100,000 or more. |
At December 31, 2004, other U.S. time deposits in denominations of $100,000 or more totaled $52 billion, substantially all of which mature in three months or less. In addition, the table below presents the maturities for U.S. time certificates of deposit in denominations of $100,000 or more:
| 3 months | Over 3 months | Over 6 months | Over | |||||||||||||||||
| By remaining maturity at December 31, 2004 (in millions) | or less | but within 6 months | but within 12 months | 12 months | Total | |||||||||||||||
U.S. time certificates of deposit ($100,000 or more) |
$ 8,980 | $ 2,932 | $ 2,345 | $ 3,817 | $ 18,074 | |||||||||||||||
| 142 |
Table of Contents
Short-term and other borrowed funds
The following table provides a summary of JPMorgan Chase’s short-term and other borrowed funds for the years indicated:
| (in millions, except rates) | 2004(a) | 2003(a) | 2002(a) | |||||||||
Federal funds purchased and securities
sold under repurchase agreements: |
||||||||||||
Balance at year-end |
$ | 127,787 | $ | 113,466 | $ | 169,483 | ||||||
Average daily balance during the year |
155,665 | 161,020 | 168,428 | |||||||||
Maximum month-end balance |
168,257 | 205,955 | 198,110 | |||||||||
Weighted-average rate at December 31 |
2.13 | % | 1.17 | % | 1.45 | % | ||||||
Weighted-average rate during the year |
1.48 | 1.37 | 1.97 | |||||||||
Commercial paper: |
||||||||||||
Balance at year-end |
$ | 12,605 | $ | 14,284 | $ | 16,591 | ||||||
Average daily balance during the year |
12,699 | 13,387 | 16,134 | |||||||||
Maximum month-end balance |
15,300 | 15,769 | 23,726 | |||||||||
Weighted-average rate at December 31 |
2.56 | % | 0.98 | % | 1.36 | % | ||||||
Weighted-average rate during the year |
1.38 | 1.13 | 1.74 | |||||||||
Other borrowed funds:(b) |
||||||||||||
Balance at year-end |
$ | 96,981 | $ | 87,147 | $ | 75,810 | ||||||
Average daily balance during the year |
83,721 | 69,703 | 69,393 | |||||||||
Maximum month-end balance |
99,689 | 95,690 | 92,439 | |||||||||
Weighted-average rate at December 31 |
3.81 | % | 4.47 | % | 5.39 | % | ||||||
Weighted-average rate during the year |
4.56 | 5.05 | 4.96 | |||||||||
FIN 46 short-term beneficial interests:(c)(d) |
||||||||||||
Commercial paper: |
||||||||||||
Balance at year-end |
$ | 38,519 | $ | 6,321 | NA | |||||||
Average daily balance during the year |
19,472 | 6,185 | NA | |||||||||
Maximum month-end balance |
38,519 | 12,007 | NA | |||||||||
Weighted-average rate at December 31 |
2.23 | % | 0.88 | % | NA | |||||||
Weighted-average rate during the year |
1.80 | 1.11 | NA | |||||||||
Other borrowed funds: |
||||||||||||
Balance at year-end |
$ | 3,149 | $ | 3,545 | NA | |||||||
Average daily balance during the year |
3,219 | 2,048 | NA | |||||||||
Maximum month-end balance |
3,447 | 3,545 | NA | |||||||||
Weighted-average rate at December 31 |
1.93 | % | 2.26 | % | NA | |||||||
Weighted-average rate during the year |
1.10 | 0.83 | NA | |||||||||
| (a) | 2004 results include six months of the combined Firm’s results and six months of heritage
JPMorgan Chase results. All other periods reflect the results of heritage JPMorgan Chase only. |
|
| (b) |
Includes securities sold but not yet purchased. |
|
| (c) | Included on the Consolidated balance sheets in Beneficial interests issued by consolidated
variable interest entities. VIEs had unused commitments to borrow an additional $4.2 billion at
December 31, 2004 for general liquidity purposes. |
|
| (d) | Not applicable for years prior to 2003 since the Firm adopted FIN 46 during 2003. |
Federal funds purchased represents overnight funds. Securities sold under repurchase agreements generally mature between one day and three months. Commercial paper generally is issued in amounts not less than $100,000 and with maturities of 270 days or less. Other borrowed funds
consist of demand notes, term federal funds purchased and various other borrowings that generally have maturities of one year or less. At December 31, 2004, JPMorgan Chase had no lines of credit for general corporate purposes.
143
Table of Contents
Signatures
Pursuant to the requirements of Section 13 or 15(d) of the Securities Exchange Act of 1934, the registrant has duly caused this report to be signed on behalf of the undersigned, thereunto duly authorized.
| JPMorgan Chase & Co. |
||||||
| (Registrant) |
||||||
| By: | /s/ WILLIAM B. HARRISON, JR. | |||||
| (William B. Harrison, Jr. | ||||||
| Chairman and Chief Executive Officer) | ||||||
| Date: March 1, 2005 | ||||||
Pursuant to the requirements of the Securities Exchange Act of 1934, this report has been signed below by the following persons on behalf of the registrant and in the capacity and on the date indicated. JPMorgan Chase does not exercise the power of attorney to sign on behalf of any Director.
| Capacity | Date | ||||
/s/ WILLIAM B. HARRISON, JR.
|
Director, Chairman and Chief Executive Officer | ||||
(William B. Harrison, Jr.)
|
(Principal Executive Officer) | ||||
/s/ JAMES DIMON
|
Director, President and Chief Operating Officer | ||||
(James Dimon) |
|||||
/s/ HANS W. BECHERER
|
Director | ||||
(Hans W. Becherer) |
|||||
/s/ JOHN H. BIGGS
|
Director | ||||
(John H. Biggs)
|
March 1, 2005 | ||||
/s/ LAWRENCE A. BOSSIDY
|
Director | ||||
(Lawrence A. Bossidy) |
|||||
/s/ STEPHEN B. BURKE
|
Director | ||||
(Stephen B. Burke) |
|||||
/s/ JAMES S. CROWN
|
Director | ||||
(James S. Crown) |
|||||
/s/ ELLEN V. FUTTER
|
Director | ||||
(Ellen V. Futter) |
144
Table of Contents
| Capacity | Date | ||||
/s/ WILLIAM H. GRAY, III
|
Director | ||||
(William H. Gray, III) |
|||||
/s/ LABAN P. JACKSON, JR.
|
Director | ||||
(Laban P. Jackson, Jr.) |
|||||
/s/ JOHN W. KESSLER
|
Director | ||||
(John W. Kessler) |
|||||
/s/ ROBERT I. LIPP
|
Director | ||||
(Robert I. Lipp) |
|||||
/s/ RICHARD A. MANOOGIAN
|
Director | ||||
(Richard A. Manoogian)
|
March 1, 2005 | ||||
/s/ DAVID C. NOVAK
|
Director | ||||
(David C. Novak) |
|||||
/s/ LEE R. RAYMOND
|
Director | ||||
(Lee R. Raymond) |
|||||
/s/ JOHN R. STAFFORD
|
Director | ||||
(John R. Stafford) |
|||||
/s/ MICHAEL J. CAVANAGH
|
Executive Vice President | ||||
(Michael J. Cavanagh)
|
and Chief Financial Officer | ||||
| (Principal Financial Officer) | |||||
/s/ JOSEPH L. SCLAFANI
|
Executive Vice President and Controller | ||||
(Joseph L. Sclafani)
|
(Principal Accounting Officer) |
145
Exhibit 3.1
RESTATED CERTIFICATE OF INCORPORATION
of
JPMORGAN CHASE & CO.
Under Section 245
of the
General Corporation Law of the State of Delaware
JPMorgan Chase & Co. (the “Corporation”), does hereby certify under the seal of the Corporation as follows:
First: The name of the Corporation is JPMorgan Chase & Co.; the Corporation was originally incorporated as Chemical New York Corporation.
Second: The Certificate of Incorporation of the Corporation was filed with the Secretary of State of the State of Delaware in Dover, Delaware, on the 28th day of October, 1968.
Third: This Restated Certificate of Incorporation was duly adopted in accordance with Section 245 of the General Corporation Law of Delaware and only restates and integrates and does not further amend the provisions of the Corporation’s Restated Certificate of Incorporation as heretofore restated, amended and supplemented. There is no discrepancy between those provisions and the provisions of this Restated Certificate of Incorporation.
Fourth: The text of the Restated Certificate of Incorporation of the Corporation, as amended, is hereby restated to read in full, as follows:
FIRST. The name of the Corporation is JPMorgan Chase & Co.
SECOND. The address of its registered office in the State of Delaware is Corporation Trust Center, 1209 Orange Street, Wilmington, New Castle County, Delaware 19801. The name of its registered agent at such address is The Corporation Trust Company.
THIRD. The purpose of the Corporation is to engage in any lawful act or activity for which corporations may be organized under the General Corporation Law of Delaware. Without limiting in any manner the scope and generality of the foregoing, the Corporation shall have the following purposes and powers:
(1) To acquire by purchase, subscription, or otherwise, and to receive, hold, own, guarantee, sell, assign, exchange, transfer, mortgage, pledge, or otherwise dispose of or deal in and with any and all securities, as such term is hereinafter defined, issued or created by any corporation, firm, organization, association or other entity, public or private, whether formed under the laws of the United States of America or of any state, commonwealth, territory, dependency or possession thereof, or of any foreign country or of any political subdivision, territory, dependency, possession or municipality thereof, or issued or created by the United States of America or any state or commonwealth thereof or any foreign country, or by any agency, subdivision, territory, dependency, possession or municipality of any of the foregoing, and as owner thereof to possess and exercise all
the rights, powers and privileges of ownership, including the right to execute consents and vote thereon;
(2) to make, establish and maintain investments in securities, and to supervise and manage such investments;
(3) to cause to be organized under the laws of the United States of America or of any state, commonwealth, territory, dependency or possession thereof, or of any foreign country or of any political subdivision, territory, dependency, possession or municipality thereof, one or more corporations, firms, organizations, associations or other entities and to cause the same to be dissolved, wound up, liquidated, merged or consolidated;
(4) to acquire by purchase or exchange, or by transfer to or by merger or consolidation with the Corporation or any corporation, firm, organization, association or other entity owned or controlled, directly or indirectly, by the Corporation, or to otherwise acquire, the whole or any part of the business, good will, rights or other assets of any corporation, firm, organization, association or other entity, and to undertake or assume in connection therewith the whole or any part of the liabilities and obligations thereof, to effect any such acquisition in whole or in part by delivery of cash or other property, including securities issued by the Corporation, or by any other lawful means;
(5) to make loans and give other forms of credit, with or without security, and to negotiate and make contracts and agreements in connection therewith;
(6) to aid by loan, subsidy, guaranty or in any other lawful manner any corporation, firm, organization, association or other entity of which any securities are in any manner directly or indirectly held by the Corporation or in which the Corporation or any such corporation, firm, organization, association or entity may be or become otherwise interested; to guarantee the payment of dividends on any stock issued by any such corporation, firm, organization, association or entity; to guarantee or, with or without recourse against any such corporation, firm, organization, association or entity, to assume the payment of the principal of, or the interest on, any obligations issued or incurred by such corporation, firm, organization, association or entity; to do any and all other acts and things for the enhancement, protection or preservation of any securities which are in any manner, directly or indirectly, held, guaranteed or assumed by the Corporation, and to do any and all acts and things designed to accomplish any such purpose;
(7) to borrow money for any business, object or purpose of the Corporation from time to time, without limit as to amount; to issue any kind of evidence of indebtedness, whether or not in connection with borrowing money, including evidences of indebtedness convertible into stock of the Corporation, to secure the payment of any evidence of indebtedness by the creation of any interest in any of the property or rights of the Corporation, whether at that time owned or thereafter acquired;
2
(8) to render service, assistance, counsel and advice to, and to act as representative or agent in any capacity (whether managing, operating, financial, purchasing, selling, advertising or otherwise) of, any corporation, firm, organization, association or other entity; and
(9) to engage in any commercial, financial, mercantile, industrial, manufacturing, marine, exploration, mining, agricultural, research, licensing, servicing, or agency business not prohibited by law, and any, some or all of the foregoing.
The term “securities” as used in this Certificate of Incorporation shall mean any and all notes, stocks, treasury stocks, bonds, debentures, evidences of indebtedness, certificates of interest or participation in any profit-sharing agreement, collateral-trust certificates, preorganization certificates or subscriptions, transferable shares, investment contracts, voting trust certificates, certificates of deposit for a security, fractional undivided interests in oil, gas, or other mineral rights, or, in general, any interests or instruments commonly known as “securities”, or any and all certificates of interest or participation in, temporary or interim certificates for, receipts for, guaranties of, or warrants or rights to subscribe to or purchase, any of the foregoing.
The purposes and powers specified in the foregoing paragraphs shall, except where otherwise expressed, be in nowise limited or restricted by reference to, or inference from, the terms of any other paragraph in this Certificate of Incorporation, but the purposes and powers specified in each of the foregoing paragraphs of this Article THIRD shall be regarded as independent purposes and powers.
The Corporation shall possess and may exercise all powers and privileges necessary or convenient to effect any or all of the foregoing purposes, or to further any or all of the foregoing powers, and the enumeration herein of any specific purposes or powers shall not be held to limit or restrict in any manner the exercise by the Corporation of the general powers and privileges now or hereafter conferred by the laws of the State of Delaware upon corporations formed under the General Corporation Law of Delaware.
FOURTH. The total number of shares of all classes of capital stock which the Corporation shall have authority to issue is NINE BILLION TWO HUNDRED MILLION, of which TWO HUNDRED MILLION shares shall be shares of preferred stock of the par value of $1 per share (hereinafter called “Preferred Stock”) and NINE BILLION shares shall be shares of common stock of the par value of $1 per share (hereinafter called “Common Stock”).
Any amendment to this Certificate of Incorporation which shall increase or decrease the authorized capital stock of the Corporation may be adopted by the affirmative vote of the holders of capital stock representing not less than a majority of the voting power represented by the outstanding shares of capital stock of the Corporation entitled to vote.
The designations and the powers, preferences and rights, and the qualifications, limitations or restrictions thereof, of the Preferred Stock shall be as follows:
(1) The Board of Directors is expressly authorized at any time, and from time to time, to provide for the issuance of shares of Preferred Stock in one or more series, with such voting powers, full or limited but not to exceed one vote per share, or without
3
voting powers and with such designations, preferences and relative, participating, optional or other special rights, and qualifications, limitations or restrictions thereof, as shall be stated and expressed in the resolution or resolutions providing for the issue thereof adopted by the Board of Directors, and as are not stated and expressed in this Certificate of Incorporation, or any amendment thereto, including (but without limiting the generality of the foregoing) the following:
(a) the designation of such series;
(b) the dividend rate of such series, the conditions and dates upon which such dividends shall be payable, the preference or relation which such dividends shall bear to the dividends payable on any other class or classes or on any other series of any class or classes of capital stock, and whether such dividends shall be cumulative or non-cumulative;
(c) whether the shares of such series shall be subject to redemption by the Corporation, and, if made subject to such redemption, the times, prices and other terms and conditions of such redemption;
(d) the terms and amount of any sinking fund provided for the purchase or redemption of the shares of such series;
(e) whether or not the shares of such series shall be convertible into or exchangeable for shares of any other class or classes or of any other series of any class or classes of capital stock of the Corporation, and, if provision be made for conversion or exchange, the times, prices, rates, adjustments and other terms and conditions of such conversion or exchange;
(f) the extent, if any, to which the holders of the shares of such series shall be entitled to vote as a class or otherwise with respect to the election of the directors or otherwise; provided, however, that in no event shall any holder of any series of Preferred Stock be entitled to more than one vote for each share of such Preferred Stock held by him;
(g) the restrictions, if any, on the issue or reissue of any additional Preferred Stock;
(h) the rights of the holders of the shares of such series upon the dissolution of, or upon the distribution of assets of, the Corporation.
(2) Except as otherwise required by law and except for such voting powers with respect to the election of directors or other matters as may be stated in the resolutions of the Board of Directors creating any series of Preferred Stock, the holders of any such series shall have no voting power whatsoever.
(3) The voting powers, designations, preferences and relative, participating, optional or other special rights, and the qualifications, limitations or restrictions thereof,
4
of the Corporation’s 6 5/8% Cumulative Preferred Stock, are set forth in Appendix A hereto and are incorporated by reference.
(4) The voting powers, designations, preferences and relative, participating, optional or other special rights, and the qualifications, limitations or restrictions thereof, of the Corporation’s Fixed/Adjustable Rate Noncumulative Preferred Stock, are set forth in Appendix B hereto and are incorporated by reference.
FIFTH. The by-laws may be made, altered, amended or repealed by the Board of Directors. The books of the Corporation (subject to the provisions of the laws of the State of Delaware) may be kept outside of the State of Delaware at such places as from time to time may be designated by the Board of Directors.
SIXTH. (1) To the fullest extent that the General Corporation Law of the State of Delaware as it exists on the date hereof or as it may hereafter be amended permits the limitation or elimination of the liability of directors, no director of the Corporation shall be personally liable to the Corporation or its stockholders for monetary damages for breach of fiduciary duty as a director.
(2) The Corporation shall have the power to indemnify any director, officer, employee or agent of the Corporation or any other person who is serving at the request of the Corporation in any such capacity with another corporation, partnership, joint venture, trust or other enterprise (including, without limitation, any employee benefit plan) to the fullest extent permitted by the General Corporation Law of the State of Delaware as it exists on the date hereof or as it may hereafter be amended, and any such indemnification may continue as to any person who has ceased to be a director, officer, employee or agent and may inure to the benefit of the heirs, executors and administrators of such a person.
(3) By action of its Board of Directors, notwithstanding any interest of the directors in the action, the Corporation may purchase and maintain insurance, in such amounts as the Board of Directors deems appropriate, to protect any director, officer, employee or agent of the Corporation or any other person who is serving at the request of the Corporation in any such capacity with another corporation, partnership, joint venture, trust or other enterprise (including, without limitation, any employee benefit plan) against any liability asserted against him or incurred by him in any such capacity or arising out of his status as such (including, without limitation, expenses, judgments, fines and amounts paid in settlement) to the fullest extent permitted by the General Corporation Law of the State of Delaware as it exists on the date hereof or as it may hereafter be amended, and whether or not the Corporation would have the power or would be required to indemnify any such person under the terms of any agreement or by-law or the General Corporation Law of the State of Delaware. For purposes of this paragraph (3), “fines” shall include any excise taxes assessed on a person with respect to any employee benefit plan.
SEVENTH. (1) Any action required or permitted to be taken by the holders of Common Stock of the Corporation must be effected at a duly called annual or special meeting of the stockholders of the Corporation and may not be effected by any consent in writing.
5
(2) Whenever the vote of holders of shares of any class or series other than Common Stock at a meeting thereof is required or permitted to be taken for or in connection with any corporate action by any provision of the General Corporation Law of the State of Delaware, the meeting and vote of such stockholders may be dispensed with if such action is taken with the written consent of such holders representing not less than a majority of the voting power of all the capital stock of such class or series entitled to be voted upon such action if a meeting were held; provided that in no case shall the written consent be by such holders having less than the minimum percentage of the vote required by statute for such action, and provided that prompt notice is given in writing to all such stockholders entitled to vote thereon of the taking of corporate action without a meeting and by less than unanimous written consent.
(3) Election of directors need not be by ballot unless the by-laws so provide.
EIGHTH. The Corporation reserves the right to amend, alter, change or repeal any provision contained in this Certificate of Incorporation, in the manner now or hereafter prescribed by statute, and all rights conferred upon stockholders herein are granted subject to this reservation.
6
IN WITNESS WHEREOF, the Corporation has caused this certificate to be signed by its authorized officer and caused the corporate seal of the Corporation to be hereunto affixed this 18th day of January, 2005.
| By /s/ Anthony J. Horan | ||
| Anthony J. Horan Corporate Secretary |
||
[Corporate Seal] |
Appendix A
CERTIFICATE OF DESIGNATIONS
OF
6 5/8% CUMULATIVE PREFERRED STOCK
OF
J.P. MORGAN CHASE & CO.
Pursuant to Section 151 of the
General Corporation law of the State of Delaware
J.P. MORGAN CHASE & CO., a corporation organized under the laws of the State of Delaware (the “Corporation”), HEREBY CERTIFIES that the following resolutions were duly adopted by the Board of Directors of the Corporation at a meeting duly held and convened on September 12, 2000, and by the Stock Committee of the Board of Directors by unanimous written consent executed on December 18, 2000, pursuant to the authority conferred upon the Board of Directors by the provisions of the Restated Certificate of Incorporation of the Corporation, which authorized the issuance of up to 200,000,000 shares of preferred stock, par value $1.00 per share, and pursuant to authority conferred upon the Stock Committee of the Board of Directors by Section 141(c) of the General Corporation Law of the State of Delaware, by the By-Laws of the Corporation and by resolutions of the Board of Directors adopted at a meeting duly convened and held on September 12, 2000:
1. The Board of Directors on September 12, 2000 adopted the following resolutions authorizing the Stock Committee of the Board of Directors to act on behalf of the Board of Directors in connection with the issuance of Preferred Stock pursuant to the terms and conditions of the Agreement and Plan of Merger, dated as of September 12, 2000, between J.P. Morgan & Co. Incorporated (“J.P. Morgan”) and the Corporation, which provided for the merger of J.P. Morgan with and into the Corporation, with the Corporation continuing as the surviving corporation in the merger under the name “J.P. Morgan Chase & Co.”:
RESOLVED, that it is advisable and in the best interests of The Chase Manhattan Corporation (the “Corporation”) and its stockholders for the Corporation to enter into the Agreement and Plan of Merger between the Corporation and J.P. Morgan & Co. Incorporated, a Delaware corporation (“J.P. Morgan”), substantially in the form presented to this Meeting (the “Merger Agreement”), pursuant to which, among other things: (i) J.P. Morgan would merge with and into the Corporation (the “Merger”); (ii) in accordance with the terms and conditions of the Merger Agreement, each then outstanding share of common stock, par value $2.50 per share, of J.P. Morgan (“J.P. Morgan Common Stock”), other than shares which would be cancelled and retired and cease to exist as a result of the Merger, would be converted into 3.70 fully paid and nonassessable shares of common stock, par value $1.00 per share, of the Corporation (the “Common Stock”); (iii) each then outstanding share of preferred stock, without par value, of J.P. Morgan (the “J.P. Morgan Preferred Stock”), other than (A) shares which would be cancelled and retired and cease to exist as a result of the Merger and (B) shares as to which the holders have properly perfected any rights of appraisal pursuant to Section 262 of the Delaware General Corporation Law, shall be converted into a share of a corresponding series of preferred stock, par value $1.00 per share, of the Corporation (the “Preferred Stock”), in each case having substantially the same terms as the respective series of J.P. Morgan Preferred Stock being so converted (such Preferred Stock of the Corporation to be so issued being hereinafter referred to
A-1
as the “Merger Preferred Stock”); and (iv) the Corporation’s Certificate of Incorporation would be amended pursuant to the Merger Agreement and by virtue of the Merger to provide for (A) the change of the name of the Corporation to “J.P. Morgan Chase & Co.” and (B) the designation of each series of Merger Preferred Stock; and further
RESOLVED, that subject to stockholder approval of the Merger Agreement and to the filing with the Secretary of State of the State of Delaware of the certificates of designations referred to below with respect to each series of Merger Preferred Stock (collectively, the “Certificates of Designation”), the issuance of such shares of Merger Preferred Stock in accordance with the terms of the Merger Agreement be, and it hereby is, authorized and, upon such issuance, such shares of Merger Preferred Stock shall be validly issued, fully paid and nonassessable and free of preemptive rights; and further
RESOLVED, that the maximum number of shares of each series of Merger Preferred Stock authorized to be so issued in connection with the Merger upon conversion of the respective series of J.P. Morgan Preferred Stock shall be as follows: (i) up to 2,444,300 shares upon conversion of J.P. Morgan’s Adjustable Rate Cumulative Preferred Stock, Series A; (ii) up to 50,000 shares upon conversion of J.P. Morgan’s Variable Cumulative Preferred Stock, Series B; (iii) up to 50,000 shares upon conversion of J.P. Morgan’s Variable Cumulative Preferred Stock, Series C; (iv) up to 50,000 shares upon conversion of J.P. Morgan’s Variable Cumulative Preferred Stock, Series D; (v) up to 50,000 shares upon conversion of J.P. Morgan’s Variable Cumulative Preferred Stock, Series E; (vi) up to 50,000 shares upon conversion of J.P. Morgan’s Variable Cumulative Preferred Stock, Series F; and (vii) up to 400,000 shares upon conversion of J.P. Morgan’s 6 5/8% Cumulative Preferred Stock, Series H; and further
RESOLVED, that the voting powers, preferences and special rights of each series of Merger Preferred Stock shall be substantially identical to the voting powers, preferences and special rights applicable to, and specified in the certificate of designations with respect to, the respective series of J.P. Morgan Preferred Stock to be converted into such series of Merger Preferred Stock pursuant to the Merger, and that the Certificate of Designation for each series of Merger Preferred Stock shall provide for the voting rights specified in the corresponding series of J.P. Morgan Preferred Stock; and further
RESOLVED, that the Stock Committee of the Board of Directors be, and it hereby is, authorized to approve, within the limits specified in the foregoing resolutions, the form, terms and provisions of each Certificate of Designation and to take such other actions as such committee deems necessary or desirable to effect the issuance of the Merger Preferred Stock in accordance with these resolutions.
2. The Stock Committee of the Board of Directors on December 18, 2000, pursuant to authority conferred upon the Stock Committee of the Board of Directors by Section 141(c) of the General Corporation Law of the State of Delaware, by Section 3.03 of the By-Laws of the Corporation and by the resolutions of the Board of Directors set forth above, adopted the following resolution:
RESOLVED, that pursuant to resolutions of the Board of Directors of the Corporation adopted on September 12, 2000, the issue of up to 400,000 shares of 6 5/8%
A-2
Cumulative Preferred Stock, $1.00 par value, of the Corporation is hereby authorized, and the designation, preferences and privileges, relative, participating, optional and other special rights, and qualifications of all 400,000 shares of this series, in addition to those set forth in the Certificate of Incorporation are hereby fixed as follows:
1. Designation. The designation of such preferred stock shall be 6 5/8% Cumulative Preferred Stock (hereinafter referred to as the “6 5/8% Preferred Stock”) and the number of shares constituting such series is 400,000. Shares of the 6 5/8% Preferred Stock shall have a stated value of $500 per share. The number of authorized shares of the 6 5/8% Preferred Stock may be reduced by further resolution duly adopted by the by the Board of Directors of the Corporation, the Stock Committee, or any other duly authorized committee of the Board of Directors and by the filing of a certificate pursuant to the provisions of the General Corporation Law of the State of Delaware stating that such reduction has been so authorized but the number of authorized shares of the 6 5/8% Preferred Stock shall not be increased.
2. Dividends. (a) Holders of shares of 6 5/8% Preferred Stock shall be entitled to receive cash dividends when, as and if declared by the Board of Directors of the Corporation, out of funds legally available therefor, at a rate of 6 5/8% per annum on the stated value thereof in respect of the period that begins on January 1, 2001 and that shall end on and include March 31, 2001 (the “Initial Dividend Period”) and each quarterly dividend period thereafter, which quarterly dividend periods shall begin on January 1, April 1, July 1 and October 1 of each year and shall end on and include the day next preceding the first day of the next dividend period. Such dividends shall be cumulative from the first day of the Initial Dividend Period and shall be payable, when, as and if declared by the Board of Directors on March 31, June 30, September 30 and December 31 of each year. Each such dividend shall be paid to the holders of record of shares of 6 5/8% Preferred Stock at the close of business on the fifteenth day of the month next preceding the month in which such dividend payment is made. Dividends as provided for in this Paragraph 2, to the extent not declared and paid for any past dividend periods, may be declared and paid at any time, without reference to any regular dividend payment date, to holders of record on such date, not exceeding 45 days preceding the payment date therefor, as may be fixed by the Board of Directors of the Corporation, the Stock Committee, or any other duly authorized committee of the Board of Directors. Dividends payable on the 6 5/8% Preferred Stock for any period less than a full quarterly dividend period shall be computed on the basis of a 360-day year consisting of twelve 30-day months. The amount of dividends payable on shares of the 6 5/8% Preferred Stock for each full quarterly dividend period (including the Initial Dividend Period) shall be computed by dividing the annual dividend rate by four.
(b) No full dividends shall be declared or paid or set apart for payment on Preferred Stock of any series ranking, as to dividends, on a parity with the 6 5/8% Preferred Stock for any period unless full cumulative dividends have been or contemporaneously are declared and paid or declared and a sum sufficient for the payment thereof set apart for such payment on the 6 5/8% Preferred Stock for all dividend payment periods terminating on or prior to the date of payment of such full cumulative dividends. When dividends are not paid in full, as aforesaid, upon the shares of the 6 5/8% Preferred Stock and any other Preferred Stock ranking on a parity as to dividends with the 6 5/8% Preferred Stock, all dividends declared upon shares of the 6 5/8% Preferred Stock and any other Preferred Stock ranking on a parity as to dividends with the 6 5/8%
A-3
Preferred Stock shall be declared pro rata so that the amount of dividends declared per share on the 6 5/8% Preferred Stock and such other Preferred Stock shall in all cases bear to each other the same ratio that accrued dividends per share on the shares of the 6 5/8% Preferred Stock and such other Preferred Stock bear to each other. Holders of shares of the 6 5/8% Preferred Stock shall not be entitled to any dividend, whether payable in cash, property or stocks, in excess of full cumulative dividends, as herein provided, on the 6 5/8% Preferred Stock. No interest, or sum of money in lieu of interest, shall be payable in respect if any dividend payment of payments on the 6 5/8% Preferred Stock which may in arrears.
3. Redemption. The 6 5/8% Preferred Stock shall not be redeemable prior to March 31, 2006. On or after March 31, 2006, the Corporation, at its option, with prior approval of the appropriate bank regulators, if so required, may redeem the 6 5/8% Preferred Stock, as a whole or in part, at any time or from time to time out of funds legally available therefor, at a redemption price of $500 per share plus an amount equal to accrued and unpaid dividends thereon to the date fixed for redemption.
In the event the Corporation shall redeem shares of 6 5/8% Preferred Stock, notice of such redemption shall be given by first class mail, postage prepaid, mailed not less than 30 nor more than 60 days prior to the redemption date, to each holder of record of the shares to be redeemed, at such holder’s address as the same appears on the stock register of the Corporation. Each such notice shall state: (1) the redemption date; (2) the number of shares of 6 5/8% Preferred Stock to be redeemed and, if less than all the shares held by such holder are to be redeemed, the number of such shares to be redeemed from such holder; (3) the redemption price; (4) the place or places where certificates for such shares are to be surrendered for payment of the redemption price; and (5) that dividends on the shares to be redeemed will cease to accrue on such redemption date. Notice having been mailed as aforesaid, from and after the redemption date (unless default shall be made by the Corporation in providing money for the payment of the redemption price) dividends on the shares of the 6 5/8% Preferred Stock so called for redemption shall cease to accrue, and said shares shall no longer be deemed to be outstanding, and all rights of the holders thereof as stockholders of the Corporation (except the right to receive from the Corporation the redemption price) shall cease. Upon surrender in accordance with said notice of the certificates for any shares so redeemed (properly endorsed or assigned for transfer, if the Board of Directors of the Corporation shall so require and the notice shall so state), such shares shall be redeemed by the Corporation at the redemption price aforesaid. If less than all the outstanding shares of the 6 5/8% Preferred Stock are to be redeemed, shares to be redeemed shall be selected by the Corporation from outstanding shares of 6 5/8% Preferred Stock not previously called for redemption by lot or pro rata (as nearly as may be) or by any other method determined by the Corporation in its sole discretion to be equitable. A new certificate shall be issued representing the unredeemed shares without cost to the holder thereof.
Notwithstanding the foregoing provisions of this Section 3, if any dividends on the 6 5/8% Preferred Stock are in arrears, no shares of the 6 5/8% Preferred Stock shall be redeemed unless all outstanding shares of the 6 5/8% Preferred Stock are simultaneously redeemed, and the Corporation shall not purchase or otherwise acquire any shares of such Series; provided, however, that the foregoing shall not prevent the purchase or acquisition of shares of the 6 5/8% Preferred Stock pursuant to a purchase or exchange offer made on the same terms to holders of all outstanding shares of the 65/8% Preferred Stock.
A-4
4. Shares to be Retired. All shares of the 6 5/8% Preferred Stock redeemed by the Corporation shall be retired and canceled and shall not be reissued as shares of 6 5/8% Preferred Stock and upon the filing of any document required by the Delaware General Corporation Law shall be restored to the status of authorized but unissued shares of preferred stock, without designation as to series.
5. Conversion or Exchange. The holders of shares of the 6 5/8% Preferred Stock shall not have any rights to convert such shares into or exchange such shares for shares of any other class or classes or of any other series of any class or classes of capital stock of the Corporation.
6. Voting. The 6 5/8% Preferred Stock shall have no voting powers either general or special except as otherwise required by law and as hereinafter provided in this Section 6.
If at the time of any annual meeting of stockholders for the election of directors, the equivalent of six quarterly dividends (whether or not consecutive) payable on any share or shares of preferred stock are in default, the number of directors constituting the Board of Directors of the Corporation shall automatically be increased by two. The holders of record of the 6 5/8% Preferred Stock, voting separately as a class with the holders of shares of any one or more other series of preferred stock upon which like voting rights have been conferred (including, without limitation, the Corporation’s Adjustable Rate Cumulative Preferred Stock, Series A (the “Series A Preferred Stock”), Variable Cumulative Preferred Stock, Series B through F, 10.84% Cumulative Preferred Stock, Adjustable Cumulative Preferred Stock, Series L, and Adjustable Cumulative Preferred Stock, Series N (collectively, the “Outstanding Cumulative Preferred Stock”)), shall be entitled at said meeting of stockholders (and at each subsequent annual meeting of stockholders), unless all dividends in arrears have been paid or declared and set apart for payment prior thereto, to vote for the election of two directors of the Corporation, the holders of record of the 6 5/8% Preferred Stock and the Outstanding Cumulative Preferred Stock (other than the Series A Preferred Stock) being entitled to cast one vote per share and the holders of record of the Series A Preferred Stock being entitled to cast one-tenth (1/10) of one vote per share, with the remaining directors of the Corporation to be elected by the holders of record of shares of any other class or classes or series of stock entitled to vote therefor. Until the default in payments of all dividends which permitted the election of said directors shall cease to exist, any director who shall have been so elected pursuant to the next preceding sentence may be removed at any time, without cause, only by the affirmative vote of the holders of record of the shares of preferred stock at the time entitled to cast a majority of the votes entitled to be cast for the election of any such director at a special meeting of such holders of record called for that purpose, and any vacancy in such directorship thereby created or otherwise created may be filled only by the affirmative vote of the holders of record of the shares of preferred stock at the time entitled to cast a majority of the votes entitled to be cast for the election of any such director. If and when such default shall cease to exist, the holders of record of the 6 5/8% Preferred Stock and the holders of record of shares of any one or more series of preferred stock upon which like voting rights have been conferred (including, without limitation, the Outstanding Cumulative Preferred Stock) shall be divested of the foregoing special voting rights, subject to reinvesting in the event of each and every subsequent like default in payments of dividends. Upon the termination of the foregoing special voting rights, the terms of office of all persons who may
A-5
have been elected directors pursuant to said special voting rights will terminate, and the number of directors constituting the Board of Directors shall be automatically reduced by two. For the purposes of the foregoing, default in the payment of dividends for the equivalent of six quarterly dividends means, in the case of Preferred Stock which pays dividends either more or less frequently than every quarter, default in the payment of dividends in respect of one or more Dividend Periods containing in the aggregate not less than 540 days.
Unless the vote or consent of the holders of a greater number of shares shall then be required by law, the consent of the holders of record of at least 662/3% of all of the voting power of the 6 5/8% Preferred Stock and all other shares of the same class at the time outstanding (including, without limitation, the Outstanding Cumulative Preferred Stock and the Corporation’s Fixed/Adjustable Rate Noncumulative Preferred Stock (collectively with the Outstanding Cumulative Preferred Stock, the “Other Preferred Stock”)), given in person or by proxy, either in writing or by a vote at a meeting called for that purpose, voting as a class without regard to series, the holders of record of the 6 5/8% Preferred Stock and the Other Preferred Stock (other than the Series A Preferred Stock) being entitled to cast one vote per share and the holders of record of the Series A Preferred Stock being entitled to cast one-tenth (1/10) of one vote per share, shall be necessary for authorizing, effecting or validating the amendment, alteration or repeal of any of the provisions of the Restated Certificate of Incorporation or of any certificate amendatory thereof or supplemental thereto (including any Certificate of Designations, Rights and Preferences or any similar document relating to any series of preferred stock) so as to materially adversely affect the preferences, rights, powers or privileges of the 6 5/8% Preferred Stock and any other shares of the same class (including, without limitation, the Other Preferred Stock); provided, however, that in any case in which one or more, but not all, series of Other Preferred Stock or 6 5/8% Preferred Stock or other series of such class would be materially adversely affected as to the preferences, rights, powers or privileges thereof, the affirmative consent of holders of record of shares entitled to cast at least 662/3% of the votes entitled to be cast by the holders of all of the shares of all of the series that would be adversely affected, voting as a class, shall be required in lieu thereof.
Unless the vote or consent of the holders of record of a greater number of shares shall then be required by law, the consent of the holders of record of at least 662/3% of all of the voting power of the shares of the 6 5/8% Preferred Stock and all shares of all other series of preferred stock ranking on a parity (including, without limitation, the Other Preferred Stock) with shares of the 6 5/8% Preferred Stock, either as to dividends or upon liquidation, at the time outstanding, given in person or by proxy, either in writing or by a vote at a meeting called for the purpose at which the holders of record of shares of the 6 5/8% Preferred Stock, the Other Preferred Stock and shares of such other series of preferred stock shall vote together as a single class without regard to series, the holders of record of the 6 5/8% Preferred Stock and the Other Preferred Stock (other than the Series A Preferred Stock) being entitled to cast one vote per share and holders of record of Series A Preferred Stock being entitled to cast one-tenth (1/10) of one vote per share, shall be necessary to issue, authorize, or increase the authorized amount of, or issue or authorize any obligation or security convertible into or evidencing a right to purchase, any additional class or series of stock ranking prior to the 6 5/8% Preferred Stock, Other Preferred Stock or such other preferred stock as to dividends or upon liquidation.
A-6
7. Liquidation Preference. In the event of any voluntary or involuntary liquidation, dissolution or winding up of the Corporation, the holders of the 6 5/8% Preferred Stock shall be entitled to receive out of the assets of the Corporation available for distribution to stockholders, before any distribution of assets shall be made to the holders of Common Stock or of any other shares of stock of the Corporation ranking as to such a distribution junior to the 6 5/8% Preferred Stock, an amount equal to $500 per share plus an amount equal to any accrued and unpaid dividends thereon (whether or not earned or declared) to the date fixed for payment of such distribution. If upon any voluntary or involuntary liquidation, dissolution or winding up of the Corporation, the amounts payable with respect to the 6 5/8% Preferred Stock and any other shares of stock of the Corporation ranking as to any such distribution on a parity with the 6 5/8% Preferred Stock are not paid in full, the holders of the 6 5/8% Preferred Stock and of such other shares shall share ratably in any such distribution of assets of the Corporation in proportion to the full respective preferential amounts to which they are entitled. After payment to the holders of the 6 5/8% Preferred Stock of the full preferential amounts provided for in this Section 7, the holders of the 6 5/8% Preferred Stock shall be entitled to no further participation in any distribution of assets by the Corporation.
Neither the sale, conveyance, exchange or transfer of all or substantially all the property or business of the Corporation, the merger or consolidation of the Corporation into or with any other corporation nor the merger or consolidation of any other corporation into or with the Corporation shall be deemed to be a dissolution, liquidation or winding up, voluntary or involuntary, of the Corporation for the purposes of this Section 7.
8. Limitation on Dividends on Junior Ranking Stock. So long as any of the 6 5/8% Preferred Stock shall be outstanding, the Corporation shall not declare any dividends on the Common Stock of the Corporation or any other stock of the Corporation ranking as to dividends or distribution of assets junior to the 6 5/8% Preferred Stock (the “Junior Stock”), or make any payment on account of, or set apart money for, a sinking or other analogous fund for the purchase, redemption or other retirement of any shares of Junior Stock, or make any distribution in respect thereof, whether in cash or property or in obligations or stock of the Corporation, other than Junior Stock (such dividends, payments, setting apart and distributions being herein called “Junior Stock Payments”), unless full cumulative dividends shall have been paid or declared and set apart for payment upon all outstanding shares of preferred stock other than Junior Stock, at the date of such declaration in the case of any such dividend, or the date of such setting apart in the case of any such fund, or the date of such payment or distribution in the case of any other Junior Stock Payment.
9. Ranking of Stock of the Corporation. For purposes of this resolution, any stock of any class or classes of the Corporation shall be deemed to rank:
(1) prior to the shares of the 6 5/8% Preferred Stock, either as to dividends or upon liquidation, if the holders of such class or classes shall be entitled to the receipt of dividends or of amounts distributable upon dissolution, liquidation or winding up of the Corporation, as the case may be, in preference or priority to the holders of shares of the 6 5/8% Preferred Stock;
A-7
(2) on a parity with shares of the 6 5/8% Preferred Stock, either as to dividends or upon liquidation, whether or not the dividend rates, dividend payment dates or redemption or liquidation prices per share or sinking fund provisions, if any, be different from those of the 6 5/8% Preferred Stock, if the holders of such stock shall be entitled to the receipt of dividends or of amounts distributable upon dissolution, liquidation or winding up of the Corporation, as the case may be, in proportion to their respective dividend rates or liquidation prices, without preference or priority, one over the other, as between the holders of such stock and the holders of shares of the 6 5/8% Preferred Stock; and
(3) junior to shares of the 6 5/8% Preferred Stock, either as to dividends or upon liquidation, if such class shall be Common Stock or if the holders of shares of the 6 5/8% Preferred Stock shall be entitled to receipt of dividends or of amounts distributable upon dissolution, liquidation or winding up of the Corporation, as the case may be, in preference or priority to the holders of shares of such class or classes.
A-8
Appendix B
CERTIFICATE OF DESIGNATIONS
OF
FIXED/ADJUSTABLE RATE NONCUMULATIVE PREFERRED STOCK
OF
J.P. MORGAN CHASE & CO.
Pursuant to Section 151 of the
General Corporation Law of the State of Delaware
J.P. MORGAN CHASE & CO., a corporation organized and existing under the laws of the State of Delaware (the “Corporation”), HEREBY CERTIFIES that the following resolutions were duly adopted by the Board of Directors of the Corporation on January 20, 1998 and by the Stock Committee of the Board of Directors on May 14, 1998, respectively, pursuant to authority conferred upon the Board of Directors by the provisions of the Certificate of Incorporation of the Corporation which authorize the issuance of up to 200,000,000 shares of preferred stock of $1 par value per share (the “Preferred Stock”), and pursuant to authority conferred upon the Stock Committee of the Board of Directors by Section 141(c) of the General Corporation Law of the State of Delaware, by the By-Laws of the Corporation and by the resolutions of the Board of Directors adopted at a meeting duly convened and held on January 20, 1998:
1. The Board of Directors on January 20, 1998 adopted, among other resolutions, the following resolutions authorizing a Stock Committee of the Board of Directors to act on behalf of the Board of Directors in connection with the issuance of the Preferred Stock and fixing the voting rights of the Preferred Stock:
“RESOLVED that the Stock Committee may, from time to time during the Stock Committee Term, authorize the issuance and sale of securities which shall consist of any or all of the following: (i) one or more series of the Corporation’s preferred stock, $1 par value per share (the “Preferred Stock”); (ii) depositary shares each representing a fraction of a share of Preferred Stock or other security (“Depositary Shares”); (iii) warrants to purchase any shares of Preferred Stock or Depositary Shares; (iv) warrants to purchase shares of Common Stock; (v) any shares of Preferred Stock or Common Stock or other securities into which or for which any of the foregoing may be exchangeable, convertible, or issuable upon exercise, and (vi) any securities (or units or combinations of securities) (including, without limitation, any securities of an SPV (as defined below)) that the Corporation deems functionally equivalent to Preferred Stock by reason of such securities (or units or combinations of securities) counting as “Tier 1 capital” of the Corporation according to the bank regulatory agencies (all of the foregoing hereinafter collectively referred to as the “Preferred Shares” unless the context shall otherwise require; and the Preferred Shares and Common Stock hereinafter collectively referred to as “Securities”, unless the context shall otherwise require), for cash or other property, as shall be determined by the Stock Committee, subject to the limitations hereinafter set forth, and any such Preferred Shares may be sold through agents, through underwriters, through dealers and directly to purchasers, in one or more offerings registered under the Securities Act of 1933 (the “Act”) or in transactions not required to be registered under the Act, all as shall be determined by the Stock Committee; and the Stock Committee shall have full authority to take any and all actions
B-1
necessary to effect the intent of this resolution; and all Preferred Shares so issued will be deemed duly authorized, validly issued, fully paid and nonassessable;
RESOLVED that, without limiting the generality of the preceding resolution, the Stock Committee is hereby expressly authorized during the Stock Committee Term:
(i) to determine whether the Preferred Shares will be issued in one or more series and the number of shares of any such series;
(ii) to fix the dividend rate or rates of any such shares and/or the methods of determining dividends and the dates on which dividends shall be payable;
(iii) to determine whether dividends of any series of Preferred Shares shall be cumulative or noncumulative and, if cumulative, the dates from which dividends shall commence to cumulate;
(iv) to determine the conversion or exchange provisions, if any, of the shares of any series of the Preferred Shares, including without limitation, the class and series of capital stock or other securities of the Corporation into which such shares shall be convertible or exchangeable;
(v) to determine whether the Corporation shall elect to offer (a) warrants for such Preferred Shares (“Warrants”) or (b) Depositary Shares evidenced by depositary receipts, each representing a fraction (to be determined by the Stock Committee) of a share of a particular series of the Preferred Stock or other securities, which shares of Preferred Stock or other securities will be issued and deposited with a depositary, in each case, in lieu of offering full shares of such series of the Preferred Stock or other securities;
(vi) to fix the liquidation preference of the shares of any series of the Preferred Shares, subject to the limitation that the aggregate liquidation preference over Common Stock of all the Preferred Shares issued during the Stock Committee Term shall not exceed $1.0 billion (the “Preferred Stock Maximum Amount”);
(vii) to determine whether any warrants for Preferred Stock, Depositary Shares or Common Stock shall be issued, whether alone or in connection with any other Preferred Shares, and the terms and conditions of any such warrants;
(viii) to determine whether the shares of any series of the Preferred Shares shall be subject to redemption, optional or mandatory or pursuant to a sinking fund, and, if such series shall be subject to redemption, the redemption provisions of such series; and
(ix) to fix or determine any additional dividend, liquidation, redemption, sinking fund and other rights, preferences, privileges, limitations and restrictions thereof;
B-2
RESOLVED that, if required, for any series of Preferred Stock, a certificate shall be prepared and filed on behalf of the Corporation with the Secretary of State of the State of Delaware pursuant to Section 151 of the General Corporation Law of the State of Delaware (a “Certificate of Designation”); that each such Certificate of Designation be in such form as is approved by action of the Board of Directors or the Stock Committee; and that the proper officers of the Corporation be and hereby are authorized to execute and file each such Certificate of Designation pursuant to the General Corporation Law of the State of Delaware;
RESOLVED that the Certificate of Designation for each series of the Preferred Stock shall provide that the shares of such series shall not have any voting powers either general or special, except that
(i) if at the time of any annual meeting of the Corporation’s stockholders for the election of directors there is a default in preference dividends on the Preferred Stock, the number of directors constituting the Board of Directors of the Corporation shall be increased by two, and the holders of the Preferred Stock of all series (whether or not the holders of such series of Preferred Stock would be entitled to vote for the election of directors if such default in preference dividends did not exist), shall have the right at such meeting, voting together as a single class without regard to series, to the exclusion of the holders of common stock, par value $1 per share, of the Corporation, to elect two directors of the Corporation to fill such newly created directorships. Such right shall continue until there are no dividends in arrears upon the Preferred Stock. Each director elected by the holders of shares of Preferred Stock (a “Preferred Director”) shall continue to serve as such director for the full term for which he or she shall have been elected, notwithstanding that prior to the end of such term a default in preference dividends shall cease to exist. Any Preferred Director may be removed by, and shall not be removed except by, the vote of the holders of record of the outstanding shares of Preferred Stock, voting together as a single class without regard to series, at a meeting of the Corporation’s stockholders, or of the holders of shares of Preferred Stock, called for the purpose. So long as a default in any preference dividends on the Preferred Stock shall exist, (a) any vacancy in the office of a Preferred Director may be filled (except as provided in the following clause (b)) by an instrument in writing signed by the remaining Preferred Director and filed with the Corporation and (b) in the case of the removal of any Preferred Director, the vacancy may be filled by the vote of the holders of the outstanding shares of Preferred Stock, voting together as a single class without regard to series, at the same meeting at which such removal shall be voted. Each director appointed as aforesaid by the remaining Preferred Director shall be deemed, for all purposes hereof, to be a Preferred Director. Whenever the term of office of the Preferred Directors shall end and a default in preference dividends shall no longer exist, the number of directors constituting the Board of Directors of the Corporation shall be reduced by two. For the purposes hereof, a “default in preference dividends” on the Preferred Stock shall be deemed to have occurred whenever the amount of accrued dividends upon any series of the Preferred Stock shall be equivalent to six full quarter-yearly dividends or more, and, having so occurred, such default shall be deemed to exist thereafter until, but
B-3
only until, all accrued dividends on all shares of Preferred Stock of each and every series then outstanding shall have been paid to the end of the last preceding dividend period.
(ii) Without the consent of the holders of shares entitled to cast at least two-thirds of the votes entitled to be cast by the holders of the total number of shares of Preferred Stock then outstanding, voting as a class without regard to series, the holders of shares of this series being entitled to cast one vote per share thereon, the Corporation may not: (a) create any class or series of stock which shall have preference as to dividends or distribution of assets over any outstanding series of the Preferred Stock other than a series which shall not have any right to object to such creation or (b) alter or change the provisions of the Corporation’s Certificate of Incorporation so as to adversely affect the voting power, preferences or special rights of the holders of Preferred Stock; provided, however, that if such creation or such alteration or change would adversely affect the voting power, preferences or special rights of one or more, but not all, series of Preferred Stock at the time outstanding, consent of the holders of shares entitled to cast at least two-thirds of the votes entitled to be cast by the holders of all of the shares of all such series so affected, voting as a class, shall be required in lieu of the consent of the holders of shares entitled to cast at least two-thirds of the votes entitled to be cast by the holders of the total number of shares of Preferred Stock at the time outstanding.
2. The Stock Committee of the Board of Directors on May 14, 1998, pursuant to the authority conferred upon the Stock Committee of the Board of Directors by Section 141(c) of the General Corporation Law of the State of Delaware, by Section 3.03 of the By-Laws of the Corporation and by the resolutions of the Board of Directors set forth above, adopted the following resolution:
“RESOLVED that, pursuant to resolutions of the Board of Directors of J.P. Morgan Chase & Co. (the “Corporation”) adopted on January 20, 1998, the issue of 4,000,000 shares of Fixed/Adjustable Rate Noncumulative Preferred Stock, $50 stated value per share ($1 par value), of the Corporation ranking on a parity with the series of Preferred Stock of the Corporation designated as the Corporation’s: 10.96% Preferred Stock; 7-1/2% Cumulative Preferred Stock; Adjustable Rate Cumulative Preferred Stock, Series L; 10-1/2% Cumulative Preferred Stock; 9.76% Cumulative Preferred Stock; 10.84% Cumulative Preferred Stock; and Adjustable Rate Cumulative Preferred Stock, Series N, is hereby authorized and the designation, preferences and privileges, relative, participating, optional and other special rights, and qualifications, limitations and restrictions of all 4,000,000 shares of this Series, in addition to those set forth in the Restated Certificate of Incorporation of the Corporation and, with respect to voting rights, in the resolutions of the Board of Directors of the Corporation adopted on January 20, 1998, are hereby fixed as follows:
1. Designation. The designation of this Series shall be Fixed/Adjustable Rate Noncumulative Preferred Stock (hereinafter referred to as this “Series”), and the number of shares constituting this Series shall be 4,000,000. Shares of this Series shall have a stated value of $50. The number of authorized shares of this Series may be
B-4
reduced by further resolution duly adopted by the Board of Directors of the Corporation, the Stock Committee of the Board of Directors or by any other duly authorized committee of the Board of Directors (collectively, the “Board of Directors”) and by the filing of a certificate pursuant to the provisions of the General Corporation Law of the State of Delaware stating that such reduction has been so authorized, but the number of authorized shares of this Series shall not be increased.
2. Dividends. (a) The holders of shares of this Series shall be entitled to receive cash dividends, when, as and if declared by the Board of Directors, out of funds legally available for that purpose, in the amounts or at the rate set forth below in this Section 2. Dividends on the shares of this Series shall be payable, when, as and if declared by the Board of Directors, on March 31, June 30, September 30 and December 31 of each year (each, a “Dividend Payment Date”), commencing on September 30, 1998. Each such dividend shall be paid to the holders of record of shares of this Series as they appear on the stock register of the Corporation on such record date, not more than 45 days preceding the payment date thereof, as shall be fixed by the Board of Directors. Dividends on the shares of this Series shall not be cumulative and no rights shall accrue to the holders of the shares of this Series if the Corporation fails to declare a dividend on the shares of this Series with respect to any Dividend Period (as hereinafter defined), whether or not dividends are declared with respect to any future Dividend Period.
(b) Dividends payable on the shares of this Series for the period from May 21, 1998 through and including September 30, 1998 (the “Initial Dividend Period”) shall be $0.9024 per share. For each quarterly dividend period after the Initial Dividend Period (each such quarterly dividend period and the Initial Dividend Period being hereinafter referred to individually as a “Dividend Period”) through and including the Dividend Period ending June 30, 2003, dividends payable on the shares of this Series shall be payable at a rate per annum of the stated value thereof equal to 4.96%. For each Dividend Period beginning on or after July 1, 2003, dividends payable on the shares of this Series shall be payable at a rate per annum of the stated value thereof equal to the Applicable Rate (as defined in Section 3) in respect of such Dividend Period, expressed as a percentage to the nearest ten thousandth of a percentage point. The amount of dividends per share for each Dividend Period shall be computed by dividing the Applicable Rate for such Dividend Period by four and applying the resulting rate to the stated value per share of this Series. Each Dividend Period (other than the Initial Dividend Period) shall commence on the January 1, April 1, July 1 and October 1, as the case may be, following the last day of the Initial Dividend Period or the preceding Dividend Period, as the case may be, and shall end on and include the day next preceding the first day of the next such Dividend Period.
(c) Dividends payable on this Series for any period greater or less than a full Dividend Period, other than the Initial Dividend Period, shall be computed on the basis of a 360-day year consisting of twelve 30-day months and, for any period less than one month, the actual number of days elapsed in the period.
(d) No full dividends shall be declared or paid or set apart for payment on the Preferred Stock of any series ranking, as to dividends, on a parity with or junior to this
B-5
Series for any period unless full dividends on the shares of this Series for the Dividend Period commencing on the day following the immediately preceding Dividend Payment Date have been or contemporaneously are declared and paid or declared and a sum sufficient for the payment thereof set apart for such payment. When dividends are not paid in full, as aforesaid, upon the shares of this Series and any other series of Preferred Stock ranking on a parity as to dividends with this Series, all dividends declared upon shares of this Series and any other series of Preferred Stock ranking on a parity as to dividends with this Series shall be declared pro rata so that the amount of dividends declared per share on this Series and such other Preferred Stock shall in all cases bear to each other the same ratio that accrued and unpaid dividends per share (which in the case of this Series shall include accrued and unpaid dividends for the Dividend Period commencing on the day following the immediately preceding Dividend Payment Date but shall not include accumulation of any dividends for prior Dividend Periods, unless previously declared) on the shares of this Series and such other Preferred Stock bear to each other. No interest, or sum of money in lieu of interest, shall be payable in respect of any dividend payment or payments on this Series which may be in arrears.
(e) So long as any shares of this Series are outstanding, no dividend (other than a dividend in Common Stock or in any other stock ranking junior to this Series as to dividends and upon liquidation and other than as provided in paragraph (d) of this Section 2) shall be declared or paid or set aside for payment or other distribution declared or made upon the Common Stock or upon any other stock ranking junior to or on a parity with this Series as to dividends or upon liquidation, nor shall any Common Stock or any other stock of the Corporation ranking junior to or on a parity with this Series as to dividends or upon liquidation be redeemed, purchased or otherwise acquired for any consideration (or any moneys be paid to or made available for a sinking fund for the redemption of any shares of any such stock) by the Corporation (except by conversion into or exchange for stock of the Corporation ranking junior to this Series as to dividends and upon liquidation), unless, in each case, full dividends on all outstanding shares of this Series shall have been paid or declared and set aside for payment in respect of the Dividend Period commencing on the day following the immediately preceding Dividend Payment Date.
3. Definition of Applicable Rate, etc. (a) Except as provided below in this paragraph, the “Applicable Rate” for any Dividend Period beginning on or after July 1, 2003 shall be equal to the Effective Rate (as hereinafter defined) less 0.20%. The “Effective Rate” for any Dividend Period beginning on or after July 1, 2003 shall be equal to the highest of the Treasury Bill Rate, the Ten Year Constant Maturity Rate and the Thirty Year Constant Maturity Rate (each as hereinafter defined) for such Dividend Period. In the event that the Corporation determines in good faith that for any reason:
(i) any one of the Treasury Bill Rate, the Ten Year Constant Maturity Rate or the Thirty Year Constant Maturity Rate cannot be determined for any Dividend Period beginning on or after July 1, 2003, then the Effective Rate for such Dividend Period shall be equal to the higher of whichever two of such rates can be so determined;
B-6
(ii) only one of the Treasury Bill Rate, the Ten Year Constant Maturity Rate or the Thirty Year Constant Maturity Rate can be determined for any Dividend Period beginning on or after July 1, 2003, then the Effective Rate for such Dividend Period shall be equal to whichever such rate can be so determined; or
(iii) none of the Treasury Bill Rate, the Ten Year Constant Maturity Rate or the Thirty Year Constant Maturity Rate can be determined for any Dividend Period beginning on or after July 1, 2003, then the Effective Rate for the preceding Dividend Period shall be continued for such Dividend Period.
Anything herein to the contrary notwithstanding, the Applicable Rate for any Dividend Period shall in no event be less than 5.46% per annum or greater than 11.46% per annum (without taking into account adjustments described in paragraph 3(h) below).
(b) Except as described below in this paragraph, the “Treasury Bill Rate” for each applicable Dividend Period shall be the arithmetic average of the two most recent weekly per annum market discount rates (or the one weekly per annum market discount rate, if only one such rate is published during the relevant Calendar Period (as hereinafter defined)) for three-month U.S. Treasury bills, as published weekly by the Federal Reserve Board (as hereinafter defined) during the Calendar Period immediately preceding the last ten calendar days preceding the Dividend Period for which the dividend rate on this Series is being determined. In the event that the Federal Reserve Board does not publish such a weekly per annum market discount rate during such Calendar Period, then the Treasury Bill Rate for such Dividend Period shall be the arithmetic average of the two most recent weekly per annum market discount rates (or the one weekly per annum market discount rate, if only one such rate is published during the relevant Calendar Period) for three-month U.S. Treasury bills, as published weekly during such Calendar Period by any Federal Reserve Bank or by any U.S. Government department or agency selected by the Corporation. In the event that a per annum market discount rate for three-month U.S. Treasury bills is not published by the Federal Reserve Board or by any Federal Reserve Bank or by any U.S. Government department or agency during such Calendar Period, then the Treasury Bill Rate for such Dividend Period shall be the arithmetic average of the two most recent weekly per annum market discount rates (or the one weekly per annum market discount rate, if only one such rate is published during the relevant Calendar Period) for all of the U.S. Treasury bills then having remaining maturities of not less than 80 nor more than 100 days, as published during such Calendar Period by the Federal Reserve Board or, if the Federal Reserve Board does not publish such rates, by any Federal Reserve Bank or by any U.S. Government department or agency selected by the Corporation. In the event that the Corporation determines in good faith that for any reason no such U.S. Treasury bill rates are published as provided above during such Calendar Period, then the Treasury Bill Rate for such Dividend Period shall be the arithmetic average of the per annum market discount rates based upon the closing bids during such Calendar Period for each of the issues of marketable non-interest-bearing U.S. Treasury securities with a remaining maturity of not less than 80 nor more than 100 days from the date of each such quotation, as chosen and quoted daily for each business day in New York City (or less frequently if daily quotations are not generally
B-7
available) to the Corporation by at least three recognized dealers in U.S. Government securities selected by the Corporation. In the event that the Corporation determines in good faith that for any reason the Corporation cannot determine the Treasury Bill Rate for any applicable Dividend Period as provided above in this paragraph, the Treasury Bill Rate for such Dividend Period shall be the arithmetic average of the per annum market discount rates based upon the closing bids during such Calendar Period for each of the issues of marketable interest-bearing U.S. Treasury securities with a remaining maturity of not less than 80 nor more than 100 days, as chosen and quoted daily for each business day in New York City (or less frequently if daily quotations are not generally available) to the Corporation by at least three recognized dealers in U.S. Government securities selected by the Corporation.
(c) Except as described below in this paragraph, the “Ten Year Constant Maturity Rate” for each applicable Dividend Period shall be the arithmetic average of the two most recent weekly per annum Ten Year Average Yields (as hereinafter defined) (or the one weekly per annum Ten Year Average Yield, if only one such yield is published during the relevant Calendar Period), as published weekly by the Federal Reserve Board during the Calendar Period immediately preceding the last ten calendar days preceding the Dividend Period for which the dividend rate on this Series is being determined. In the event that the Federal Reserve Board does not publish such a weekly per annum Ten Year Average Yield during such Calendar Period, then the Ten Year Constant Maturity Rate for such Dividend Period shall be the arithmetic average of the two most recent weekly per annum Ten Year Average Yields (or the one weekly per annum Ten Year Average Yield, if only one such yield is published during the relevant Calendar Period), as published weekly during such Calendar Period by any Federal Reserve Bank or by any U.S. Government department or agency selected by the Corporation. In the event that a per annum Ten Year Average Yield is not published by the Federal Reserve Board or by any Federal Reserve Bank or by any U.S. Government department or agency during such Calendar Period, then the Ten Year Constant Maturity Rate for such Dividend Period shall be the arithmetic average of the two most recent weekly per annum average yields to maturity (or the one weekly per annum average yield to maturity, if only one such yield is published during the relevant Calendar Period) for all of the actively traded marketable U.S. Treasury fixed interest rate securities (other than Special Securities (as hereinafter defined)) then having remaining maturities of not less than eight nor more than twelve years, as published during such Calendar Period by the Federal Reserve Board or, if the Federal Reserve Board does not publish such yields, by any Federal Reserve Bank or by any U.S. Government department or agency selected by the Corporation. In the event that the Corporation determines in good faith that for any reason the Corporation cannot determine the Ten Year Constant Maturity Rate for any applicable Dividend Period as provided above in this paragraph, then the Ten Year Constant Maturity Rate for such Dividend Period shall be the arithmetic average of the per annum average yields to maturity based upon the closing bids during such Calendar Period for each of the issues of actively traded marketable U.S. Treasury fixed interest rate securities (other than Special Securities) with a final maturity date not less than eight nor more than twelve years from the date of each such quotation, as chosen and quoted daily for each business day in New York City (or less frequently if daily quotations are
B-8
not generally available) to the Corporation by at least three recognized dealers in U.S. Government securities selected by the Corporation.
(d) Except as described below in this paragraph, the “Thirty Year Constant Maturity Rate” for each applicable Dividend Period shall be the arithmetic average of the two most recent weekly per annum Thirty Year Average Yields (as hereinafter defined) (or the one weekly per annum Thirty Year Average yield, if only one such yield is published during the relevant Calendar Period), as published weekly by the Federal Reserve Board during the Calendar Period immediately preceding the last ten calendar days preceding the Dividend Period for which the dividend rate on this Series is being determined. In the event that the Federal Reserve Board does not publish such a weekly per annum Thirty Year Average Yield during such Calendar Period, then the Thirty Year Constant Maturity Rate for such Dividend Period shall be the arithmetic average of the two most recent weekly per annum Thirty Year Average Yields (or the one weekly per annum Thirty Year Average Yield, if only one such yield is published during the relevant Calendar Period), as published weekly during such Calendar Period by any Federal Reserve Bank or by any U.S. Government department or agency selected by the Corporation. In the event that a per annum Thirty Year Average Yield is not published by the Federal Reserve Board or by any Federal Reserve Bank or by any U.S. Government department or agency during such Calendar Period, then the Thirty Year Constant Maturity Rate for such Dividend Period shall be the arithmetic average of the two most recent weekly per annum average yields to maturity (or the one weekly per annum average yield to maturity, if only one such yield is published during the relevant Calendar Period) for all of the actively traded marketable U.S. Treasury fixed interest rate securities (other than Special Securities) then having remaining maturities of not less than twenty-eight nor more than thirty years, as published during such Calendar Period by the Federal Reserve Board or, if the Federal Reserve Board does not publish such yields, by any Federal Reserve Bank or by any U.S. Government department or agency selected by the Corporation. In the event that the Corporation determines in good faith that for any reason the Corporation cannot determine the Thirty Year Constant Maturity for any applicable Dividend Period as provided above in this paragraph, the Thirty Year Constant Maturity Rate for such Dividend Period shall be the arithmetic average of the per annum average yields to maturity based upon the closing bids during such Calendar Period for each of the issues of actively traded marketable U.S. Treasury fixed interest rate securities (other than Special Securities) with a final maturity date not less than twenty-eight nor more than thirty years from the date of each such quotation, as chosen and quoted daily for each business day in New York City (or less frequently if daily quotations are not generally available) to the Corporation by at least three recognized dealers in U.S. Government securities selected by the Corporation.
(e) The Treasury Bill Rate, the Ten Year Constant Maturity Rate and the Thirty Year Constant Maturity Rate shall each be rounded to the nearest five hundredths of a percent.
(f) The Applicable Rate with respect to each Dividend Period beginning on or after July 1, 2003 shall be calculated as promptly as practicable by the Corporation
B-9
according to the appropriate method described above. The Corporation shall cause notice of each Applicable Rate to be sent to the holders of this Series.
(g) For purposes of this Section,
(i) “Calendar Period” means a period of fourteen calendar days;
(ii) “Federal Reserve Board” means the Board of Governors of the Federal Reserve System;
(iii) “Special Securities” means securities which can, at the option of the holder, be surrendered at face value in payment of any Federal estate tax or which provide tax benefits to the holder and are priced to reflect such tax benefits or which were originally issued at a deep or substantial discount;
(iv) “Ten Year Average Yield” means the average yield to maturity for actively traded marketable U.S. Treasury fixed interest rate securities (adjusted to constant maturities of ten years); and
(v) “Thirty Year Average Yield” means the average yield to maturity for actively traded marketable U.S. Treasury fixed interest rate securities (adjusted to constant maturities of thirty years).
(h) If, prior to November 21, 1999, one or more amendments to the Internal Revenue Code of 1986, as amended (the “Code”), are enacted that reduce the percentage of the dividends-received deduction (currently 70%) as specified in section 243(a)(1) of the Code or any successor provision (the “Dividends-Received Percentage”), the amount of each dividend payable (if declared) per share of this Series for dividend payments made on or after the effective date of such change in the Code shall be adjusted by multiplying the amount of the dividend payable described above (before adjustment) by the following fraction (the “DRD Formula”), and rounding the result to the nearest cent (with one-half cent rounded up):
1- [.35(1-.70)]
For the purposes of the DRD Formula, “DRP” means the Dividends-Received Percentage (expressed as a decimal) applicable to the dividend in question; provided, however, that if the Dividends-Received Percentage applicable to the dividend in question shall be less than 50%, then the DRP shall equal 0.50. Notwithstanding the foregoing provisions, if, with respect to any such amendment, the Corporation receives either an unqualified opinion of nationally recognized independent tax counsel selected by the Corporation or a private letter ruling or similar form of authorization from the Internal Revenue Service (“IRS”) to the effect that such amendment does not apply to a dividend payable on this Series, then such amendment shall not result in the adjustment provided for pursuant to the DRD Formula with respect to such dividend. Such opinion shall be based upon the legislation amending or establishing the DRP or upon a published pronouncement of the IRS addressing such legislation.
B-10
If any such amendment to the Code is enacted after the dividend payable on a Dividend Payment Date has been declared, the amount of the dividend payable on such Dividend Payment Date shall not be increased; instead, additional dividends (the “Post Declaration Date Dividends”) equal to the excess, if any, of (x) the product of the dividend paid by the Corporation on such Dividend Payment Date and the DRD Formula (where the DRP used in the DRD Formula would be equal to the greater of the Dividends-Received Percentage and 0.50) applicable to the dividend in question over (y) the dividend paid by the Corporation on such Dividend Payment Date, shall be payable (if declared) to holders of shares of this Series on the record date applicable to the next succeeding Dividend Payment Date or, if the shares of this Series are called for redemption prior to such record date, to holders of shares of this Series on the applicable redemption date, as the case may be, in addition to any other amounts payable on such date. Notwithstanding the foregoing provisions, if, with respect to any such amendment, the Corporation receives either an unqualified opinion of nationally recognized independent tax counsel selected by the Corporation or a private letter ruling or similar form of authorization from the IRS to the effect that such amendment does not apply to a dividend so payable on this Series, then such amendment shall not result in the payment of Post Declaration Date Dividends. The opinion referenced in the previous sentence shall be based upon the legislation amending or establishing the DRP or upon a published pronouncement of the IRS addressing such legislation.
If any such amendment to the Code is enacted and the reduction in the Dividends-Received Percentage retroactively applies to a Dividend Payment Date as to which the Corporation previously paid dividends on this Series (each, an “Affected Dividend Payment Date”), the Corporation shall pay (if declared) additional dividends (the “Retroactive Dividends”) to holders of shares of this Series on the record date applicable to the next succeeding Dividend Payment Date (or, if such amendment is enacted after the dividend payable on such Dividend Payment Date has been declared, to holders of shares of this Series on the record date following the date of enactment) or, if the shares of this Series are called for redemption prior to such record date, to holders of shares of this Series on the applicable redemption date, as the case may be, in an amount equal to the excess of (x) the product of the dividend paid by the Corporation on each Affected Dividend Payment Date and the DRD Formula (where the DRP used in the DRD Formula would be equal to the greater of the Dividends-Received Percentage and 0.50) applied to each Affected Dividend Payment Date over (y) the sum of the dividends paid by the Corporation on each Affected Dividend Payment Date. The Corporation shall only make one payment of Retroactive Dividends for any such amendment. Notwithstanding the foregoing provisions, if, with respect to any such amendment, the Corporation receives either an unqualified opinion of nationally recognized independent tax counsel selected by the Corporation or a private letter ruling or similar form of authorization from the IRS to the effect that such amendment does not apply to a dividend so payable on this Series, then such amendment shall not result in the payment of Retroactive Dividends. The opinion referenced in the previous sentence shall be based upon the legislation amending or establishing the DRP or upon a published pronouncement of the IRS addressing such legislation.
Notwithstanding the foregoing, no adjustment in the dividends payable by the Corporation shall be made, and no Post Declaration Date Dividends or Retroactive Dividends shall be payable by the Corporation, in respect of the enactment of any amendment to the Code at any time on or after November 21, 1999 that reduces the Dividends-Received Percentage.
B-11
In the event that the amount of dividends payable per share of the shares of this Series is adjusted pursuant to the DRD Formula and/or Post Declaration Date Dividends or Retroactive Dividends are to be paid, the Corporation shall give notice of each such adjustment and, if applicable, any Post Declaration Date Dividends and Retroactive Dividends to the holders of shares of this Series.
4. Redemption. (a) Except as provided in paragraph (b) below, the shares of this Series are not redeemable prior to June 30, 2003. The Corporation, at its option, may redeem shares of this Series, as a whole or in part, at any time or from time to time, on or after June 30, 2003 at a redemption price of $50 per share plus accrued and unpaid dividends thereon (whether or not declared and including any increase in dividends pursuant to paragraph 3(h) above) from the immediately preceding Dividend Payment Date to the date fixed for redemption (but without any accumulation for unpaid dividends for prior Dividend Periods on the shares of this Series).
(b) If the Dividends-Received Percentage is equal to or less than 50% and, as a result, the amount of dividends payable on this Series on any Dividend Payment Date shall be or is adjusted upwards as described in paragraph 3(h) above, the Company, at its option, may redeem all, but not less than all, of the outstanding shares of this Series, provided that within sixty days of the date on which an amendment to the Code is enacted which reduces the Dividends-Received Percentage to 50% or less, the Company sends notice to holders of shares of this Series of such redemption in accordance with paragraph (d) below. Any redemption of this Series in accordance with this paragraph shall be on notice as aforesaid at a redemption price equal to $51 per share, plus accrued and unpaid dividends (whether or not declared and including any increase in dividends pursuant to paragraph 3(h) above) from the immediately preceding Dividend Payment Date to the date fixed for redemption (but without any accumulation for unpaid dividends for prior Dividend Periods on the shares of this Series).
(c) In the event that fewer than all the outstanding shares of this Series are to be redeemed, the number of shares to be redeemed shall be determined by the Board of Directors and the shares to be redeemed shall be determined by lot or pro rata as may be determined by the Board of Directors or by any other method as may be determined by the Board of Directors in its sole discretion to be equitable, provided that such method satisfies any applicable requirements of any securities exchange on which this Series is listed.
(d) In the event the Corporation shall redeem shares of this Series, notice of such redemption shall be given by first class mail, postage prepaid, mailed not less than 30 or more than 60 days prior to the redemption date, to each holder of record of the shares to be redeemed, at such holder’s address as the same appears on the stock register of the Corporation. Each such notice shall state: (i) the redemption date; (ii) the number of shares of this Series to be redeemed and, if fewer than all the shares held by such holder are to be redeemed, the number of such shares to be redeemed from such holder; (iii) the redemption price; (iv) the place or places where certificates for such shares are to be surrendered for payment of the redemption price; and (v) that dividends on the shares to be redeemed shall cease to accrue on the redemption date.
B-12
(e) Notice having been mailed as aforesaid, from and after the redemption date (unless default shall be made by the Corporation in providing money for the payment of the redemption price) dividends on the shares of this Series so called for redemption shall cease to accrue, and said shares shall no longer be deemed to be outstanding, and all rights of the holders thereof as stockholders of the Corporation (except the right to receive from the Corporation the redemption price) shall cease. Upon surrender in accordance with said notice of the certificates for any shares so redeemed (properly endorsed or assigned for transfer, if the Board of Directors shall so require and the notice shall so state), such shares shall be redeemed by the Corporation at the redemption price aforesaid. In case fewer than all the shares represented by any such certificate are redeemed, a new certificate shall be issued representing the unredeemed shares without cost to the holder thereof.
(f) Any shares of this Series which shall at any time have been redeemed shall, after such redemption, have the status of authorized but unissued shares of Preferred Stock, without designation as to series until such shares are once more designated as part of a particular series by the Board of Directors.
(g) Notwithstanding the foregoing provisions of this Section 4, if full dividends on all outstanding shares of this Series are in arrears, no shares of this Series shall be redeemed unless all outstanding shares of this Series are simultaneously redeemed, and the Corporation shall not purchase or otherwise acquire any shares of this Series; provided, however, that the foregoing shall not prevent the purchase or acquisition of shares of this Series pursuant to a purchase or exchange offer made on the same terms to holders of all outstanding shares of this Series.
5. Conversion. The holders of shares of this Series shall not have any rights to convert such shares into shares of any other class or series of capital stock of the Corporation.
6. Liquidation Rights. (a) Upon the voluntary or involuntary dissolution, liquidation or winding up of the Corporation, the holders of the shares of this Series shall be entitled to receive and to be paid out of the assets of the Corporation available for distribution to its stockholders, before any payment or distribution shall be made on the Common Stock or on any other class of stock ranking junior to this Series upon liquidation, the amount of $50 per share, plus accrued and unpaid dividends (whether or not declared and including any increase in dividends pursuant to paragraph 3(h) above) from the immediately preceding Dividend Payment Date or the date of original issuance of this Series, as the case may be, to the date of the liquidating distribution (but without any accumulation of unpaid dividends for prior Dividend Periods) .
(b) After the payment to the holders of the shares of this Series of the full preferential amounts provided for in this Section 6, the holders of this Series as such shall have no right or claim to any of the remaining assets of the Corporation.
(c) If, upon any voluntary or involuntary dissolution, liquidation, or winding up of the Corporation, the amounts payable with respect to the shares of this Series and
B-13
any other shares of stock of the Corporation ranking as to any such distribution on a parity with the shares of this Series are not paid in full, the holders of the shares of this Series and of such other shares shall share ratably in any such distribution of assets of the Corporation in proportion to the full respective distributions to which they are entitled.
(d) Neither the sale of all or substantially all the property or business of the Corporation, nor the merger or consolidation of the Corporation into or with any other corporation or the merger or consolidation of any other corporation into or with the Corporation, shall be deemed to be a dissolution, liquidation or winding up, voluntary or involuntary, for the purposes of this Section 6.
7. Ranking. For purposes of this resolution, any stock of any class or classes of the Corporation shall be deemed to rank:
(a) prior to the shares of this Series, either as to dividends or upon liquidation, if the holders of such class or classes shall be entitled to the receipt of dividends or of amounts distributable upon dissolution, liquidation or winding up of the Corporation, as the case may be, in preference or priority to the holders of shares of this Series;
(b) on a parity with shares of this Series, either as to dividends or upon liquidation, whether or not the dividend rates, dividend payment dates or redemption or liquidation prices per share or sinking fund provisions, if any, be different from those of this Series (and whether or not such dividends shall accumulate), if the holders of such stock shall be entitled to the receipt of dividends or of amounts distributable upon dissolution, liquidation or winding up of the Corporation, as the case may be, without preference or priority, one over the other, as between the holders of such stock and the holders of shares of this Series; and
(c) junior to shares of this Series, either as to dividends or upon liquidation, if such class shall be Common Stock or if the holders of shares of this Series shall be entitled to receipt of dividends or of amounts distributable upon dissolution, liquidation or winding up of the Corporation, as the case may be, in preference or priority to the holders of shares of such class or classes.
8. Voting Rights. The shares of this Series shall have the voting rights set forth in the resolutions of the Board of Directors of the Corporation adopted on January 20, 1998.”
B-14
Exhibit 3.2

BY-LAWS
OF
JPMORGAN CHASE & CO.
As amended by the Board of Directors on March 16, 2004
Effective July 1, 2004
Effective July 20, 2004, name changed to JPMorgan Chase & Co.
Office of the Secretary
270 Park Avenue, 35th floor
New York, New York 10017
CONTENTS
SUBJECT
Article
| I | Meetings of Stockholders | |||||
| Section 1.01 | Annual Meeting | |||||
| Section 1.02 | Special Meetings | |||||
| Section 1.03 | Notice of Meetings | |||||
| Section 1.04 | Quorum | |||||
| Section 1.05 | Organization | |||||
| Section 1.06 | Voting | |||||
| Section 1.07 | List of Stockholders | |||||
| Section 1.08 | Inspectors of Election | |||||
| Section 1.09 | Notice of Stockholder Business and Director | |||||
| Nominations. | ||||||
| II | Board of Directors | |||||
| Section 2.01 | Number | |||||
| Section 2.02 | Vacancies | |||||
| Section 2.03 | Annual Meeting | |||||
| Section 2.04 | Regular Meetings | |||||
| Section 2.05 | Special Meetings | |||||
| Section 2.06 | Quorum | |||||
| Section 2.07 | Rules and Regulations | |||||
| Section 2.08 | Compensation | |||||
| Section 2.09 | CEO Position and Succession; Board Composition | |||||
| III | Committees | |||||
| Section 3.01 | Executive Committee | |||||
| Section 3.02 | Audit Committee | |||||
| Section 3.03 | Other Committees | |||||
| IV | Officers and Agents | |||||
| Section 4.01 | Officers | |||||
| Section 4.02 | Clerks and Agents | |||||
| Section 4.03 | Term of Office | |||||
| Section 4.04 | Chairman of the Board | |||||
| Section 4.05 | Chief Executive Officer | |||||
| Section 4.06 | President | |||||
| Section 4.07 | Vice Chairman of the Board | |||||
| Section 4.08 | Chief Financial Officer | |||||
| Section 4.09 | Controller | |||||
| Section 4.10 | Secretary | |||||
| Section 4.11 | Assistant Corporate Secretary | |||||
| Section 4.12 | General Auditor | |||||
| Section 4.13 | Powers and Duties of Other Officers | |||||
| V | Proxies re Stock or Other Securities of Other Corporations | |||||
| VI | Shares and Their Transfer | |||||
| Section 6.01 | Certificates for Stock | |||||
| Section 6.02 | Transfers of Stock | |||||
| Section 6.03 | Regulations | |||||
| Section 6.04 | Lost, Stolen, Destroyed and Mutilated Certificates | |||||
| Section 6.05 | Fixing Date for Determination of Stockholders of Record | |||||
| VII | Corporate Seal | |||||
| VIII | Fiscal Year | |||||
| IX | Indemnification | |||||
| Section 9.01 | Right to Indemnification | |||||
| Section 9.02 | Contracts and Funding | |||||
| Section 9.03 | Employee Benefit Plans | |||||
| Section 9.04 | Indemnification Not Exclusive Right | |||||
| Section 9.05 | Advancement of Expenses; Procedures | |||||
| X | By-laws | |||||
| Section 10.01 | Inspection | |||||
| Section 10.02 | Amendments | |||||
| Section 10.03 | Construction | |||||
BY-LAWS
OF
JPMORGAN CHASE & CO.
ARTICLE I
Meetings of Stockholders
Section 1.01. Annual Meeting. The annual meeting of the stockholders of JPMorgan Chase & Co. (the “Corporation”) shall be held on the third Tuesday in May in each year (or, if that day shall be a legal holiday then on the next preceding business day) or at such other date and at such time and place within or without the State of Delaware, as may be specified in the notice thereof, as shall be fixed by the Board of Directors (the “Board”), for the purpose of electing directors and for the transaction of such other business as may properly be brought before such meeting. If any annual meeting shall not be held on the day designated or the directors shall not have been elected thereat or at any adjournment thereof, thereafter the Board shall cause a special meeting of the stockholders to be held as soon as practicable for the election of directors. At such special meeting the stockholders may elect directors and transact other business with the same force and effect as at an annual meeting of the stockholders duly called and held.
Section 1.02. Special Meetings. A special meeting of the stockholders may be called at any time by the Board, the Chairman of the Board (herein called the Chairman), the Chief Executive Officer, the President or a Vice Chairman of the Board or otherwise as provided by the General Corporation Law of the State of Delaware (herein called Delaware General Corporation Law). Such meetings shall be held at such places, within or without the State of Delaware, as may from time to time be designated by the Board or in the respective notices or waivers of notice thereof.
Section 1.03. Notice of Meetings. Except as may otherwise expressly be required by law, notice of the place, date and hour of holding each annual and special meeting of the stockholders and the purpose or purposes thereof shall be delivered personally or mailed in a postage prepaid envelope, not less than ten (10) nor more than sixty (60) days before the date of such meeting, to each person who appears on the stock books and records of the Corporation as a stockholder entitled to vote at such meeting, and, if mailed, it shall be directed to such stockholder at his address as it appears on such records unless he shall have filed with the Secretary of the Corporation a written request that notice intended for him be mailed to some other address, in which case it shall be mailed to the address designated in such request. Notice of any meeting of stockholders shall not be required to be given to any stockholder who shall attend such meeting in person or by proxy and shall not, at the beginning of such meeting, object to the transaction of any business because the meeting has not been lawfully called or convened, or who shall, either before or after the meeting, submit a signed waiver of notice, in person or by proxy. Unless the Board shall fix a new record date for an adjourned meeting, notice of such adjourned meeting need not be given if the time and place to which the meeting shall be adjourned were announced at the meeting at which the adjournment was taken, provided that the adjournment is not for more than thirty (30) days.
-1-
Section 1.04. Quorum. At each meeting of the stockholders, stockholders holding of record shares of common stock constituting a majority of the voting power of stock of the Corporation having general voting power (shares having such general voting power being hereinafter sometimes referred to as a “voting interest of the stockholders”) shall be present in person or by proxy to constitute a quorum for the transaction of business. In the absence of a quorum at any such meeting or any adjournment or adjournments thereof, a majority in voting interest of the stockholders present in person or by proxy and entitled to vote thereat, or in the absence therefrom of all the stockholders, any officer entitled to preside at, or to act as secretary of, such meeting may adjourn such meeting from time to time. At any such adjourned meeting at which a quorum may be present, any business may be transacted which might have been transacted at the meeting as originally called. The absence from any meeting of stockholders holding the number of shares of stock of the Corporation required by the laws of the State of Delaware or by the Certificate of Incorporation of the Corporation or by these By-laws for action upon any given matter shall not prevent action at such meeting upon any other matter or matters which may properly come before the meeting, if there shall be present thereat in person or by proxy stockholders holding the number of shares of stock of the Corporation required in respect of such other matter or matters.
Section 1.05. Organization. At each meeting of the stockholders, the Chairman, or, if he shall be absent therefrom, the Chief Executive Officer, the President, or a Vice Chairman of the Board, or, if they also shall be absent therefrom, another officer of the Corporation chosen as chairman of such meeting by a majority in voting interest of the stockholders present in person or by proxy and entitled to vote thereat, or, if all the officers of the Corporation shall be absent therefrom, a stockholder holding of record shares of stock of the Corporation so chosen, shall act as chairman of the meeting and preside thereat; and the Secretary, or, if he shall be absent from such meeting or shall be required pursuant to the provisions of this Section to act as chairman of such meeting, the person (who shall be an Assistant Corporate Secretary, if an Assistant Corporate Secretary shall be present thereat) whom the chairman of such meeting shall appoint shall act as secretary of such meeting and keep the minutes thereof.
Section 1.06. Voting. Except as otherwise provided in the Certificate of Incorporation, each stockholder shall, at each meeting of the stockholders, be entitled to one vote in person or by proxy for each share of stock of the Corporation held by him and registered in his name on the stock books and records of the Corporation:
| (a) | on the date fixed pursuant to the provisions of Article VI of these By-laws as the record date for the determination of stockholders who shall be entitled to notice of and to vote at such meeting, or |
| (b) | if no such record date shall have been so fixed, then at the close of business on the day next preceding the day on which notice of the meeting shall be given. |
Persons holding in a fiduciary capacity stock of the Corporation shall be entitled to vote such stock so held, and persons whose stock is pledged shall be entitled to vote such stock, unless in the transfer by the pledgor on the books of the Corporation he shall have expressly empowered the pledgee to vote thereon, in which case only the pledgee, or his proxy, may represent such stock and vote thereon. If shares of stock of the Corporation shall stand of record in the names of two or more persons, whether fiduciaries, members of a partnership, joint tenants, tenants in common, tenants by the entirety or otherwise, or if two or more persons shall have the same fiduciary
-2-
relationship respecting the same shares of stock of the Corporation, unless the Secretary shall have been given written notice to the contrary and have been furnished with a copy of the instrument or order appointing them or creating the relationship wherein it is so provided, their acts with respect to voting shall have the following effect:
| (a) | if only one shall vote, his act shall bind all; | |||
| (b) | if more than one shall vote, the act of the majority so voting shall bind all; and | |||
| (c) | if more than one shall vote, but the vote shall be evenly split on any particular matter, then, except as otherwise required by the Delaware General Corporation Law, each faction may vote the shares in question proportionally. | |||
If the instrument so filed shall show that any such tenancy is held in unequal interests, the majority or even-split for the purpose of the next foregoing sentence shall be a majority or even-split in interest. Any vote on stock of the Corporation may be given at any meeting of the stockholders by the stockholder entitled thereto in person or by his proxy appointed by an instrument in writing subscribed by such stockholder or by his attorney thereunto authorized and delivered to the Secretary of the Corporation or to the secretary of the meeting, or by the transmitting or authorizing the transmission of a telegram, cablegram, or other means of electronic transmission to the person who will be the holder of the proxy to receive such transmission, provided that any such telegram, cablegram, or other means of electronic transmission must either set forth or be submitted with information from which it can be determined that the telegram, cablegram or other electronic transmission was authorized by the stockholder. Any copy, facsimile telecommunication or other reliable reproduction of such writing or transmission may be substituted or used in lieu of the original writing or transmission for any and all purposes for which the original writing or transmission could be used, provided that any such reproduction is a complete reproduction of the entire original writing or transmission. No proxy shall be voted or acted upon after three (3) years from its date, unless said proxy shall provide for a longer period. At all meetings of the stockholders all matters, except those otherwise specified in these By-laws, and except also those the manner of deciding upon which is otherwise expressly regulated by law or by the Certificate of Incorporation of the Corporation, shall be decided by the vote of a majority in voting interest of the stockholders present in person or by proxy and entitled to vote thereat, a quorum being present. Except in the case of votes for the election of directors, unless demanded by a stockholder of the Corporation present in person or by proxy at any meeting of the stockholders and entitled to vote thereat or so directed by the chairman of the meeting, the vote thereat need not be by ballot. Upon a demand of any such stockholder for a vote by ballot on any question or at the direction of such chairman that a vote by ballot be taken on any question, such vote shall be taken. On a vote by ballot each ballot shall be signed by the stockholder voting, or by his proxy, if there be such proxy, and shall state the number of shares voted.
Section 1.07. List of Stockholders. It shall be the duty of the Secretary or other officer of the Corporation who shall have charge of its stock books and records, either directly or through another officer of the Corporation designated by him or through a transfer agent appointed by the Board, to prepare and make, at least ten (10) days before every meeting of the stockholders, a complete list of the stockholders entitled to vote thereat, arranged in alphabetical order, and showing the address of each stockholder and the number of shares registered in the name of each stockholder. Such list shall be open to the examination of any stockholder, for any purpose germane to the meeting, during ordinary business hours, for a period of at least ten (10) days prior
-3-
to said meeting, either at a place within the city where said meeting is to be held, which place shall be specified in the notice of said meeting, or, if not so specified, at the place where said meeting is to be held. The list shall also be produced and kept at the time and place of said meeting during the whole time thereof, and may be inspected by any stockholder who shall be present thereat. Upon the willful neglect or refusal of the directors to produce such list at any meeting for the election of directors, they shall be ineligible for election to any office at such meeting. The stock books and records shall be the only evidence as to who are the stockholders entitled to examine the stock books and records of the Corporation, or such list, or to vote in person or by proxy at any meeting of stockholders.
Section 1.08. Inspectors of Election. At each meeting of the stockholders, the chairman of such meeting may appoint two or more Inspectors of Election to act thereat. Each Inspector of Election so appointed shall first subscribe an oath or affirmation faithfully to execute the duties of an Inspector of Election at such meeting with strict impartiality and according to the best of his ability. Such Inspectors of Election, if any, shall take charge of the ballots at such meeting and after the balloting thereat on any question shall count the ballots cast thereon and shall make a report in writing to the secretary of such meeting of the results thereof. An Inspector of Election need not be a stockholder of the Corporation.
Section 1.09. Notice of Stockholder Business and Director Nominations.
(a) Business and Director Nominations to be Considered at Annual Meeting of Stockholders.
| (1) | Nominations of persons for election to the Board and the proposal of business to be considered by the stockholders may be made at an annual meeting of stockholders (i) pursuant to the Corporation’s notice of meeting, (ii) by or at the direction of the Board, or (iii) by any stockholder of the Corporation who was a stockholder of record at the time of giving of notice provided for in this By-law who is entitled to vote at the meeting and complies with the notice procedures set forth in this By-law. |
| (2) | For nominations or other business to be properly brought before an annual meeting by a stockholder pursuant to clause (iii) of paragraph (a)(1) of this By-law Section 1.09, (i) the stockholder must have given timely notice thereof in writing to the Secretary of the Corporation and (ii) such other business must otherwise be a proper matter for stockholder action. To be timely, a stockholder’s notice shall be delivered to the Secretary at the principal offices of the Corporation not later than the close of business on the 90th day nor earlier than the 120th day prior to the first anniversary of the preceding year’s annual meeting; provided, however, that in the event that the date of the annual meeting is more than thirty (30) days before or more than sixty (60) days after such anniversary date, notice by the stockholder to be timely must be so delivered not earlier than the 120th day prior to such annual meeting and not later than the close of business on the later of the 90th day prior to such annual meeting or the 10th day following the day on which public announcement of the date of such meeting is first made by the Corporation. In no event shall the public announcement of an adjournment of an annual meeting commence a new time period for the giving of a stockholder’s notice as described above. Such stockholder’s notice shall set forth (i) as to each person whom the stockholder proposes to nominate for election or re-election as a director all information relating to such person that is required to be disclosed in solicitations of proxies for election of directors in an election contest, or |
-4-
| is otherwise required, in each case pursuant to Regulation 14A under the Securities Exchange Act of 1934, as amended (the “Exchange Act”) and Rule 14a-11 thereunder (including such person’s written consent to being named in the proxy statement as a nominee and to serving as a director if elected); (ii) as to any other business that the stockholder proposes to bring before the meeting, a brief description of the business desired to be brought before the meeting, the reasons for conducting such business at the meeting and any material interest in such business of such stockholder and the beneficial owner, if any, on whose behalf the proposal is made; and (iii) as to the stockholder giving the notice and the beneficial owner, if any, on whose behalf the nomination or proposal is made (A) the name and address of such stockholder, as they appear on the Corporation’s books, and of such beneficial owner, (B) the class and number of shares of the Corporation which are owned beneficially and of record by such stockholder and any such beneficial owner, and (C) whether the proponent intends or is part of a group which intends to solicit proxies from other stockholders in support of such proposal or nomination. |
| (3) | Notwithstanding anything in the second sentence of paragraph (a)(2) of this By-law to the contrary, in the event that the number of directors to be elected to the Board of Directors of the Corporation is increased and there is no public announcement by the Corporation naming all of the nominees for director or specifying the size of the increased Board of Directors at least ninety (90) days prior to the first anniversary of the preceding year’s annual meeting, a stockholder’s notice required by this By-law shall also be considered timely, but only with respect to nominees for any new positions created by such increase, if it shall be delivered to the Secretary at the principal offices of the Corporation not later than the close of business on the 10th day following the day on which such public announcement is first made by the Corporation. |
(b) Business and Director Nominations to be Considered at Special Meetings of Stockholders.
| (1) | Only such business shall be conducted at a special meeting of stockholders as shall have been brought before the meeting pursuant to the Corporation’s notice of meeting. |
| (2) | Nominations of persons for election to the Board may be made at a special meeting of stockholders at which directors are to be elected pursuant to the Corporation’s notice of meeting (i) by or at the direction of the Board; or (ii) provided that the Board has determined that directors shall be elected at such meeting, by any stockholder of the Corporation who (A) is a stockholder of record at the time of giving of notice provided for in this By-law, (B) shall be entitled to vote at the meeting, and (C) complies with the notice procedures set forth in this By-law. In the event the Corporation calls a special meeting of stockholders for the purpose of electing one or more persons to the Board, any such stockholder may nominate a person or persons (as the case may be) for election to such position(s) as specified in the Corporation’s notice of meeting, if the stockholder’s notice required by paragraph (a)(2) of this By-law shall be delivered to the Secretary at the principal offices of the Corporation not earlier than the 90th day prior to such special meeting, and not later than the close of business on the later of the 60th day and prior to such special meeting or the 10th day following the day on which public announcement is first made of the date of the |
-5-
| special meeting and the nominees proposed by the Board for election at such meeting. In no event shall the public announcement of an adjournment of a special meeting commence a new time period for the giving of a stockholder’s notice as described above. |
(c) General.
| (1) | Only such persons who are nominated in accordance with the procedures set forth in this By-law (or who are elected or appointed to the Board pursuant to Article II, Section 2.02 of these By-laws) shall be eligible to serve as directors of the Corporation and only such business shall be conducted at a meeting of stockholders as shall have been brought before the meeting in accordance with the procedures set forth in this By-law. |
| (2) | Except as otherwise provided by law, the Restated Certificate of Incorporation or these By-laws, the chairman of the meeting shall have the power and duty to determine whether a nomination or any business proposed to be brought before the meeting was made or proposed, as the case may be, in accordance with the procedures set forth in this By-law and if any nomination or business is not in compliance with this By-law to declare that such defective proposal or nomination shall be disregarded. |
| (3) | For purposes of this By-law, “public announcement” shall mean disclosure in a press release reported by the Dow Jones News Service, Associated Press or comparable national news service or in a document publicly filed by the Corporation with the Securities and Exchange Commission pursuant to Section 13, 14 or 15(d) of the Exchange Act. |
| (4) | Notwithstanding the foregoing provisions of this By-law, a stockholder shall also comply with all applicable requirements of the Exchange Act and the rules and regulations thereunder with respect to the matters set forth in this By-law. Nothing in this By-law shall be deemed to affect any rights (i) of stockholders to request inclusion of proposals in the Corporation’s proxy statement pursuant to Rule 14a-8 under the Exchange Act or (ii) of the holders of any series of preferred stock to elect directors under specified circumstances. |
ARTICLE II
Board of Directors
Section 2.01. Number. The business and affairs of the Corporation shall be managed by or under the direction of a Board of Directors, of such number as may be fixed from time to time by resolution adopted by the Board or by the stockholders, selected, organized and continued in accordance with the provisions of the laws of the State of Delaware. Each director hereafter elected shall hold office until the annual meeting of stockholders and until his successor is elected and has qualified, or until his death or until he shall resign or shall have been removed.
Section 2.02. Vacancies. In case of any increase in the number of directors, the additional director or directors, and in case of any vacancy in the Board due to death, resignation,
-6-
removal, disqualification or any other cause, the successors to fill the vacancies shall be elected by a majority of the directors then in office, for a term expiring at the next annual meeting of stockholders.
Section 2.03. Annual Meeting. An annual meeting of the directors shall be held each year, without notice, immediately following the annual meeting of stockholders. The time and place of such meeting shall be designated by the Board. At such meeting, the directors shall, after qualifying, elect from their own number a Chairman of the Board, a Chief Executive Officer, a President and one or more Vice Chairmen of the Board, and shall elect or appoint such other officers authorized by these By-laws as they may deem desirable, and appoint the Committees specified in Article III hereof. The directors may also elect to serve at the pleasure of the Board, one or more Honorary Directors, not members of the Board. Honorary Directors of the Board shall be paid such compensation or such fees for attendance at meetings of the Board, and meetings of other committees of the Board, as the Board shall determine from time to time.
Section 2.04. Regular Meetings. The Board shall hold a regular meeting without notice at the principal office of the Corporation on the third Tuesday in each month, with such exceptions as shall be determined by the Board, at such time as shall be determined by the Board, unless another time or place, within or without the State of Delaware, shall be fixed by resolution of the Board. Should the day appointed for a regular meeting fall on a legal holiday, the meeting shall be held at the same time on the preceding day or on such other day as the Board may order.
Section 2.05. Special Meetings. Special meetings of the Board shall be held whenever called by the Chairman, the Chief Executive Officer, the President, a Vice Chairman of the Board, the Secretary or a majority of the directors at the time in office. A notice shall be given as hereinafter in this Section provided of each such special meeting, in which shall be stated the time and place of such meeting, but, except as otherwise expressly provided by law or by these By-laws, the purposes thereof need not be stated in such notice. Except as otherwise provided by law, notice of each such meeting shall be mailed to each director, addressed to him at his residence or usual place of business, at least two (2) days before the day on which such meeting is to be held, or shall be sent addressed to him at such place by telegraph, cable, wireless or other form of recorded communication or be delivered personally or by telephone not later than noon of the calendar day before the day on which such meeting is to be held. At any regular or special meeting of the Board, or any committee thereof, one or more Board or committee members may participate in such meeting by means of a conference telephone or similar communications equipment allowing all persons participating in the meeting to hear each other at the same time. This type of participation shall constitute presence in person at the meeting. Notice of any meeting of the Board shall not, however, be required to be given to any director who submits a signed waiver of notice whether before or after the meeting, or if he shall be present at such meeting; and any meeting of the Board shall be a legal meeting without any notice thereof having been given if all the directors of the Corporation then in office shall be present thereat.
Section 2.06. Quorum. One-third of the members of the entire Board, or the next highest integer in the event of a fraction, shall constitute a quorum, but if less than a quorum be present, a majority of those present may adjourn any meeting from time to time and the meeting may be held as adjourned without further notice.
-7-
Section 2.07. Rules and Regulations. The Board may adopt such rules and regulations for the conduct of its meetings and the management of the affairs of the Corporation as it may deem proper, not inconsistent with the laws of the State of Delaware or these By-laws.
Section 2.08. Compensation. Directors shall be entitled to receive from the Corporation such amount per annum and in addition, or in lieu thereof, such fees for attendance at meetings of the Board or of any committee, or both, as the Board from time to time shall determine. The Board may also likewise provide that the Corporation shall reimburse each such director or member of such committee for any expenses paid by him on account of his attendance at any such meeting. Nothing in this Section contained shall be construed to preclude any director from serving the Corporation in any other capacity and receiving compensation therefor.
Section 2.09. CEO Position and Succession; Board Composition.
(a) The Board of Directors of the Corporation has resolved that, effective as of the Effective Time (as defined in the Agreement and Plan of Merger, dated as of January 14, 2004, by and between the Corporation and Bank One Corporation (“Bank One”), as the same may be amended from time to time (the “Merger Agreement”)), Mr. William B. Harrison, Jr. shall continue to serve as Chairman of the Board and Chief Executive Officer of the Corporation and Mr. James Dimon shall become the President and Chief Operating Officer of the Corporation. The Board of Directors of the Corporation has further resolved that Mr. Dimon shall be the successor to Mr. Harrison as the Chief Executive Officer of the Corporation, with such succession to become effective on the second anniversary of the Closing Date (as defined in the Merger Agreement) or any such earlier date as of which Mr. Harrison ceases for any reason to serve in the position of Chief Executive Officer of the Corporation (the date of such succession, the “Succession Date”), and that Mr. Harrison shall continue to serve as Chairman of the Board following the Succession Date.
(b) Effective as of the Effective Time, the Board of Directors of the Corporation shall be comprised of eight Continuing Bank One Directors, including Mr. Dimon, and eight Continuing JPMorgan Chase Directors, including Mr. Harrison. From and after the Effective Time through the Succession Date: (i) the number of directors that comprises the full Board of Directors of the Corporation shall be sixteen; and (ii) all vacancies on the Board of Directors created by the cessation of service of a director shall be filled by a nominee proposed by the Governance Committee of the Board of Directors, which shall be co-chaired by one Continuing Bank One Director and one Continuing JPMorgan Chase Director and comprised of an equal number of Continuing Bank One Directors and Continuing JPMorgan Chase Directors (any deadlocks on the Governance Committee shall be resolved in good faith by the non-management members of the Board of Directors in a manner intended to preserve the principles of representation reflected in this By-law.). For purposes of this Section 2.09, the terms “Continuing JPMorgan Chase Directors” and “Continuing Bank One Directors” shall mean, respectively, the directors of the Corporation and Bank One who were selected to be directors of the Corporation by the Corporation or Bank One, as the case may be, as of the Effective Time pursuant to Section 5.10 of the Merger Agreement.
(c) (i) The removal of Mr. Dimon from, or the failure to appoint or re-elect Mr. Dimon to, any of the positions specifically provided for in this Section 2.09 and in the employment agreement between the Corporation and Mr. Dimon (the “Employment Agreement”), and any amendment to or termination of the Employment Agreement, prior to the Succession Date, (ii) any
-8-
determination not to appoint, or any failure to appoint, Mr. Dimon as Chief Executive Officer of the Corporation on the Succession Date, (iii) the removal of Mr. Harrison from, or the failure to appoint or re-elect Mr. Harrison to, the position of Chairman of the Board and Chief Executive Officer of the Corporation prior to the Succession Date or (iv) any determination not to nominate Mr. Harrison or Mr. Dimon as a Director of the Corporation, prior to the Succession Date, shall each require the affirmative vote of at least 75% of the full Board of Directors.
(d) The provisions of this Section 2.09 may be modified, amended or repealed, and any By-law provision inconsistent with the provisions of this Section 2.09 may be adopted, only by an affirmative vote of at least 75% of the full Board of Directors. In the event of any inconsistency between any provision of this Section 2.09 and any other provision of these By-laws or the Corporation’s other constituent documents, the provisions of this Section 2.09 shall control.
ARTICLE III
Committees
Section 3.01. Executive Committee. The Board shall appoint an Executive Committee which, when the Board is not in session, shall have and may exercise all the powers of the Board that lawfully may be delegated, including without limitation the power and authority to declare dividends. The Executive Committee shall consist of such number of directors as the Board shall from time to time determine, but not less than five and one of whom shall be designated by the Board as Chairman thereof, as follows: (a) the Chairman of the Board, the Chief Executive Officer, the President, the Vice Chairmen of the Board; and (b) such other directors, none of whom shall be an officer of the Corporation, as shall be appointed to serve at the pleasure of the Board. The Board, by resolution adopted by a majority of the entire Board, may (a) designate one or more directors as alternate members of the Executive Committee or (b) specify that the member or members of the Executive Committee present and not disqualified from voting at a meeting of the Executive Committee, whether or not he or they constitute a quorum, may unanimously appoint another member of the Board to act at such meeting in place of any absent or disqualified member. The attendance of one-third of the members of the Committee or their substitutes, or the next highest integer in the event of a fraction, at any meeting shall constitute a quorum, and the act of a majority of those present at a meeting thereof at which a quorum is present shall be the act of the Committee. All acts done and powers conferred by the Committee from time to time shall be deemed to be, and may be certified as being done or conferred under authority of the Board. The Committee shall fix its own rules and procedures, and the minutes of the meetings of the Committee shall be submitted at the next regular meeting of the Board at which a quorum is present, or if impracticable, at the next such subsequent meeting. The Committee shall hold meetings “On Call” and such meetings may be called by the Chairman of the Executive Committee, the Chairman of the Board, the Chief Executive Officer, the President, a Vice Chairman of the Board, or the Secretary. Notice of each such meeting of the Committee shall be given by mail, telegraph, cable, wireless or other form of recorded communication or be delivered personally or by telephone to each member of the Committee not later than the day before the day on which such meeting is to be held. Notice of any such meeting need not be given to any member of the Committee who submits a signed waiver of notice whether before or after the meeting, or if he shall be present at such meeting; and any meeting of the Committee shall be a legal meeting without any notice thereof having been given, if all the members of the Committee shall be present thereat. In the case of any meeting, in the absence of the Chairman of the Executive Committee, such member
-9-
as shall be designated by the Chairman of the Executive Committee or the Executive Committee shall act as Chairman of the meeting.
Section 3.02. Audit Committee. The Board shall appoint an Audit Committee composed of not less than three of its members, none of whom shall be an officer of the Corporation, to hold office at its pleasure and one of whom shall be designated by the Board as Chairman thereof. The Committee shall make such examination into the affairs of the Corporation and make such reports in writing thereof as may be directed by the Board. The attendance of one-third of the members of the Committee, or the next highest integer in the event of a fraction, at any meeting shall constitute a quorum, and the act of a majority of those present at a meeting thereof at which a quorum is present shall be the act of the Committee.
Section 3.03. Other Committees. The Corporation elects to be governed by subsection (2) of section 141(c) of the Delaware General Corporation Law. The Board may appoint, from time to time, such other committees composed of not less than one of its members for such purposes and with such duties and powers as the Board may determine. The attendance of one-third of the members of such other committees, or the next highest integer in the event of a fraction, at any meeting shall constitute a quorum, and the act of a majority of those present at a meeting thereof at which a quorum is present shall be the act of such other committees. In the absence or disqualification of a member of a committee, the member or members present at any meeting and not disqualified from voting, whether or not such member or members constitute a quorum, may unanimously appoint another member of the Board of Directors to act at the meeting in the place of any such absent or disqualified member. Any committee may act by delegating its authority to one or more subcommittees.
ARTICLE IV
Officers and Agents
Section 4.01. Officers. The officers of the Corporation shall be (a) a Chairman of the Board, a Chief Executive Officer, a President and one or more Vice Chairmen of the Board, each of whom must be a director and shall be elected by the Board; (b) a Chief Financial Officer, a Controller, a Secretary, and a General Auditor, each of whom shall be elected by the Board; and (c) such other officers as may from time to time be elected by the Board or under its authority, or appointed by the Chairman, the Chief Executive Officer, the President or a Vice Chairman of the Board.
Section 4.02. Clerks and Agents. The Board may elect and dismiss, or the Chairman, the Chief Executive Officer, the President or a Vice Chairman of the Board may appoint and dismiss and delegate to any other officers authority to appoint and dismiss, such clerks, agents and employees as may be deemed advisable for the prompt and orderly transaction of the Corporation’s business, and may prescribe, or authorize the appointing officers to prescribe, their respective duties, subject to the provisions of these By-laws.
Section 4.03. Term of Office. The officers designated in Section 4.01(a) shall be elected by the Board at its annual meeting, and any one person may be elected to hold more than one such office. The officers designated in Section 4.01(b) may be elected at the annual or any other meeting of the Board. The officers designated in Section 4.01(c) may be elected at the annual or any other meeting of the Board or appointed at any time by the designated proper officers. Any
-10-
vacancy occurring in any office designated in Section 4.01(a) may be filled at any regular or special meeting of the Board. The officers elected pursuant to Section 4.01(a) shall each hold office for the term of one year and until their successors are elected, unless sooner disqualified or removed by a vote of two-thirds of the whole Board. All other officers, clerks, agents and employees elected by the Board, or appointed by the Chairman, the Chief Executive Officer, the President, or a Vice Chairman of the Board, or under their authority, shall hold their respective offices at the pleasure of the Board or officers elected pursuant to Sections 4.01(a).
Section 4.04. Chairman of the Board. The Chairman shall preside at all meetings of the stockholders and at all meetings of the Board. The Chairman of the Board shall have the same power to perform any act on behalf of the Corporation and to sign for the Corporation as is prescribed in these By-laws for the Chief Executive Officer. He shall perform such other duties as from time to time may be prescribed by the Board.
Section 4.05. Chief Executive Officer The Chief Executive Officer shall be the chief executive officer of the Corporation and shall have, subject to the control of the Board and the Chairman, general supervision and direction of the business and affairs of the Corporation and of its several officers other than the Chairman. In the absence of the Chairman, he shall preside at all meetings of the stockholders and at all meetings of the Board. He shall have the power to execute any document or perform any act on behalf of the Corporation, including without limitation the power to sign checks, orders, contracts, leases, notes, drafts and other documents and instruments in connection with the business of the Corporation, and together with the Secretary or an Assistant Corporate Secretary execute conveyances of real estate and other documents and instruments to which the seal of the Corporation may be affixed. He shall perform such other duties as from time to time may be prescribed by the Board.
Section 4.06. President. The President shall, subject to the direction and control of the Board and the Chief Executive Officer, participate in the supervision of the business and affairs of the Corporation. In general, the President shall perform all duties incident to the office of President, and such other duties as from time to time may be prescribed by the Board or the Chief Executive Officer. In the absence of the Chairman and the Chief Executive Officer, the President shall preside at meetings of stockholders and of the Board. The President shall have the same power to perform any act on behalf of the Corporation and to sign for the Corporation as is prescribed in these By-laws for the Chief Executive Officer.
Section 4.07. Vice Chairman of the Board. The Vice Chairman of the Board, or if there be more than one, then each of them, shall, subject to the direction and control of the Board and the Chief Executive Officer, participate in the supervision of the business and affairs of the Corporation, and shall have such other duties as may be prescribed from time to time by the Board or the Chief Executive Officer. In the absence of the Chairman, the Chief Executive Officer and the President, a Vice Chairman, as designated by the Chairman or the Board, shall preside at meetings of the stockholders and of the Board. Each Vice Chairman shall have the same power to perform any act on behalf of the Corporation and to sign for the Corporation as is prescribed in these By-laws for the Chief Executive Officer.
Section 4.08. Chief Financial Officer. The Chief Financial Officer shall have such powers and perform such duties as the Board, the Chairman, the Chief Executive Officer, the President or a Vice Chairman of the Board may from time to time prescribe which may include,
-11-
without limitation, responsibility for strategic planning, corporate finance, control, tax and auditing and shall perform such other duties as may be prescribed by these By-laws.
Section 4.09. Controller. The Controller shall exercise general supervision of the accounting departments of the Corporation. He shall be responsible to the Chief Financial Officer and shall render reports from time to time relating to the general financial condition of the Corporation. He shall render such other reports and perform such other duties as from time to time may be prescribed by the Chief Financial Officer, a Vice Chairman of the Board, the President, the Chief Executive Officer, or the Chairman.
Section 4.10. Secretary. The Secretary shall:
| (a) | record all the proceedings of the meetings of the stockholders, the Board and the Executive Committee in one or more books kept for that purpose; |
| (b) | see that all notices are duly given in accordance with the provisions of these By-laws or as required by law; |
| (c) | be custodian of the seal of the Corporation; and he may see that such seal or a facsimile thereof is affixed to any documents the execution of which on behalf of the Corporation is duly authorized and may attest such seal when so affixed; and |
| (d) | in general, perform all duties incident to the office of Secretary and such other duties as from time to time may be prescribed by the Board, the Chairman, the Chief Executive Officer, the President, or a Vice Chairman of the Board. |
Section 4.11. Assistant Corporate Secretary. At the request of the Secretary, or in case of his absence or inability to act, the Assistant Corporate Secretary, or if there be more than one, any of the Assistant Corporate Secretaries, shall perform the duties of the Secretary and, when so acting, shall have all the powers of, and be subject to all the restrictions upon, the Secretary. Each Assistant Corporate Secretary shall perform such other duties as from time to time may be prescribed by the Chairman, the Chief Executive Officer, the President, a Vice Chairman of the Board, or the Secretary.
Section 4.12. General Auditor. The General Auditor shall continuously examine the affairs of the Corporation. He shall have and may exercise such powers and duties as from time to time may be prescribed by the Board, the Chairman, the Chief Executive Officer, the President, a Vice Chairman of the Board or the Chief Financial Officer.
Section 4.13. Powers and Duties of Other Officers. The powers and duties of all other officers of the Corporation shall be those usually pertaining to their respective offices, subject to the direction and control of the Board and as otherwise provided in these By-laws.
-12-
ARTICLE V
Proxies re Stock or Other Securities of
Other Corporations
Unless otherwise provided by the Board, the Chairman, the Chief Executive Officer, the President, a Vice Chairman of the Board, the Chief Financial Officer or the Secretary may from time to time (a) appoint an attorney or attorneys or an agent or agents of the Corporation to exercise in the name and on behalf of the Corporation the powers and rights which the Corporation may have as the holder of stock or other securities in any other corporation to vote or consent in respect of such stock or other securities; (b) instruct the person or persons so appointed as to the manner of exercising such powers and rights; and (c) execute or cause to be executed in the name and on behalf of the Corporation and under its corporate seal, or otherwise, all such written proxies or other instruments as he may deem necessary or proper in order that the Corporation may exercise its said powers and rights.
ARTICLE VI
Shares and Their Transfer
Section 6.01. Certificates for Stock. The shares of all classes or series of the capital stock of the Corporation may be uncertificated shares, except to the extent otherwise required by applicable law and except to the extent shares are represented by outstanding certificates that have not been surrendered to the Corporation or its transfer agent. Notwithstanding the foregoing, every owner of stock of the Corporation of any class (or, if stock of any class shall be issuable in series, any series of such class) shall be entitled to have a certificate, in such form as the Board shall prescribe, certifying the number of shares of stock of the Corporation of such class, or such class and series, owned by him. The certificates representing shares of stock of each class (or, if there shall be more than one series of any class, each series of such class) shall be numbered in the order in which they shall be issued and shall be signed in the name of the Corporation by the Chairman, the Chief Executive Officer, the President, or a Vice Chairman of the Board, and by the Secretary or an Assistant Corporate Secretary; provided, however, that if any such certificate is countersigned by a registrar and the Board shall by resolution so authorize, the signatures of such Chairman, Chief Executive Officer, President, Vice Chairman of the Board, Secretary or Assistant Corporate Secretary or any transfer agent may be facsimiles. In case any officer or officers or transfer agent of the Corporation who shall have signed, or whose facsimile signature or signatures shall have been placed upon any such certificate shall cease to be such officer or officers or transfer agent before such certificate shall have been issued, such certificate may be issued by the Corporation with the same effect as though the person or persons who signed such certificate, or whose facsimile signature or signatures shall have been placed thereupon were such officer and officers or transfer agent at the date of issue. A stock ledger shall be kept of the respective names of the persons, firms or corporations owning stock represented by certificates for stock of the Corporation, the number, class and series of shares represented by such certificates, respectively, and the respective dates thereof, and in case of cancellation, the respective dates of cancellation. Every certificate surrendered to the Corporation for exchange or transfer shall be cancelled and a new certificate or certificates shall not be issued in exchange for any existing certificate until such existing certificate shall have been so cancelled, except in cases provided for in Section 6.04 or otherwise required by law.
-13-
Section 6.02. Transfers of Stock. Transfers of shares of the stock of the Corporation shall be made on the stock books and records of the Corporation only by the registered holder thereof, or by his attorney thereunto authorized by power of attorney duly executed and filed with the Secretary, or with a transfer agent duly appointed, and upon surrender of the certificate or certificates for such shares properly endorsed, if such shares are represented by a certificate, and payment of all taxes thereon. The person in whose name shares of stock stand on the stock books and records of the Corporation shall be deemed the owner thereof for all purposes as regards the Corporation.
Section 6.03. Regulations. The Board may make such rules and regulations as it may deem expedient, not inconsistent with these By-laws, concerning the issue, transfer and registration of uncertificated shares or certificates for stock of the Corporation. The Board may appoint, or authorize any officer or officers to appoint, one or more transfer agents and one or more registrars, and may require all certificates for stock to bear the signature or signatures of any of them.
Section 6.04. Lost, Stolen, Destroyed and Mutilated Certificates. The owner of any stock of the Corporation shall immediately notify the Corporation of any loss, theft, destruction or mutilation of any certificate therefor, and the Corporation may issue uncertificated shares or a new certificate for stock in the place of any certificate theretofore issued by it and alleged to have been lost, stolen or destroyed, and the Board may, in its discretion, require the owner of the lost, stolen or destroyed certificate or his legal representatives to give the Corporation a bond in such sum, limited or unlimited, and in such form and with such surety or sureties, as the Board shall in its uncontrolled discretion determine, to indemnify the Corporation against any claim that may be made against it on account of the alleged loss, theft or destruction of any such certificate, or the issuance of any such new certificate. The Board may, however, in its discretion refuse to issue any such new certificate except pursuant to legal proceedings under the laws of the State of Delaware in such case made and provided.
Section 6.05. Fixing Date for Determination of Stockholders of Record.
| (a) | In order that the Corporation may determine the stockholders entitled to notice of or to vote at any meeting of stockholders or any adjournment thereof, the Board may fix a record date, which record date shall not precede the date upon which the resolution fixing the record date is adopted by the Board, and which record date shall not be more than sixty (60) nor less than ten (10) days before the date of such meeting. If no record is fixed by the Board, the record date for determining stockholders entitled to notice of or to vote at a meeting of stockholders shall be at the close of business on the day next preceding the day on which notice is given, or, if notice is waived, at the close of business on the day next preceding the day on which the meeting is held. A determination of stockholders of record entitled to notice of or to vote at a meeting of stockholders shall apply to any adjournment of the meeting; provided, however, that the Board may fix a new record date for the adjourned meeting. |
| (b) | In order that the Corporation may determine the stockholders entitled to consent to corporate action in writing without a meeting, the Board may fix a record date, which record date shall not precede the date upon which the resolution fixing the record date is adopted by the Board, and which date shall not be more than ten (10) days after the date upon which the resolution fixing the record date is adopted by the Board. If no record |
-14-
| date has been fixed by the Board, the record date for determining stockholders entitled to consent to corporate action in writing without a meeting, when no prior action by the Board is required by Delaware General Corporation Law, shall be the first date on which signed written consent setting forth the action taken or proposed to be taken is delivered to the Corporation by delivery to its registered office in the State of Delaware, its principal place of business, or an officer or agent of the Corporation having custody of the book in which proceedings of meetings of stockholders are recorded. Delivery made to the Corporation’s registered office shall be by hand or by certified or registered mail, return receipt requested. If no record date has been fixed by the Board and prior action by the Board is required by Delaware General Corporation Law, the record date for determining stockholders entitled to consent to corporate action in writing without a meeting shall be at the close of business on the day on which the Board adopts the resolution taking such prior action. |
| (c) | In order that the Corporation may determine the stockholders entitled to receive payment of any dividend or other distribution or allotment of any rights or the stockholders entitled to exercise any rights in respect of any change, conversion or exchange of stock, or for the purpose of any other lawful action, the Board may fix a record date, which record date shall not precede the date upon which the resolution fixing the record date is adopted, and which record date shall be not more than sixty (60) days prior to such action. If no record date is fixed, the record date for determining stockholders for any such purpose shall be the close of business on the day on which the Board adopts the resolution relating thereto. |
ARTICLE VII
Corporate Seal
The corporate seal of the Corporation shall be in the form of a circle and shall bear the full name of the Corporation and the words and figures “Corporate Seal 1968 Delaware”.
ARTICLE VIII
Fiscal Year
The fiscal year of the Corporation shall be the calendar year.
ARTICLE IX
Indemnification
Section 9.01. Right to Indemnification. The Corporation shall to the fullest extent permitted by applicable law as then in effect indemnify any person (the “Indemnitee”) who was or is involved in any manner (including, without limitation, as a party or a witness), or is threatened to be made so involved, in any threatened, pending or completed investigation, claim, action, suit or proceeding, whether civil, administrative or investigative (including without limitation, any action, suit or proceeding by or in the right of the Corporation to procure a judgment in its favor) (a “Proceeding”) by reason of the fact that he is or was a director, officer, employee or agent of the Corporation, or is or was serving at the request of the Corporation as a director, officer or employee
-15-
or agent of another corporation, partnership, joint venture, trust or other enterprise against all expenses (including attorneys’ fees), judgments, fines and amounts paid in settlement actually and reasonably incurred by him in connection with such Proceeding. Such indemnification shall be a contract right and shall include the right to receive payment in advance of any expenses incurred by the Indemnitee in connection with such Proceeding, consistent with the provisions of applicable law as then in effect.
Section 9.02. Contracts and Funding. The Corporation may enter into contracts with any director, officer, employee or agent of the Corporation in furtherance of the provisions of this Article IX and may create a trust fund, grant a security interest or use other means (including, without limitation, a letter of credit) to ensure the payment of such amounts as may be necessary to effect indemnification as provided in this Article IX.
Section 9.03. Employee Benefit Plans. For purposes of this Article IX, references to “other enterprises” shall include employee benefit plans; references to “fines” shall include any excise taxes assessed on a person with respect to any employee benefit plan; and references to “serving at the request of the Corporation” shall include any service as a director, officer, employee, or agent of the Corporation which imposes duties on, or involves services by, such director, officer, employee, or agent with respect to an employee benefit plan, its participants, or beneficiaries; and a person who acted in good faith and in a manner he reasonably believed to be in the interest of the participants and beneficiaries of an employee benefit plan shall be deemed to have acted in a manner not opposed to the best interest of a corporation.
Section 9.04. Indemnification Not Exclusive Right. The right of indemnification and advancement of expenses provided in this Article IX shall not be exclusive of any other rights to which a person seeking indemnification may otherwise be entitled, under any statute, by-law, agreement, vote of stockholders or disinterested directors or otherwise, both as to action in his official capacity and as to action in another capacity while holding such office. The provisions of this Article IX shall inure to the benefit of the heirs and legal representatives of any person entitled to indemnity under this Article IX and shall be applicable to Proceedings commenced or continuing after the adoption of this Article IX, whether arising from acts or omissions occurring before or after such adoption.
Section 9.05. Advancement of Expenses; Procedures. In furtherance, but not in limitation, of the foregoing provisions, the following procedures and remedies shall apply with respect to advancement of expenses and the right to indemnification under this Article IX:
(a) Advancement of Expenses. All reasonable expenses incurred by or on behalf of the Indemnitee in connection with any Proceeding shall be advanced to the Indemnitee by the Corporation within twenty (20) days after the receipt by the Corporation of a statement or statements from the indemnitee requesting such advance or advances from time to time, whether prior to or after final disposition of such Proceeding. Such statement or statements shall reasonably evidence the expenses incurred by the Indemnitee and, if required by law at the time of such advance, shall include or be accompanied by an undertaking by or on behalf of the Indemnitee to repay the amounts advanced if it should ultimately be determined that the Indemnitee is not entitled to be indemnified against such expenses.
(b) Written Request for Indemnification. To obtain indemnification under this Article IX, an Indemnitee shall submit to the Secretary of the Corporation a written request,
-16-
including such documentation and information as is reasonably available to the Indemnitee and reasonably necessary to determine whether and to what extent the Indemnitee is entitled to indemnification (the “Supporting Documentation”). The determination of the Indemnitee’s entitlement to indemnification shall be made within a reasonable time after receipt by the Corporation of the written request for indemnification together with the Supporting Documentation. The Secretary of the Corporation shall, promptly upon receipt of such a request for indemnification, advise the Board in writing that the Indemnitee has requested indemnification.
(c) Procedure for Determination. The Indemnitee’s entitlement to indemnification under this Article IX shall be determined (i) by the Board by a majority vote of a quorum (as defined in Article II of these By-laws) consisting of directors who were not parties to such action, suit or proceeding, or (ii) if such quorum is not obtainable, or, even if obtainable, a quorum of disinterested directors so directs, by independent legal counsel in a written opinion, or (iii) by the stockholders, but only if a majority of the disinterested directors, if they constitute a quorum of the board, presents the issue of entitlement to indemnification to the stockholders for their determination.
ARTICLE X
By-laws
Section 10.01. Inspection. A copy of the By-laws shall at all times be kept in a convenient place at the principal office of the Corporation, and shall be open for inspection by stockholders during business hours.
Section 10.02. Amendments. Except as otherwise specifically provided by statute, these By-laws may be added to, amended, altered or repealed at any meeting of the Board by vote of a majority of the entire Board, provided that written notice of any such proposed action shall be given to each director prior to such meeting, or that notice of such addition, amendment, alteration or repeal shall have been given at the preceding meeting of the Board.
Section 10.03. Construction. The masculine gender, where appearing in these By-laws, shall be deemed to include the feminine gender.
-17-
Exhibit 4.2 CHEMICAL BANKING CORPORATION TO THE CHASE MANHATTAN BANK (NATIONAL ASSOCIATION) Trustee ------------------- INDENTURE Dated as of December 1, 1989 ------------------- CHEMICAL BANKING CORPORATION Reconciliation and tie between Trust Indenture Act of 1939 and Indenture, dated as of , 1989 Trust Indenture Act Section Indenture Section - ---------------- ----------------- Section 310(a)(1) 609 (a)(2) 609 (a)(3) Not Applicable (a)(4) Not Applicable (b) 608
610 Section 311(a) 613(a) (b) 613(b) (b)(2) 703(a)(2) (703)(b) Section 312(a) 701 702(a) (b) 702(b) (c) 702(c) Section 313(a) 703(a) (b) 703(b) (c) 703(a), 703(b) (d) 703(c) Section 314(a) 704 (b) Not Applicable (c)(1) 102 (c)(2) 102 (c)(3) Not Applicable (d) Not Applicable (e) 102 Section 315(a) 601(a) (b) 602 703(a)(6) (c) 601(b) (d) 601(c) (d)(1) 601(a)(1) (d)(2) 601(c)(2) (d)(3) 601(c)(3) (e) 514 Section 316(a) (1)(A) 502 512 (a)(1)(B) 513
(a)(2) Not Applicable (b) 508 Section 317 (a)(1) 503 (a)(2) 504 (b) 1003 Section 318 (a) 107 TABLE OF CONTENTS ---------------- Page Parties 1 Recitals Of The Company * ARTICLE ONE Definitions And Other Provisions Of General Application Section 101. Definitions. * Act...... * Affiliate; control * Attorney-in-Fact * Authenticating Agent * Bank..... * Board of Directors * Board Resolution * Business Day * Commission * Company *
Company Request; Company Order * Corporate Trust Office * corporation * covenant defeasance * Defaulted Interest * defeasance * Depository * Event of Default * Global Security * Holder * Indebtedness for money borrowed * Indenture * interest * Interest Payment Date * Intermediate Subsidiary * Maturity * Officers' Certificate * Opinion of Counsel * Original Issue Discount Security * Outstanding * Payment Agent * Person * Place of Payment *
Predecessor Security * Record Date * Redemption Date * Redemption Price * Regular Record Date * Responsible Officer * Securities * Security Register and Security Registrar * Special Record Date * Stated Maturity * Subsidiary * Trustee * Trust Indenture Act * U.S. Government Obligations * Vice President * Voting Stock * Section 102. Compliance Certificates and Opinions. * Section 103. Form of Documents Delivered to Trustee. * Section 104. Acts of Holders. * Section 105. Notices, Etc., to Trustee and Company. * Section 106. Notice to Holders; Waiver. * Section 107. Conflict with Trust Indenture Act. * Section 108. Effect of Headings and Table of Contents.*
Section 109. Successors and Assigns. * Section 110. Separability Clause. * Section 111. Benefits of Indenture. * Section 112. Governing Law. * Section 113. Legal Holidays. * ARTICLE TWO Security Forms Section 201. Forms Generally. * Section 202. Form of Face of Security. * Section 203. Form of Reverse of Security. * Section 204. Additional Provisions Required in Global Security. * Section 205. Form of Trustee's Certificate of Authentication. * ARTICLE Three The Securities Section 301. Amount Unlimited; Issuable in Series. * Section 302. Denominations. * Section 303. Execution, Authentication, Delivery and Dating. * Section 304. Temporary Securities. * Section 305. Registration, Registration of Transfer and Exchange. * Section 306. Mutilated, Destroyed, Lost and Stolen Securities. *
Section 307. Payment of Interest; Interest Rights Preserved. * Section 308. Persons Deemed Owners. * Section 309. Cancellation. * Section 310. Computation of Interest. * ARTICLE FOUR Satisfaction And Discharge Section 401. Satisfaction and Discharge of Indenture. * Section 402. Application of Trust Money. * ARTICLE FIVE Remedies Section 501. Events of Default. * Section 502. Acceleration of Maturity; Rescission and Annulment. * Section 503. Collection of Indebtedness and Suits for Enforcement by Trustee. * Section 504. Trustee May File Proofs and Claim. * Section 505. Trustee May Enforce Claims Without Possession of Securities. * Section 506. Application of Money Collected. * Section 507. Limitation on Suits. * Section 508. Unconditional Right of Holders to Receive Principal, Premium and Interest. * Section 509. Restoration of Rights and Remedies. * Section 510. Rights and Remedies Cumulative *
Section 511. Delay or Omission Not Waiver. * Section 512. Control by Holders. * Section 513. Waiver of Past Defaults. * Section 514. Undertaking for Costs. * ARTICLE SIX The Trustee Section 601. Certain Duties and Responsibilities. * Section 602. Notice of Defaults. * Section 603. Certain Rights of Trustee. * Section 604. Not Responsible for Recitals or Issuance of Securities. * Section 605. May Hold Securities. * Section 606. Money Held in Trust. * Section 607. Compensation and Reimbursement. * Section 608. Disqualifications; Conflicting Interests.* (a) Elimination of Conflicting Interest or Resignation* (b) Notice of Failure to Eliminate Conflicting Interest or Resign * (c) "Conflict of Interest" Defined * (d) Definitions of Certain Terms Used in This Section * (e) Calculation of Percentages of Securities * Section 609. Corporate Trustee Required; Eligibility. * Section 610. Resignation and Removal; Appointment of Successor. * Section 611. Acceptance of Appointment by Successor. *
Section 612. Merger, Conversion, Consolidation or Succession to Business. * Section 613. Preferential Collection of Claims Against Company. * (a) Segregation and Apportionment of Certain Collections by Trustee, Certain Exceptions * (b) Certain Creditor Relationships Excluded from Segregation and Apportionment * (c) Definition of Certain Terms Used in this Section * Section 614. Appointment of Authenticating Agent. * ARTICLE SEVEN Holders' Lists And Reports By Trustee And Company Section 701. Company to Furnish Trustee Names and Addresses of Holders. * Section 702. Preservation of Information; Communications to Holders. * Section 703. Reports by Trustee. * Section 704. Reports by Company. * ARTICLE EIGHT Consolidation, Merger, Conveyance, Transfer Or Lease Section 801. Company May Consolidate, Etc., Only on Certain Terms. * Section 802. Successor Corporation Substituted. * ARTICLE NINE Supplemental Indentures
Section 901. Supplemental Indentures Without Consent of Holders. * Section 902. Supplemental Indentures with Consent of Holders. * Section 903. Execution of Supplemental Indentures. * Section 904. Effect of Supplemental Indentures. * Section 905. Conformity with Trust Indenture Act. * Section 906. Reference in Securities to Supplemental Indentures. * ARTICLE TEN COVENANTS Section 1001. Payment of Principal, Premium and Interest. * Section 1002. Maintenance of Office or Agency. * Section 1003. Money for Securities Payments to Be Held in Trust. * Section 1004. Corporate Existence. * Section 1005. Payment of Taxes and Other Claims. * Section 1006. Limitation on Disposition of Stock of Bank. * Section 1007. Statement as to Compliance. * Section 1008. Waiver of Certain Covenants. * ARTICLE ELEVEN Redemption Of Securities Section 1101. Applicability of Article. * Section 1102. Election to Redeem; Notice to Trustee. *
Section 1103. Selection by Trustee of Securities to Be Redeemed. * Section 1104. Notice of Redemption. * Section 1105. Deposit of Redemption Price. * Section 1106. Securities Payable on Redemption Date. * Section 1107. Securities Redeemed in Part. * ARTICLE TWELVE Sinking Funds Section 1201. Applicability of Article. * Section 1202. Satisfaction of Sinking Fund Payments with Securities. * Section 1203. Redemption of Securities for Sinking Fund. * ARTICLE THIRTEEN Defeasance And Covenant Defeasance Section 1301. Applicability of Article; Company's Option to Effect Defeasance or Covenant Defeasance. * Section 1302. Defeasance and Discharge. * Section 1303. Covenant Defeasance. * Section 1304. Conditions to Defeasance or Covenant Defeasance. * Section 1305. Deposited Money and U.S. Government Obligations to Be Held in Trust; Other Miscellaneous Provisions. * Testimonium * Signatures And Seals * Acknowledgments *
INDENTURE, DATED AS OF DECEMBER 1, 1989, BETWEEN CHEMICAL BANKING CORPORATION, A CORPORATION DULY ORGANIZED AND EXISTING UNDER THE LAWS OF THE STATE OF DELAWARE (HEREIN CALLED THE "COMPANY"), HAVING ITS PRINCIPAL OFFICE AT 277 PARK AVENUE, NEW YORK, NEW YORK 10172, AND THE CHASE MANHATTAN BANK (NATIONAL ASSOCIATION), A NATIONAL BANKING ASSOCIATION DULY ORGANIZED AND EXISTING UNDER THE LAWS OF THE UNITED STATES, AS TRUSTEE (HEREIN CALLED THE "TRUSTEE"). RECITALS OF THE COMPANY The Company has duly authorized the execution and delivery of this Indenture to provide for the issuance from time to time of its unsecured debentures, notes or other evidences of indebtedness (herein called the "Securities"), to be issued in one or more series as in this Indenture provided. All things necessary to make this Indenture a valid agreement of the Company, in accordance with its terms, have been done. Now, Therefore, This Indenture Witnesseth: For and in consideration of the premises and the purchase of the Securities by the Holders thereof, it is mutually covenanted and agreed, for the equal and proportionate benefit of all Holders of the Securities or of series thereof, as follows: 1. Definitions and Other Provisions of General Application 1. Definitions. For all purposes of this Indenture, except as otherwise expressly provided or unless the context otherwise requires: 1. The terms defined in this Article have the meanings assigned to them in this Article and include the plural as well as the singular; 2. All other terms used herein which are defined in the Trust Indenture Act, either directly or by reference therein, have the meanings assigned to them therein; 3. All accounting terms not otherwise defined herein have the meanings assigned to them in accordance with generally accepted accounting principles, and, except as otherwise herein expressly provided, the term "generally accepted accounting principles" with respect to any computation
required or permitted hereunder shall mean such accounting principles as are generally accepted at the date of such computation; and 4. The words "herein," "hereof" and "hereunder" and other words of similar import refer to this Indenture as a whole and not to any particular Article, Section or other subdivision. Certain terms, used principally in Article Six, are defined in that Article. "Act", when used with respect to any Holder, has the meaning specified in Section 104. "Affiliate" of any specified Person means any other Person directly or indirectly controlling or controlled by or under direct or indirect common control with such specified Person. For the purposes of this definition, "control" when used with respect to any specified Person means the power to direct the management and policies of such Person, directly or indirectly, whether through the ownership of voting securities, by contract or otherwise; and the terms "controlling" and "controlled" have meanings correlative to the foregoing. "Attorney-in-Fact" means an officer of the Bank who has been duly appointed as an attorney-in-fact by the Company. "Authenticating Agent" means any Person authorized by the Trustee to act on behalf of the Trustee to authenticate Securities. "Bank" means Chemical Bank, a banking corporation duly organized and existing under the laws of the State of New York, and its successors (whether by consolidation, merger, conversion, transfer of substantially all their assets and business or otherwise) so long as Chemical Bank or any successor is a Subsidiary. "Board of Directors" means either the board of directors of the Company or any committee of that board duly authorized to set hereunder or any directors or officers of the Company or Attorneys-in-Fact to whom such board of directors or such committee shall have duly delegated its authority.
"Board Resolution" means a copy of a resolution certified by the Secretary or an Assistant Secretary of the Company to have been duly adopted by the Board of Directors and to be in full force and effect on the date of such certification, and delivered to the Trustee. "Business Day", when used with respect to any Place of Payment, means each Monday, Tuesday, Wednesday, Thursday and Friday which is not a day on which banking institutions in that Place of Payment are authorized or obligated by law to close. "Commission" means the Securities and Exchange Commission, as from time to time constituted, created under the Securities Exchange Act of 1934, or, if at any time after the execution of this instrument such Commission is not existing and performing the duties now assigned to it under the Trust Indenture Act, then the body performing such duties at such time. "Company" means the Person named as the "Company" in the first paragraph of this instrument until a successor Person shall have become such pursuant to the applicable provisions of this Indenture, and thereafter "Company" shall mean such successor Person. "Company Request" or "Company Order" means a written request or order signed in the name of the Company by its Chairman of the Board, a Vice Chairman, its President, its Chief Financial Officer, a Vice President or any Attorney-in-Fact, and by its Controller, an Assistant Controller, its Secretary or an Assistant Secretary and delivered to the Trustee. "Corporate Trust Office" means the principal office of the Trustee in the Borough of Manhattan, The City of New York, at which at any particular time its corporate trust business shall be administered, such office being currently located at One New York Plaza, New York, NY 10081. "corporation" includes corporations, associations, companies and business trusts. "covenant defeasance" has the meaning specified in Section 1303.
"Defaulted Interest" has the meaning specified in Section 307. "defeasance" has the meaning specified in Section 1302. "Depository" means, with respect to the Securities of any series issuable or issued in whole or in part in the form of one or more Global Securities, the Person designated as Depository by the Company pursuant to Section 301. "Event of Default" has the meaning specified in Section 501. "Global Security" means a Security in the form prescribed in Section 204 evidencing all or part of a series of Securities, issued to the Depository for such series or its nominee, and registered in the name of such Depository or nominee. "Holder" means a Person in whose name a Security is registered in the Security Register. "Indebtedness for money borrowed", when used with respect to the Company, means any obligation of, or any obligation guaranteed by, the Company for the repayment of borrowed money, whether or not evidenced by bonds, debentures, notes or other written instruments. "Indenture" means this instrument as originally executed or as it may from time to time be supplemented or amended by one or more indentures supplemental hereto entered into pursuant to the applicable provisions hereof and shall include the terms or particular series of Securities established as contemplated by Section 301. "interest", when used with respect to an Original Issue Discount Security which by its terms bears interest only after Maturity, means interest payable after Maturity. "Interest Payment Date", when used with respect to any Security, means the Stated Maturity of an installment of interest on such Security. "Intermediate Subsidiary" has the meaning specified in Section 1006.
"Maturity", when used with respect to any Security, means the date on which the principal of such Security or an instalment of principal becomes due and payable as therein or herein provided, whether at the Stated Maturity or by declaration of acceleration, call for redemption or otherwise. "Officers' Certificate" means a certificate signed by the Chairman of the Board, a Vice Chairman, the President, its Chief Financial Officer, a Vice President or any Attorney-in-Fact, and by the Controller, an Assistant Controller, the Secretary or an Assistant Secretary, of the Company, and delivered to the Trustee. "Opinion of Counsel" means a written opinion of counsel who may be an employee of the Company or other counsel to the Company. "Original Issue Discount Security" means any Security which provides for an amount less than the principal amount thereof to be due and payable upon a declaration of acceleration on the Maturity thereof pursuant to Section 502. "Outstanding", when used with respect to Securities, means, as of the date of determination, all Securities theretofore authenticated and delivered under this Indenture, except: i. Securities theretofore cancelled by the Trustee or delivered to the Trustee for cancellation; ii. Securities for whose payment or redemption money in the necessary amount has been theretofore deposited with the Trustee or any Paying Agent (other than the Company) in trust or set aside and segregated in trust by the Company (if the Company shall act as its own Paying Agent) for the Holders of such Securities; provided that, if such Securities are to
be redeemed, notice of such redemption has been duly given pursuant to this Indenture or provision therefore satisfactory to the Trustee has been made; and iii. Securities which have been paid pursuant to Section 306 or in exchange for or in lieu of which other Securities have been authenticated and delivered pursuant to this Indenture, other than any such Securities in respect of which there shall have been presented to the Trustee proof satisfactory to it that such Securities are held by a bona fide purchaser in whose hands such Securities are valid obligations of the Company; provided, however, that in determining whether the Holders of the requisite principal amount of the Outstanding Securities have given any request, demand, authorization, direction, notice, consent or waiver hereunder, (i) the principal amount of an Original Issue Discount Security that shall be deemed to be Outstanding shall be the amount of the principal thereof that would be due and payable as of the date of such determination upon acceleration of the Maturity thereof pursuant to Section 502, (ii) the principal amount of a Security denominated in a foreign currency or currency unit shall be the U.S. dollar equivalent, determined as of the date of original issuance of such Security, of the principal amount of such Security (or, in the case of an Original Issue Discount Security denominated in a foreign currency or currency unit, the U.S. dollar equivalent as of the date of original issuance of such Security of the amount determined as provided in (i) above), (iii) the principal amount of a Security for which the amount of payments of principal of and any premium or interest on such Security may be determined with reference to an index shall be determined as of the date of original issuance of such Security and (iv) Securities owned by the Company or any other obligor upon the Securities or any Affiliate of the Company or of such other obligor shall be disregarded and deemed not to be Outstanding, except that, in determining whether the Trustee shall be protected in relying upon any such request, demand, authorization, direction, notice, consent or waiver, only Securities which the Trustee knows to be so owned shall be
so disregarded. Securities so owned which have been pledged in good faith may be regarded as Outstanding if the pledgee established to the satisfaction of the Trustee the pledgee's right so to act with respect to such Securities and that the pledgee is not the Company or any other obligor upon the Securities or any Affiliate of the Company or of such other obligor. "Payment Agent" means any Person authorized by the Company to pay the principal of (and premium, if any) or interest on any Securities on behalf of the Company. "Person" means any individual, corporation, partnership, joint venture, association, joint-stock company, trust, unincorporated organization or government or any agency or political subdivision thereof. "Place of Payment", when used with respect to the Securities of any series, means the place or places where the principal of (and premium, if any) and interest on the Securities of that series are payable as specified as contemplated by Section 301. "Predecessor Security" of any particular Security means every previous Security evidencing all or a portion of the same debt as that evidenced by such particular Security; and, for the purposes of this definition, any Security authenticated and delivered under Section 306 in exchange for or in lieu of a mutilated, destroyed, lost or stolen Security shall be deemed to evidence the same debt as the mutilated, destroyed, lost or stolen Security. "Record Date" means a Regular Record Date or a Special Record Date, as the case may be. "Redemption Date", when used with respect to any Security to be redeemed, means the date fixed for such redemption by or pursuant to this Indenture. "Redemption Price", when used with respect to any Security to be redeemed, means the price at which it is to be redeemed pursuant to this Indenture. "Regular Record Date" for the interest payable on any Interest Payment Date on the Securities of any series means the date specified for that purpose as contemplated by Section 301. "Responsible Officer", when used with respect to the Trustee, means the chairman or any vice-chairman of the board of directors, the chairman or any vice-chairman of the executive committee of the board of directors, the chairman of the trust committee, the president, any vice president, the
secretary, any assistant secretary, the treasurer, any assistant treasurer, the cashier, any assistant cashier, any trust officer or assistant trust officer, the controller or any assistant controller or any other officer of the Trustee customarily performing functions similar to those performed by any of the above designated officers and also means, with respect to a particular corporation trust matter, any other officer to whom such matter is referred because of his knowledge of and familiarity with the particular subject. "Securities" has the meaning stated in the first recital of this Indenture and more particularly means any Securities authenticated and delivered under this Indenture. "Security Register" and "Security Registrar" have the respective meanings specified in Section 305. "Special Record Date" for the payment of any Defaulted Interest means a date fixed by the Trustee pursuant to Section 307. "Stated Maturity", when used with respect to any Security or any instalment of principal thereof or interest thereon, means the date specified in such Security as the fixed date on which the principal of such Security or such instalment of principal or interest is due and payable. "Subsidiary" means a corporation more than 50% of the outstanding Voting Stock of which is owned, directly or indirectly, by the Company or by one or more other Subsidiaries, or by the Company and one or more other Subsidiaries. "Trustee" means the Person named as the "Trustee" in the first paragraph of this instrument until a successor Trustee shall have become such pursuant to the applicable provisions of this Indenture, and thereafter "Trustee" shall mean or include each Person who is then a Trustee hereunder, and if at any time there is more than one such Person, "Trustee" as used with respect to the Securities of any series shall mean the Trustee with respect to Securities of that series. "Trust Indenture Act" means the Trust Indenture Act of 1939 as in force at the date as of which the instrument was executed, except as provided in Section 905. "U.S. Government Obligations" has the meaning specified in Section 1304(1). "Vice President", when used with respect to the Company or the Trustee, means any vice president, whether or not designated by a number or a word or words added before or after the title "vice president".
"Voting Stock" means stock of the class or classes having a general voting power under ordinary circumstances to elect at least a majority of the board of directors, managers or trustees of a corporation (irrespective of whether or not at the time stock of any other class or classes shall have or might have voting power by reason of the happening of any contingency). 2. Compliance Certificates and Opinions. Under any application or request by the Company to the Trustee to take any action under any provision of this Indenture, the Company shall furnish to the Trustee an Officers' Certificate stating that all conditions precedent, if any, provided for in this Indenture relating to the proposed action have been complied with and an Opinion of Counsel stating that in the opinion of such counsel all such conditions precedent, if any, have been complied with, except that in the case of any such application or request as to which the furnishing of such documents is specifically required by any provision of this Indenture relating to such particular application or request, no additional certificate or opinion need be furnished. Every certificate or opinion with respect to compliance with a condition or covenant provided for in this Indenture shall include 1. a statement that each individual signing such certificate or opinion has read such covenant or condition and the definitions herein relating thereto; 2. a brief statement as to the nature and scope of the examination or investigation upon which the statements or opinions contained in such certificate or opinion are based; 3. a statement that, in the opinion of each such individual, he has made such examination or investigation as is necessary to enable him to express an informed opinion as to whether or not such covenant or condition has been complied with; and 4. a statement as to whether, in the opinion of each such individual, such condition or covenant has been complied with. 3. Form of Documents Delivered to Trustee. In any case where several matters are required to be certified by, or covered by an opinion of any specified Person, it is not necessary that all such matters be certified by, or covered by the opinion of, only one such Person, or that they be so certified or covered by only one document, but one such Person may certify or give an opinion with respect to some matters and one or more other such Persons as to other matters, and any
such Person may certify or give an opinion as to such matters on one or several documents. Any certificate or opinion of an officer of, or Attorney-in-Fact for, the Company may be based, insofar as it relates to legal matters, upon a certificate or opinion of, or representations by counsel, unless such officer or Attorney-in-Fact knows, or in the exercise of reasonable care should know, that the certificate or opinion or representations with respect to the matters upon which his certificate or opinion is based are erroneous. Any such certificate or Opinion of Counsel may be based, insofar as it relates to factual matters, upon a certificate or opinion of, or representations by, an officer or officers of, or an Attorney-Fact or Attorneys-in-Fact for, the Company stating that the information with respect to such factual matters is in the possession of the Company, unless such counsel knows, or in the exercise of reasonable care should know, that the certificate or opinion or representations with respect to such matters are erroneous. Where any Person is required to make, give or execute two or more applications, requests, consents, certificates, statements, opinions or other instruments under this Indenture, they may, but need not, be consolidated and form one instrument. 4. Acts of Holders. a. Any request, demand, authorization, direction, notice, consent, waiver or other action provided by this Indenture to be given or taken by Holders may be embodied in and evidenced by one or more instruments of substantially similar tenor signed by such Holders in person or by agent duly appointed in writing; and, except as herein otherwise expressly provided, such action shall become effective when such instrument or instruments are delivered to the Trustee and, where it is hereby expressly required, to the Company. Such instrument or instruments (and the action embodied therein and evidenced thereby) are herein sometimes referred to as the "Act" of the Holders signing such instrument or instruments. Proof of execution of any such instrument or of a writing appointing any such agent shall be sufficient for any purpose of this Indenture and (subject to Section 601) conclusive in favor of the Trustee and the Company, if made in the manner provided in this Section. b. The fact and date of the execution by any Person of any such instrument or writing may be proved by the affidavit of a witness of such execution or by a certificate of a notary public or other officer authorized by law to take acknowledgments of deeds, certifying that the individual signing such instrument or writing acknowledged to him the execution thereof. Where such execution is by a signer acting in a capacity other than his individual
capacity, such certificate or affidavit shall also constitute sufficient proof of his authority. The fact and date of the execution of any such instrument or writing, or the authority of the Person executing the same, may also be proved in any other manner which the Trustee deems sufficient. c. The ownership of Securities shall be proved by the Security Register. d. Any request, demand, authorization, direction, notice, consent, waiver or other Act of the Holder of any Security shall bind every future Holder of the same Security and the Holder of every Security issued upon the registration of transfer thereof or in exchange therefore or in lieu thereof in respect of anything done, omitted or suffered to be done by the Trustee or the Company in reliance thereon, whether or not notation of such action is made upon such Security. 5. Notices, Etc., to Trustee and Company. Any request, demand, authorization, direction, notice, consent, waiver or Act of Holders or other document provided or permitted by this Indenture to be made upon, given or furnished in, or filed with, 1. the Trustee by any Holder or by the Company shall be sufficient for every purpose hereunder if made, given, furnished or filed in writing to or with the Trustee at its Corporate Trust Office, Attention: Corporate Trust Department, or 2. the Company by the Trustee or by any Holder shall be sufficient for every purpose hereunder (unless otherwise herein expressly provided) if in writing and mailed, first-class postage prepaid, to the Company addressed to it, attention: Secretary, at the address of its principal office specified in the first paragraph of this instrument or at any other address previously furnished in writing to the Trustee by the Company. 6. Notice to Holders; Waiver. Where this Indenture provides for notice to Holders of any event, such notice shall be sufficiently given (unless otherwise herein expressly provided) if in writing and mailed, first-class postage prepaid, to each Holder affected by such event, at his address as it appears in the Security Register, not later than the latest date, and not earlier than the earliest date, prescribed for the giving of such notice. In any case where notice to Holder is given by mail, neither the failure to mail such notice, nor any defect in any notice so mailed, to any particular Holder shall affect the sufficiency of such notice with respect to other Holders. Any notice which is mailed in the manner herein provided shall be conclusively presumed to
have been duly given. Where this Indenture provides for notice in any manner, such notice may be waived in writing by the Person entitled to receive such notice, either before or after the event, and such waiver shall be equivalent of such notice. Waivers of notice by Holders shall be filed with the Trustee, but such filing shall not be a condition precedent to the validity of any action taken in reliance upon such waiver. In case by reason of the suspension of regular mail service or by reason of any other cause it shall be impracticable to give one's notice by mail, then such notification as shall be made with the approval of the Trustee shall constitute a sufficient notification for every purpose hereunder. 7. Conflict with Trust Indenture Act. If any provision hereof limits, qualifies or conflicts with another provision hereof which is required to be included in this Indenture by any of the provisions of the Trust Indenture Act, such required provision shall control. 8. Effect of Headings and Table of Contents. The Article and Section headings herein and the Table of Contents are for convenience only and shall not affect the construction hereof. 9. Successors and Assigns. All covenants and agreements in this Indenture by the Company shall bind its successors and assigns, whether so expressed or not. 10. Separability Clause. In case any provision in this Indenture or in the Securities shall be invalid, illegal or unenforceable, the validity, legality and enforceability of the remaining provisions shall not in any way be affected or impaired thereby. 11. Benefits of Indenture. Nothing in this Indenture or in the Securities, express or implied, shall give to any Person, other than the parties hereto and their successors hereunder and the Holders, any benefit or any legal or equitable right, remedy or claim under this Indenture. 12. Governing Law. This Indenture and the Securities shall be governed by and construed in accordance with the laws of the State of New York.
13. Legal Holidays. In any case where any Interest Payment Date, Redemption Date or Stated Maturity of any Security shall not be a Business Day at any Place of Payment, then (notwithstanding any other provision of this Indenture or of the Securities) payment of interest or principal (and premium, if any) need not be made at such Place of Payment on such date, but may be made on the next succeeding Business Day at such Place of Payment with the same force and effect as if made on the Interest Payment Date or Redemption Date, or at the Stated Maturity, provided that no interest shall accrue for the period from and after such Interest Payment Date, Redemption Date or Stated Maturity, as the case may be. 2. Security Forms 1. Forms Generally. The Securities of each series shall be substantially in the form set forth in this Article, or in such other form (including permanent global form) as shall be established by or pursuant to a Board Resolution or in one or more indentures supplemental hereto, in each case with such appropriate insertions, omissions, substitutions and other variations as are required or permitted by this Indenture, and may have such letters, numbers or other marks of identification and such legends or endorsements placed thereon as may be required to comply with the rules of any securities exchange or as may, consistently herewith, be determined by the officers of the Company or any Attorney-in-Fact executing such Securities, as evidenced by their execution of the Securities. If the form of Securities of any series is established by action taken pursuant to a Board Resolution, a copy of an appropriate record of such action shall be certified by the Secretary or an Assistant Secretary of the Company and delivered to the Trustee at or prior to the delivery of the Company Order contemplated by Section 303 for the authentication and delivery of such Securities. If all of the Securities of any series established by action taken pursuant to a Board Resolution are not to be issued at one time, it shall not be necessary to deliver a record of such action at the time of issuance of each Security of such series, but an appropriate record of such action shall be delivered at or before the time of issuance of the first Security of such series. The Trustee's certificates of authentication shall be in substantially the form set forth in this Article. The definitive Securities shall be printed, lithographed or engraved on steel engraved borders or may be produced in any other manner (provided that if any Securities are to be listed on any securities exchange, then in such manner as may be permitted by the rules of any such securities
exchange), all as determined by the officers of the Company or any Attorney-in-Fact executing such Securities, as evidenced by their execution of such Securities. 2. Form of Face of Security. [Insert any legend required by the Internal Revenue Code and the regulations thereunder] CHEMICAL BANKING CORPORATION ---------------------------------------------------------------------- No. _________ $_______ CHEMICAL BANKING CORPORATION, a corporation duly organized and existing under the laws of the State of Delaware (herein called the "Company", which term includes any successor corporation under the Indenture hereinafter referred to), for value received, hereby promises to pay to ____________________________, or registered assigns, the principal sum of ________________________________________ Dollars on ______________________________________ [if the Security is to bear interest prior to Maturity, insert , and to pay interest thereon from _______________ or from the most recent Interest Payment Date to which interest has been paid or duly provided for, [insert appropriate period] or _________________ and _______________ in each year, commencing ______________, at the rate of __% per annum, until the principal hereof is paid or made available for payment [if applicable, insert , and (to the extent that the payment of such interest shall be legally enforceable) at the rate of __% per annum on any overdue principal and premium [if applicable, insert and on any overdue instalment of interest]. The interest so payable, and punctually paid or duly provided for, on any Interest Payment Date will, as provided in such Indenture, be paid to the Person in whose name this Security (or one or more Predecessor Securities) is registered at the close of business on the Regular Record Date for such interest, which shall be the ________ or _______ (whether or not a Business Day), as the case may be, next preceding such Interest Payment Date. Any such interest not so punctually paid or duly provided for will forthwith cease to be payable to the Holder on such Regular Record Date and may either be paid to the Person in whose name this Security (or one or more Predecessor Securities) is registered at the close of business on a Special Record Date for the payment of such Defaulted Interest to be fixed by the Trustee, notice whereof shall be given to Holders of Securities of this series not less than 10 days prior to such Special Record Date, or be paid at any time in any other lawful manner
not inconsistent with the requirements of any securities exchange on which the Securities of this series may be listed, and upon such notice as may be required by such exchange, all as more fully provided in said Indenture]. [If the Security is not to bear interest prior to Maturity, insert The principal of this Security shall not bear interest except in the case of a default in payment of principal upon acceleration, upon redemption or at Stated Maturity and in such case the overdue principal of this Security shall bear interest at the rate of __% per annum (to the extent that the payment of such interest shall be legally enforceable), which shall accrue from the date of such default in payment to the date payment of such principal has been made or duly provided for. [Interest on any overdue principal shall be payable on demand. Any such interest on any overdue principal that is not so paid on demand shall bear interest at the rate of __% per annum (to the extent that the payment of such interest shall be legally enforceable), which shall accrue from the date of such demand for payment to the date payment of such interest has been made or duly provided for, and such interest shall also be payable on demand].] Payment of the principal of (and premium, if any) and [if applicable, insert any such] interest on this Security will be made at the office or agency of the Company maintained for that purpose in _____________, in such coin or currency of the United States of America as at the time of payment is legal tender for payment of public and private debts [unless otherwise specifically provided with respect to the Securities of the series, insert ; provided, however, that at the option of the Company payment of interest may be made by check mailed to the address of the Person entitled thereto as such address shall appear in the Security Register]. Reference is hereby made to the further provisions of this Security set forth on the reverse hereof, which further provisions shall for all purposes have the same effect as if set forth at this place. Unless the certificate of authentication hereon has been executed by the Trustee referred to on the reverse hereof, or an Authenticating Agent, by manual signature, this Security shall not be entitled to any benefit under the Indenture or be valid or obligatory for any purpose. In Witness Whereof, the Company has caused this instrument to be duly executed under its corporate seal. Dated: _________________________________________
By_______________________________________ Attest: ______________________________________ 3. Form of Reverse of Security. This Security is one of a duly authorized series of securities of the Company (herein called the "Securities"), issued and to be issued in one or more series under an Indenture, dated as of December 1, 1989 (herein called the "Indenture"), between the Company and the Chase Manhattan Bank (National Association), as Trustee (herein called the "Trustee", which term includes any successor trustee under the Indenture), to which Indenture and all indentures supplemental thereto reference is hereby made for a statement of the respective rights, limitations of rights, duties and immunities thereunder of the Company, the Trustee and the Holders of the Securities and of the terms upon which the Securities are, and are to be, authenticated and delivered. This Security is one of the series designated on the face hereof [, limited in aggregated principal amount to $________]. [If applicable, insert The Securities of this series are subject to redemption upon not less than 30 days' nor more than 60 days' notice by mail [if applicable, insert (1) on ________________ in any year commencing with the year _________ and ending with the year __________ through operation of the sinking fund for this series at a Redemption Price equal to 100% of the principal amount, and (2)] at any time [on or after ______________, 19__], as a whole or in part, at the election of the Company, at the following Redemption Prices (expressed as percentages of the principal amount): If redeemed [on or before ______________, __%, and if redeemed] during the 12-month period beginning ______________ of the years indicated, REDEMPTION REDEMPTION YEAR PRICE YEAR PRICE
And thereafter at a Redemption Price equal to __% of the principal amount, together in the case of any such redemption [if applicable, insert (whether through operation of the sinking fund or otherwise)] with accrued interest to the Redemption Date, but interest instalments whose Stated Maturity is on or prior to such Redemption Date will be payable to the Holders of such Securities, or one or more Predecessor Securities, of record at the close of business on the relevant Regular Record Dates referred to on the face hereof, all as provided in the Indenture.] [If applicable, insert The Securities of this series are subject to redemption upon not less than 30 days' nor more than 60 days' notice by mail (1) on _____________ in any year commencing with the year ________ and ending with the year ________ through operation of the sinking fund for this series at the Redemption Prices for redemption through operation of the sinking fund (expressed as percentages of the principal amount) set forth in the table below, and (2) at any time [on or after _____________], as a whole or in part, at the election of the Company, at the Redemption Prices for redemption otherwise than through operation of the sinking fund (expressed as percentages of the principal amount) set forth in the table below: If redeemed during the 12-month period beginning ________________ of the years indicated, REDEMPTION PRICE FOR REDEMPTION REDEMPTION PRICE FOR THROUGH OPERATION REDEMPTION OTHERWISE OF THE THEN THROUGH OPERATION YEAR SINKING FUND OF THE SINKING FUND
and thereafter at a Redemption Price equal to __% of the principal amount, together in the case of any such redemption (whether through operation of the sinking fund or otherwise) with accrued interest to the Redemption Date, but interest instalments whose Stated Maturity is on or prior to such Redemption Date will be payable to the Holders of such Securities, or one or more Predecessor Securities, of record at the close of business on the relevant Regular Record Dates referred to on the face hereof, all as provided in the Indenture.] [Notwithstanding the foregoing, the Company may not, prior to ________________, redeem any Securities of this series as contemplated by [Clause (2) of] the preceding paragraph as a part of, or in anticipation of, any refunding operation by the application, directly or indirectly, of moneys borrowed having an interest cost to the Company (calculated in accordance with generally accepted financial practices) of less than __% per annum.] [The sinking fund for this series provides for the redemption on _____________ in each year beginning with the year _______ and ending with the year ________of [not less than] $_______ [("mandatory sinking fund") and not more than $________] aggregate principal amount of Securities of this series. [Securities of this series acquired or redeemed by the Company otherwise than through [mandatory] sinking fund payments may be credited against subsequent [mandatory] sinking fund payments otherwise required to be made [if applicable, insert in the inverse order in which they become due].] In the event of redemption of this Security in part only, a new Security or Securities of this series and of like tenor for the unredeemed portion
hereof will be issued in the name of the Holder hereof upon the cancellation hereof. [If applicable, insert The Indenture contains provisions for defeasance at any time of [(a)] [the entire indebtedness evidenced by this Security] [and (b)] certain restrictive covenants,] [in each case] upon compliance by the Company with certain conditions set forth therein, which provisions apply to this Security.] [If the Security is not an Original Issue Discount Security, insert If an Event of Default with respect to Securities of this series shall occur and be continuing, the principal of the securities of this series may be declared due and payable in the manner and with the effect provided in the Indenture.] [If the Security is an Original Issue Discount Security, insert If an Event of Default with respect to Securities of this series shall occur and be continuing, an amount of principal of the Securities of this series may be declared due and payable in the manner and with the effect provided in the Indenture. Such amount shall be equal to insert formula for determining the amount.] Upon payment (i) of the amount of principal so declared due and payable and (ii) of interest on any overdue principal and overdue interest (in each case to the extent that the payment of such interest shall be legally enforceable), all of the Company's obligations in respect of the payment of the principal of and interest, if any, on the Securities of this series shall terminate. The Indenture permits, with certain exceptions as therein provided, the amendment thereof and the modification of the rights and obligations of the Company and the rights of the Holders of the Securities of each series to be affected under the Indenture at any time by the Company and the Trustee with the consent of the Holders of a majority in principal amount of the Securities at the time Outstanding of each series to be affected. The Indenture also contains provisions permitting the Holders of specified percentages in principal amount of the Securities of each series at the time Outstanding, on behalf of the Holders of all Securities of such series, to waive compliance by the Company with certain provisions of the Indenture and certain past defaults under the Indenture and their consequences. Any such consent or waiver by the Holder of this Security shall be conclusive and binding upon such Holder and upon all future Holders of this Security and of any Security issued upon the registration of transfer hereof or in exchange herefor or in lieu hereof, whether or not notation of such consent or waiver is made upon this Security. No reference herein to the Indenture and no provision of this Security or of the Indenture shall alter or impair the obligation of the Company, which is absolute and unconditional, to pay the principal of (and premium if any)
and interest (if any) on this Security at the times, place and rate, and in the coin or currency, herein prescribed. As provided in the Indenture and subject to certain limitations therein set forth, the transfer of this Security is registrable in the Security Register, upon surrender of this Security for registration of transfer at the office or agency of the Company in any place where the principal of (and premium, if any) and interest (if any) on this Security are payable, duly endorsed by, or accompanied by a written instrument of transfer in form satisfactory to the Company and the Security Registrar duly executed by, the Holder hereof or his attorney duly authorized in writing, and thereupon one or more new Securities of this series, of authorized denominations and for the same aggregate principal amount, will be issued to the designated transferee or transferees. The Securities of this series are issuable only in registered form without coupons in denominations of $_______ and any integral multiple thereof. As provided in the Indenture and subject to certain limitations therein set forth, Securities of this series are exchangeable for a like aggregate principal amount of Securities of this series of like tenor of a different authorized denomination, as requested by the Holder surrendering the same. No service charge shall be made for any such registration of transfer or exchange, but the Company may require payment of a sum sufficient to cover any tax or other governmental charge payable in connection therewith. Prior to due presentment of this Security for registration of transfer, the Company, the Trustee and any agent of the Company or the Trustee may treat the Person in whose name this Security is registered as the owner hereof for all purposes, whether or not this Security be overdue, and neither the Company, the Trustee nor any such agent shall be affected by notice to the contrary. All terms used in this Security which are defined in the Indenture shall have the meanings assigned to them in the Indenture. 4. Additional Provisions Required in Global Security. Any Global Security issued hereunder shall, in addition to the provisions contained in Sections 202 and 203, bear a legend in substantially the following form: "This Security is a Global Security within the meaning of the Indenture hereinafter referred to and is registered in the name of a Depository or a
nominee of a Depository. This Security is exchangeable for Securities registered in the name of a person other than the Depository or its nominee only in the limited circumstances described in the Indenture and may not be transferred except as a whole by the Depository to a nominee of the depository or by a nominee of the Depository to the Depository or another nominee of the Depository. Unless otherwise provided as contemplated by Section 301 with respect to any series of Securities, any Global Security shall provide, in addition to the provisions set forth in Sections 202 and 203 and the preceding paragraph, that the Depository will not sell, assign, transfer or otherwise convey any beneficial interest in such Global Security unless such beneficial interest is in an amount equal to an authorized denomination for Securities of such series, and that the Depository, by accepting such Global Security, agrees to be bound by such provision. 5. Form of Trustee's Certificate of Authentication. This is one of the Securities of the series designated therein referred to in the within-mentioned Indenture. THE CHASE MANHATTAN BANK (NATIONAL ASSOCIATION) as Trustee By____________________________________ Authorized Officer THE CHASE MANHATTAN BANK (NATIONAL ASSOCIATION) as Trustee By Chemical Bank Authenticating Agent By____________________________________ Authorized Signer
3. The Securities 1. Amount Unlimited; Issuable in Series. The aggregate principal amount of Securities which may be authenticated and delivered under this Indenture is unlimited. The Securities may be issued in one or more series. There shall be established in or pursuant to a Board Resolution and, subject to Section 303, set forth, or determined in the manner provided, in an Officers' Certificate, or established in one or more indentures supplemental hereto, prior to the issuance of Securities of any series, 1. the title of the Securities of the series (which shall distinguish the Securities of the series from all other Securities); 2. any limit upon the aggregate principal amount or the aggregate initial offering price of the Securities of the series which may be authenticated and delivered under this Indenture (except for Securities authenticated and delivered upon registration of, transfer of, or in exchange for, or in lieu of, other Securities of the series pursuant to Section 304, 305, 906 or 1107 and except for any Securities which, pursuant to Section 303, shall not have been issued and sold by the Company and are therefore deemed never to have been authenticated and delivered hereunder); 3. the Person to whom any interest on a Security of the series shall be payable, if other than the Person in whose name that Security (or one or more Predecessor Securities) is registered at the close of business on the Regular Record Date for such interest; 4. the date or dates on which the principal of the Securities of the series is payable; the provisions, if any, for extension of such date or dates; 5. the rate or rates (or the formula pursuant to which such rate or rates shall be determined) at which the Securities of the series shall bear interest, if any, including that rate of interest applicable to overdue payments of principal, and the rate of interest, if any, applicable to overdue payments of interest if different from the rate of interest stated in the title of the Security; the date or dates from which such interest shall accrue, the Interest Payment Dates on which such interest shall be payable and the Regular Record Date for the interest payable on any Interest Payment Date;
6. the place or places where the principal of (and premium, if any) and interest, if any, on the Securities of the series shall be payable; 7. if applicable, the period or periods within which, the price or prices at which and the terms and conditions upon which Securities of the series may be redeemed, in whole or in part, at the option of the Company; 8. the obligation, if any, of the Company to redeem or purchase Securities of the series pursuant to any sinking fund or analogous provisions or at the option of a Holder thereof and the period or periods within which, the price or prices at which and the terms and conditions upon which Securities of the series shall be redeemed or purchased, in whole or in part, pursuant to such obligation; 9. if other than denominations of $1,000 and any integral multiple thereof, the denominations in which Securities of the series shall be issuable; 10. if other than the currency of the United States, the currency or currencies, including composite currencies, in which payment of the principal of and any premium and interest on the Securities of the series shall be payable, which may be different for principal, premium, if any, and interest; 11. if the principal of (and premium, if any) or interest, if any, on the Securities of the series are to be payable, at the election of the Company or a Holder thereof, in a currency or currencies other than that in which the Securities are stated to be payable, the currency or currencies in which payment of the principal of (and premium, if any) or interest, if any, on Securities of such series as to which such election is made shall be payable, and the period or periods within which, and the terms and conditions upon which, such election may be made; 12. if the amount of payments of principal of and any premium or interest on the Securities of the series may be determined with reference to an index, the manner in which such amounts shall be determined; 13. if other than the principal amount thereof, the portion of the principal amount of Securities of the series which shall be payable upon declaration of acceleration of the Maturity thereof pursuant to Section 502; 14. any Event of Default with respect to the Securities of the series, if not set forth herein; 15. the application, if any, of either or both of Section 1302 and Section 1303 to the Securities of the series. 16. whether the Securities of the series shall be issued in whole or in part in the form of one or more Global Securities and,
in such case, the Depository for such Global Security or Securities, which Depository shall be, if then required by applicable law or regulation, a clearing agency registered under the Securities Exchange Act of 1934, as amended; and 17. any other terms of the series (which terms shall not be inconsistent with the provisions of this Indenture), including any covenants to be applicable to Securities of such series if not set forth herein. All Securities of any one series shall be substantially identical except as to denomination and except as may otherwise be provided in or pursuant to the Board Resolution referred to above and (subject to Section 303) set forth in the Officers' Certificate referred to above or in any such indenture supplemental hereto. All Securities of any one series need not be issued at one time, and unless otherwise provided, a series may be reopened for issuances of additional Securities of such series. Unless otherwise specifically provided with respect to the Securities of a series, at the option of the Company, interest on the Securities of any series that bears interest may be paid by mailing a check to the address of the person entitled thereto as such address shall appear in the Security Register. If any of the terms of Securities of a series are established by action taken pursuant to a Board Resolution, a copy of an appropriate record of such action shall be certified by the Secretary or an Assistant Secretary of the Company and delivered to the Trustee at or prior to the delivery of the Officers' Certificate setting forth the terms of the Securities of such series. If all of the Securities of any series established by action taken pursuant to a Board Resolution are not to be issued at one time, it shall not be necessary to deliver a record of such action at the time of issuance of each Security of such series, but an appropriate record of such action shall be delivered at or before the time of issuance of the First Security of such series. 2. Denominations. The Securities of each series shall be issuable in registered form without coupons in each denominations as shall be specified as contemplated by Section 301. In the absence of any such provisions with respect to the Securities of any particular series, the Securities of such series shall be issuable in denominations of $1,000 and any integral multiple thereof. 3. Execution, Authentication, Delivery and Dating.
The Securities shall be executed on behalf of the Company by its Chairman of the Board, one of its Vice Chairman, its President, its Chief Financial Officer or one of its Vice Presidents, under its corporate seal reproduced thereon attested by its Secretary or one of its Assistant Secretaries. The signature of any of these officers on the Securities may be manual or facsimiles. Securities bearing the manual or facsimile signatures of individuals who were at any time the proper officers of the Company shall bind the Company, notwithstanding that such individuals or any of them have ceased to hold such offices prior to the authentication and delivery of such Securities or did not hold such offices a the date of such Securities. At any time and from time to time after the execution and delivery of this Indenture, the Company may deliver Securities of any series executed by the Company to the Trustee or the Authenticating Agent for authentication, together with a Company Order for the authentication and delivery of such Securities, and the Trustee or the Authenticating Agent in accordance with the Company Order shall authenticate and make available for delivery such Securities. If all of the Securities of any series are not to be issued at one time and if the Board Resolution or supplemental indenture establishing such series shall so permit, such Company Order may set forth procedures acceptable to the Trustee for the issuance of such Securities and determining the terms of particular Securities of such series, such as interest rate, maturity date, date of issuance and date from which interest shall accrue. In authenticating Securities of any series, and accepting the additional responsibilities under this Indenture in relation to such Securities, the Trustee or the Authenticating Agent, as the case may be, shall be entitled to receive, and (subject to Section 601) shall be fully protected in relying upon, an Opinion of Counsel stating, a. if the form of such Securities has been established by or pursuant to a Board Resolution as permitted by Section 201, that such form has been established in conformity with the provisions of this Indenture; b. if the terms of such Securities have been established by or pursuant to a Board Resolution as permitted by Section 301, that such terms have been established in conformity with the provisions of this Indenture; and c. that such Securities, when authenticated and delivered by the Trustee and issued by the Company
in the manner and subject to any conditions specified in such Opinion of Counsel, will constitute valid and legally binding obligations of the Company, enforceable in accordance with their terms, subject to bankruptcy, insolvency, fraudulent transfer, reorganization, moratorium and similar laws of general applicability relating to or affecting creditors' rights and to general equity principles and, if applicable, to provisions of law which may require that a judgment for money damages rendered by a court in the United States be expressed in Unites States dollars. If such forms or terms have been so established, the Trustee or the Authenticating Agent, as the case may be, shall not be required to authenticate such Securities if the issue of such Securities pursuant to this Indenture will affect the Trustee's or the Authenticating Agent's own rights, duties or immunities under the Securities and this Indenture or otherwise in a manner which is not reasonably acceptable to the Trustee or the Authenticating Agent. Notwithstanding the provisions of Section 301 and of the preceding paragraph, if all Securities of a series are not to be originally issued at one time, it shall not be necessary to deliver the Officers' Certificate otherwise required pursuant to Section 301 or the Company Order and Opinion of Counsel otherwise required pursuant to such preceding paragraph at or prior to the time of authentication of each Security of such series if such documents are delivered at or prior to the time of authentication upon original issuance of the first Security of such series to be issued. After the original issuance of the first Security of such series to be issued, any separate request by the Company that the Trustee authenticate Securities of such series for original issuance will be deemed to be a certification by the Company that it is in compliance with all conditions precedent provided for in this Indenture relating to the authentication and delivery of such Securities. Each Security shall be dated the date of its authentication. No Security shall be entitled to any benefit under this Indenture or be valid or obligatory for any purpose unless there appears on such Security a certificate of authentication substantially in the form provided for herein
executed by the Trustee or the Authenticating Agent by manual signature, and such certificate upon any Security shall be conclusive evidence, and the only evidence, that such Security has been duly authenticated and delivered hereunder and is entitled to the benefits of this Indenture. Notwithstanding the foregoing, if any Security shall have been authenticated and delivered hereunder but never issued and sold by the Company, and the Company shall deliver such Security to the Trustee for cancellation as provided in Section 309 together with a written statement (which need not comply with Section 102 and need not be accompanied by an Opinion of Counsel) stating that such Security has never been issued and sold by the Company, for all purposes of this Indenture such Security shall be deemed never to have been authenticated and delivered hereunder and shall never be entitled to the benefits of this Indenture. 4. Temporary Securities. Pending the preparation of definitive Securities of any series, the Company may execute, and upon Company Order the Trustee or the Authenticating Agent shall authenticate and deliver, temporary Securities which are printed, lithographed, typewritten, reproduced or otherwise produced, in any authorized denomination, substantially of the tenor of the definitive Securities in lieu of which they are issued and with such appropriate insertions, omissions, substitutions and other variations of the officers executing such Securities may determine, as evidenced by their execution of such Securities. If temporary Securities of any series are issued, the Company will cause definitive Securities of that series to be prepared without unreasonable delay. After the preparation of definitive Securities of such series, the temporary Securities of such series shall be exchangeable for definitive Securities of such series upon surrender of the temporary Securities of such series at the office or agency of the Company in a Place of Payment for that series, without charge to the Holder. Upon surrender for cancellation of any one or more temporary Securities of any series the Company shall execute, and the Trustee shall authenticate and make available for delivery, in exchange therefor a like principal amount of definitive Securities of the same series and tenor of authorized denominations. Until so exchanged the temporary Securities of any series shall in all respects be entitled to the same benefits under this Indenture as definitive Securities of such series. 5. Registration, Registration of Transfer and Exchange. The Company shall cause to be kept at the corporate trust office of the Security Registrar designated pursuant to this Section 305 a register (the register maintained in such office being herein sometimes referred to as
the "Security Register") in which, subject to such reasonable regulations as it may prescribe, the Company shall provide for the registration of Securities and of transfers of Securities. The Bank is hereby initially appointed "Security Registrar" for the purpose of registering Securities and transfers of Securities as herein provided. Upon surrender for registration of transfer of any Security of any series at the office or agency in a Place of Payment for that series, the Company shall execute, and the Trustee shall authenticate and make available for delivery, in the name of the designated transferee or transferees, one or more new Securities of the same series, of any authorized denominations and of a like tenor and aggregate principal amount. At the option of the Holder, Securities of any series may be exchanged for other Securities of the same series, of any authorized denominations and of a like tenor and aggregate principal amount, upon surrender of the Securities to be exchanged at such office or agency. Whenever any Securities are so surrendered for exchange, the Company shall execute, and the Trustee shall authenticate and make available for delivery, the Securities which the Holder making the exchange is entitled to receive. All Securities issued upon any registration of transfer or exchange of Securities shall be the valid obligations of the Company, evidencing the same debt, and entitled to the same benefits under this Indenture, as the Securities surrendered upon such registration of transfer or exchange. Every Security presented or surrendered for registration of transfer or for exchange shall (if so required by the Company or the Trustee) be duly endorsed, or be accompanied by a written instrument of transfer in form satisfactory to the Company and the Security Registrar duly executed, by the Holder thereof or his attorney duly authorized in writing. No service charge shall be made for any registration of transfer or exchange of Securities, but the Company may require payment of a sum sufficient to cover any tax or other governmental charge that may be imposed in connection with any registration of transfer or exchange of Securities, other than exchanges pursuant to Section 304, 906 or 1107 not involving any transfer. The Company shall not be required (i) to issue, register the transfer of or exchange any Security during a period beginning at the opening of business 15 days before any selection for redemption of Securities of like tenor and of the series of which such Security is a part and ending at the close of business on the earliest date on which the relevant notice of redemption is deemed to have been given to all Holders of Securities of such series to be redeemed, or (ii) to register the transfer of or exchange
any Security so selected for redemption in whole or in part, except the unredeemed portion of any Security being redeemed in part. Notwithstanding the foregoing, any Global Security representing a series of Securities shall be exchangeable pursuant to this Section 305 for Securities registered in the names of Persons other than the Depository or its nominee only if (i) subject to any other terms of the series applicable to such Global Security, such Depository notifies the Company that it is unwilling or unable to continue as Depository for such Global Security or if at any time such Depository ceases to be a clearing agency registered under the Securities Exchange Act of 1934, as amended, at a time when such Depository is required to be so registered to act as such Depository, (ii) the Company executes and delivers to the Trustee a Company Order that such Global Security shall be so exchangeable or (iii) there shall have occurred and be continuing an Event of Default or an event which, with the giving of notice or lapse of time, or both, would constitute an Event of Default with respect to the Securities. Any Global Security that is exchangeable pursuant to the preceding sentence shall be exchangeable for Securities registered in such names as such Depository shall direct. Notwithstanding any other provision in this Indenture, a Global Security may not be transferred except as a whole by the Depository with respect to such Global Security to a nominee of such Depository or by a nominee of such Depository to such Depository or another nominee of such Depository. Unless otherwise provided as contemplated by Section 301 with respect to any series of Securities evidenced in whole or in part by a Global Security, the Depository may not sell, assign, transfer or otherwise convey any beneficial interest in a Global Security evidencing all or part of the Securities of such series unless such beneficial interest is in an amount equal to an authorized denomination for Securities of such series. 6. Mutilated, Destroyed, Lost and Stolen Securities. If any mutilated Security is surrendered to the Trustee, the Company shall execute and the Trustee shall authenticate and deliver in exchange therefor a new Security of the same series and of like tenor and principal amount and bearing a number not contemporaneously outstanding. If there shall be delivered to the Company and the Trustee (i) evidence to their satisfaction of the destruction, loss or theft of any Security and (ii) such security or indemnify as may be required by them to save each of them and any agent of either of them harmless, then, in the absence of notice to the Company or the Trustee that such Security has been acquired by a bona fide purchaser, the Company shall execute and upon its request the Trustee shall authenticate and make available for delivery, in lieu of any such destroyed, lost or stolen Security, a new Security of the same
series and of like tenor and principal amount and bearing a number not contemporaneously outstanding. In case any such mutilated, destroyed, lost or stolen Security has become or is about to become due and payable, the Company in its discretion may, instead of issuing a new Security of the same series, pay such Security. Upon the issuance of any new Security under this Section, the Company may require the payment of a sum sufficient to cover any tax or other governmental charge that may be imposed in relation thereto and any other expenses (including the fees and expenses of the Trustee) connected therewith. Every new Security of any series issued pursuant to this Section in lieu of any destroyed, lost or stolen Security shall constitute an original additional contractual obligation of the Company, whether or not the destroyed, lost or stolen Security shall be at any time enforceable by anyone, and shall be entitled to all the benefits of this Indenture equally and proportionately with any and all other Securities of that series duly issued hereunder. The provisions of this Section are exclusive and shall preclude (to the extent lawful) all other rights and remedies with respect to the replacement or payment of mutilated, destroyed, lost or stolen Securities. 7. Payment of Interest; Interest Rights Preserved. Unless otherwise provided as contemplated by Section 301 with respect to any series of Securities, interest on any Security which is payable, and is punctually paid or duly provided for, on any Interest Payment Date shall be paid to the Person in whose name that Security (or one or more Predecessor Securities) is registered at the close of business on the Regular Record Date for such interest. Any interest on any Security of any series which is payable, but is not punctually paid or duly provided for, on any Interest Payment Date (herein called "Defaulted Interest") shall forthwith cease to be payable to the Holder on the relevant Regular Record Date by virtue of having been such Holder, and such Defaulted Interest may be paid by the Company, at its election in each case, as provided in Clause (1) or (2) below: 1. The Company may elect to make payment of any Defaulted Interest to the Person or Persons in whose names the Securities of such series (or their respective Predecessor Securities) are registered at the close of business on a Special Record Date for the payment of such Defaulted Interest, which shall be fixed in the following manner. The
Company shall notify the Trustee in writing of the amount of Defaulted Interest proposed to be paid on each Security of such series and the date of the proposed payment, and at the same time the Company shall deposit with the Trustee an amount of money equal to the aggregate amount proposed to be paid in respect of such Defaulted Interest or shall make arrangements satisfactory to the Trustee for such deposit prior to the date of the proposed payment, such money when deposited to be held in trust for the benefit of the Persons entitled to such Defaulted Interest as in this Clause provided. Thereupon the Trustee shall fix a Special Record Date for the payment of such Defaulted Interest which shall be not more than 15 days and not less than 10 days prior to the date of the proposed payment and not less than 10 days after the receipt by the Trustee of the notice of the proposed payment. The Trustee shall promptly notify the Company of such Special Record Date and, in the name and at the expense of the Company, shall cause notice of the proposed payment of such Defaulted Interest and the Special Record Date therefor to be mailed, first-class postage prepaid, to each Holder of Securities of such series at his address as it appears in the Security Register, not less than 10 days prior to such Special Record Date. Notice of the proposed payment of such Defaulted Interested and the Special Record Date therefor having been so mailed, such Defaulted Interest shall be paid to the Persons in whose names the Securities of such series (or their respective Predecessor Securities) are registered at the close of business on such Special Record Date and shall no longer be payable pursuant to the following Clause (2). 2. The Company may make payment of any Defaulted Interest on the Securities of any series in any other lawful manner not inconsistent with the requirements of any securities exchange on which such Securities may be listed, and upon such notice as may be required by such exchange, if, after notice given by the Company to the Trustee of the proposed payment pursuant to this Clause, such manner of payment shall be deemed practicable by the Trustee. Subject to the foregoing provisions of this Section, each Security delivered under this Indenture upon registration of transfer of or in exchange for or in lieu of any other Security shall carry the rights to interest accrued and unpaid, and to accrue, which were carried by such other Security. 8. Persons Deemed Owners.
Prior to due presentment of a Security for registration of transfer, the Company, the Trustee and any agent of the Company or the Trustee may treat the Person in whose name such Security is registered as the owner of such Security for the purpose of receiving payment of principal of (and premium, if any) and (subject to Section 307) interest on such Security and for all other purposes whatsoever, whether or not such Security be overdue, and neither the Company, the Trustee nor any agent of the Company or the Trustee shall be affected by notice to the contrary. Notwithstanding the foregoing, with respect to any Global Security, nothing herein shall prevent the Company, the Trustee, or any agent of the Company or the Trustee, from giving effect to any written certification, proxy or other authorization furnished by a Depository or impair, as between a Depository and holders of beneficial interests in any Global Security, the operation of customary practices governing the exercise of the rights of the Depositary as Holder of such Global Security. 9. Cancellation. All Securities surrendered for payment, redemption, registration of transfer or exchange or for credit against any sinking fund payment shall, if surrendered to any Person other than the Trustee, be delivered to the Trustee and shall be promptly cancelled by it. The Company may at any time deliver to the Trustee for cancellation any Securities previously authenticated and delivered hereunder which the Company may have acquired in any manner whatsoever, and may deliver to the Trustee (or to any other Person for delivery to the Trustee) for cancellation any Securities previously authenticated hereunder which the Company has not issued and sold, and all Securities so delivered shall be promptly cancelled by the Trustee. No Securities shall be authenticated in lieu of or in exchange for any Securities cancelled as provided in this Section, except as expressly permitted by this Indenture. All cancelled Securities held by the Trustee shall be destroyed by the Trustee and a certificate of destruction shall be delivered to the Company. 10. Computation of Interest. Except as otherwise specified as contemplated by Section 301 for Securities of any series, interest on the Securities of each series shall be computed on the basis of a 360-day year of twelve 30-day months. 4. Satisfaction and Discharge 1. Satisfaction and Discharge of Indenture.
This Indenture shall upon request by the Company cease to be of further effect (except as to any surviving rights of registration of transfer or exchange of Securities herein expressly provided for), and the Trustee, upon Company Request and at the expense of the Company, shall execute proper instruments acknowledging satisfaction and discharge of this Indenture, when 1. either A. all Securities theretofore authenticated and delivered (other than (i) Securities which have been destroyed, lost or stolen and which have been replaced or paid as provided in Section 306 and (ii) Securities for whose payment money has theretofore been deposited in trust or segregated and held in trust by the Company and thereafter repaid to the Company or discharged from such trust, as provided in Section 1003) have been delivered to the Trustee for cancellation; or B. all such Securities not theretofore delivered to the Trustee for cancellation i. have become due and payable, or ii. will become due and payable at their Stated Maturity within one year, or iii. are to be called for redemption within one year under arrangements satisfactory to the Trustee for the giving of notice of redemption by the Trustee in the name, and at the expenses of the Company, and the Company, in the case of (i), (ii) or (iii) above, has deposited or caused to be deposited with the Trustee as trust funds in trust for the purpose an amount sufficient to pay and discharge the entire indebtedness on such Securities not theretofore delivered to the Trustee for cancellation, for principal (and premium, if any) and interest to the date of such deposit (in the case of Securities which have become due and payable) or to the Stated Maturity or Redemption Date, as the case may be; 2. the Company has paid or caused to be paid all other sums payable hereunder by the Company; and 3. the Company has delivered to the Trustee an Officers' Certificate and an Opinion of Counsel, each stating that all conditions precedent herein provided for relating to the satisfaction and discharge of this Indenture have been complied with.
Notwithstanding the satisfaction and discharge of this Indenture, the obligations of the Company to the Trustee under Section 607, the obligations of the Trustee to any Authenticating Agent under Section 614 and, if money or U.S. Government Obligations shall have been deposited with the Trustee (or another trustee satisfying the conditions of Section 609) in accordance with Section 1302, the obligations of the Company to the Trustee (or other qualifying trustee) under the fourth paragraph of Section 1305, and, if money shall have been deposited with the Trustee pursuant to subclause (B) of clause (1) of this Section, the obligations of the Trustee under Section 402 and the last paragraph of Section 1003 shall survive. 2. Application of Trust Money. Subject to provisions of the last paragraph of Section 1003, all money deposited with the Trustee pursuant to Section 401 shall be held in trust and applied by it, in accordance with the provisions of the Securities and this Indenture, to the payment, either directly or through any Paying Agent (including the Company acting as its own Paying Agent) as the Trustee may determine, to the Persons entitled thereto, of the principal (and premium, if any) and interest, if any, for whose payment such money has been deposited with the Trustee; but such money need not be segregated from other funds except as required by law. 5. Remedies 1. Events of Default. "Event of Default", wherever used herein with respect to Securities of any series, means any one of the following events (whatever the reason for such Event of Default and whether it shall be voluntary or involuntary or be effected by operation of law or pursuant to any judgment, decree or order of any court or any order, rule or regulation of any administrative or governmental body): 1. default in the payment of interest, if any, upon any Security of that series when it becomes due and payable, and continuance of such default for a period of 30 days; or 2. default in the payment of the principal of (or premium, if any, on) any Security of that series at its Maturity; or 3. default in the deposit of any sinking fund payment, when and as due by the terms of a Security of that series and continuance of such default for a period of 5 days; or 4. default in the performance, or breach, of any covenant or warranty of the Company in this Indenture or any Security of that series (other than a covenant or warranty a default in
whose performance or whose breach is elsewhere in this Section specifically death with or which has expressly been included in this Indenture solely for the benefit of series of Securities other than that series), and continuance of such default or breach for a period of 60 days after there has been given, by registered or certified mail, to the Company by the Trustee or to the Company and the Trustee by the Holders of at least 25% in principal amount of the Outstanding Securities of that series a written notice specifying such default or breach and requiring it to be remedied and stating that such notice is a "Notice of Default" hereunder, or 5. a default under any bond, debenture, notice or other evidence of indebtedness for money borrowed by the Company (including a default with respect to Securities of any series other than that series) or under any mortgage, indenture or instrument under which there may be issued or by which there may be secured or evidenced any indebtedness for money borrowed by the Company (including this Indenture), whether such indebtedness now exists or shall hereafter be created, which default shall have resulted (i) in a failure to pay an aggregate principal amount exceeding $25,000,000 of such indebtedness for money borrowed at the later of final maturity or upon the expiration of any applicable period of grace with respect to such principal amount, or (ii) in such indebtedness for money borrowed in an aggregate principal amount exceeding $25,000,000 becoming or being declared due and payable prior to the date on which it would otherwise have become due and payable, without such indebtedness having been discharged, or such acceleration having been rescinded or annulled, within a period of 30 days after there shall have been given, by registered or certified mail, to the Company by the Trustee or to the Company and the Trustee by the Holders of at least 25% in principal amount of the Outstanding Securities of that series a written notice specifying such default and requiring the Company to cause such indebtedness to be discharged or cause such acceleration to be rescinded or annulled and stating that such notice is a "Notice of Default" hereunder; provided, however, that, subject to the provisions of Sections 601 and 602, the Trustee shall not be deemed to have knowledge of such default unless either (A) a Responsible Officer of the Trustee shall have actual knowledge of such default or (B) the Trustee shall have received written notice thereof from the Company, from any Holder, from the holder of any
such indebtedness for money borrowed or from the trustee under any such mortgage, indenture or other instrument; and provided, further, that any such default shall not be deemed to have occurred if and so long as the Company shall contest the validity thereof in good faith by appropriate proceedings; or 6. the entry by a court having jurisdiction in the premises of (A) a decree or order for relief in respect of the Company or the Bank in an involuntary case or proceeding under any applicable Federal or State bankruptcy, insolvency, reorganization or other similar law or (B) a decree or order appointing a custodian, receiver, liquidator, assignee, trustee, sequestrator or other similar official of the Company or the Bank or of all or substantially all of their respective property, or ordering the winding up or liquidation of their respective affairs, and the continuance of any such decree or order for relief or any such other decree or order unstayed and in effect for a period of 60 consecutive days; or 7. the commencement by the Company or the Bank of a voluntary case or proceeding under any applicable Federal or State bankruptcy, insolvency, reorganization or other similar law or the consent by either to the filing of such petition or to the appointment of or taking possession by a custodian, receiver, liquidator, assignee, trustee, sequestrator or similar official of the Company or the Bank or of all or substantially all of their respective property, or the making by either of an assignment for the benefit of creditors, or the admission by either in writing of its inability to pay its debts generally as they become due, or the taking of corporate action by the Company or the Bank in furtherance of any such action; or 8. any other Event of Default provided with respect to Securities of that series. Upon receipt by the Trustee of any Notice of Default pursuant to Section 501(4) or Section 501(5) with respect to Securities of a series all or part of which is represented by a Global Security, a record date shall be established for determining Holders of Outstanding Securities of such series entitled to join in such Notice of Default, which record date shall be at the close of business on the day the Trustee receives such Notice of Default. The Holders on such record date, or their duly designated proxies, and only such Persons, shall be entitled to join in such Notice of Default, whether or not such Holders remain Holders after such record date; provided, that unless Holders of at least 10% in principal amount of the Outstanding Securities of such series, or their proxies, shall have joined in
such Notice of Default prior to the date which is 90 days after such record date, such Notice of Default shall automatically and without further action by any Holder be canceled and of no further effect. Nothing in this paragraph shall prevent a Holder, or a proxy of a Holder, from giving, after expiration of such 90-day period, a new Notice of Default which is identical to a Notice of Default which has been canceled pursuant to the proviso to the preceding sentence, in which event a new record date shall be established pursuant to the provisions of this Section 501. 2. Acceleration of Maturity; Rescission and Annulment. If an Event of Default with respect to Securities of any series at the time Outstanding occurs and is continuing, then and in every such case the Trustee or the Holders of not less than 25% in principal amount of the Outstanding Securities of that series may declare the principal amount (or, if the Securities of that series are Original Issue Discount Securities, such portion of the principal amount as may be specified in the terms of that series) of all of the Securities of that series to be due and payable immediately, by a notice in writing to the Company (and to the Trustee if given by Holders), and upon any such declaration such principal amount (or specified amount) shall become immediately due and payable, except that no such declaration shall be required upon the occurrence of an Event of Default specified in Section 501(7). At any time after such a declaration of acceleration with respect to Securities of any series has been made and before a judgment or decree for payment of the money due has been obtained by the Trustee as hereinafter in this Article provided, the Holders of a majority in principal amount of the Outstanding Securities of that series, by written notice to the Company and the Trustee, may rescind and annul such declaration and its consequences, and any Event of Default giving rise to such declaration shall not be deemed to have occurred, if 1. the Company has paid or deposited with the Trustee a sum sufficient to pay A. all overdue interest on all Securities of that series, B. the principal of (and premium, if any, on) any Securities of that series which have become due otherwise than by such declaration of acceleration and interest thereon at the rate or rates prescribed therefor in such Securities, C. to the extent that payment of such interest is lawful, interest, if any, upon overdue interest
at the rate or rates prescribed therefor in such Securities, and D. all sums paid or advanced by the Trustee hereunder and the reasonable compensation, expenses, disbursements and advances of the Trustee, its agents and counsel; and 1. all Events of Default with respect to Securities of that series, other than the non-payment of the principal of Securities of that series which have become due solely by such declaration of acceleration, have been cured or waived as provided in Section 513 or otherwise remedied. No such rescission shall affect any subsequent default or impair any right consequent thereon. Upon receipt by the Trustee of any written notice declaring such an acceleration, or rescission and annulment thereof, with respect to Securities of a series all or part of which is represented by a Global Security, a record date shall be established for determining Holders of Outstanding Securities of such series entitled to join in such notice, which record date shall be at the close of business on the day the Trustee receives such notice. The Holders on such record date, or their duly designated proxies, and only such Persons, shall be entitled to join in such notice, whether or not such Holders remain Holders after such record date; provided, that unless such declaration of acceleration, or rescission and annulment, as the case may be, shall have become effective by virtue of the requisite percentage having joined in such notice prior to the day which is 90 days after such record date, such notice of declaration of acceleration, or rescission and annulment, as the case may be, shall automatically and without further action by any Holder be canceled and of no further effect. Nothing in this paragraph shall prevent a Holder, or a proxy of a Holder, from giving, after expiration of each 90-day period, a new written notice of declaration of acceleration, or rescission or annulment thereof, as the case may be, that is identical to a written notice which has been canceled pursuant to the proviso to the preceding sentence, in which event a new record date shall be established pursuant to the provisions of this Section 502. 1. Collection of Indebtedness and Suits for Enforcement by Trustee. The Company covenants that if: 1. default is made in the payment of any interest on any Security when such interest becomes due and payable and such default continues for a period of 30 days,
2. default is made in the payment of the principal of (or premium, if any, on) any Security at the Maturity thereof, or 3. default is made in the making or satisfaction of any sinking fund payment or analogous obligation when the same becomes due pursuant to the terms of any Security and such default continues for 5 days; the Company will, upon demand of the Trustee, pay to it, for the benefit of the Holders of such Securities, the whole amount then due and payable on such Securities for principal, including any sinking fund payment or analogous obligations (and premium, if any) and interest and, to the extent that the payment of such interest shall be legally enforceable, interest on any overdue principal including any sinking fund payment or analogous obligations (and premium, if any) and on any overdue interest, at the rate or rates prescribed therefor in such Securities, and, in addition thereto, such further amount as shall be sufficient to cover the costs and expenses of collection, including the reasonable compensation, expenses, disbursements and advances of the Trustee, its agents and counsel. If the Company fails to pay such amounts forthwith upon such demand, the Trustee, in its own name and as trustee of an express trust, may institute a judicial proceeding for the collection of the sums so due and unpaid, may prosecute such proceeding to judgment or final decree and may enforce the same against the Company or any other obligor upon such Securities and collect the moneys adjudged or decreed to be payable in the manner provided by law out of the property of the Company or any other obligor upon such Securities, wherever situated. If an Event of Default with respect to Securities of any series occurs and is continuing, the Trustee may in its discretion proceed to protect and enforce its rights and the rights of the Holders of Securities of such series by such appropriate judicial proceedings as the Trustee shall deem most effectual to protect and enforce any such rights, whether for the specific enforcement of any covenant or agreement in this Indenture or in aid of the exercise of any power granted herein, or to enforce any other proper remedy. 2. Trustee May File Proofs of Claim. In case of the pendency of any receivership, insolvency, liquidation, bankruptcy, reorganization, arrangement, adjustment, composition or other judicial proceeding relative to the Company or any other obligor upon the Securities or the property of the Company or of such other obligor or their creditors, the Trustee (irrespective of whether the principal of the Securities shall then be due and payable as therein expressed or by
declaration or otherwise and irrespective of whether the Trustee shall have made any demand on the Company for the payment of overdue principal or interest) shall be entitled and empowered, by intervention in such proceeding or otherwise, i. to file and prove a claim for the whole amount of principal (and premium, if any) and interest, if any, owing and unpaid in respect of the Securities of all series and to file such other papers or documents as may be necessary or advisable in order to have the claims of the Trustee (including any claim for the reasonable compensation, expenses, disbursements and advances of the Trustee, its agents and counsel) and of the Holders allowed in such judicial proceeding, and ii. to collect and receive any moneys or other property payable or deliverable on any such claims and to distribute the same; and any custodian, receiver, assignee, trustee, liquidator, sequestrator or other similar official in any such judicial proceeding is hereby authorized by each Holder to make such payments to the Trustee and, in the event that the Trustee shall consent to the making of such payments directly to the Holders, to pay to the Trustee any amount due it for the reasonable compensation, expenses, disbursements and advances of the Trustee, its agents and counsel, and any other amounts due the Trustee under Section 607. Nothing herein contained shall be deemed to authorize the Trustee to authorize or consent to or accept or adopt on behalf of any Holder any plan of reorganization, arrangement, adjustment or compensation affecting the Securities or the rights of any Holder thereof or to authorize the Trustee to vote in respect of the claim of any Holder in any such proceeding. 3. Trustee May Enforce Claims Without Possession of Securities.
All rights of action and claims under this Indenture or the Securities may be prosecuted and enforced by the Trustee without the possession of any of the Securities or the production thereof in any proceeding relating thereto, and any such proceeding instituted by the Trustee shall be brought in its own name and as trustee of an express trust, and any recovery of judgment shall, after provision for the payment of the reasonable compensation, expenses, disbursements and advances of the Trustee, its agents and counsel, be for the ratable benefit of the Holders of the Securities in respect of which such judgment has been recovered. 4. Application of Money Collected. Any money collected by the Trustee pursuant to this Article shall be applied in the following order, at the date or dates fixed by the Trustee and, in case of the distribution of such money on account of principal (or premium, if any) or interest, if any, upon presentation of the Securities and the notation thereon of the payment if only partially paid and upon surrender thereof if fully paid: First: To the payment of all amounts due the Trustee under Section 607; and Second: To the payment of the amounts then due and unpaid for principal of (and premium, if any) and interest, if any, on the Securities in respect of which or for the benefit of which such money has been collected, ratably, without preference or priority of any kind, according to the amounts due and payable on such Securities for principal (and premium, if any) and interest, if any, respectively. 5. Limitation on Suits. No Holder of any Security of any series shall have any right to institute any proceeding, judicial or otherwise, with respect to this Indenture, or for the appointment of a receiver or trustee, or for any other remedy hereunder, unless 1. such Holder has previously given written notice to the Trustee of a continuing Event of Default or an event which, with the giving of notice or lapse of time, or both, would constitute an Event of Default with respect to the Securities of that series; 2. the Holders of not less than 25% in principal amount of the Outstanding Securities of that series shall have made written request to the Trustee to institute proceedings in respect of such Event of Default in its own name as Trustee hereunder;
3. such Holder or Holders have offered to the Trustee reasonable indemnity against the costs, expenses and liabilities to be incurred in compliance with such request; 4. the Trustee for 60 days after its receipt of such notice, request and offer of indemnity has failed to institute any such proceeding; and 5. no direction inconsistent with such written request has been given to the Trustee during such 60-day period by the Holders of a majority in principal amount of the Outstanding Securities of that series; it being understood and intended that no one or more of such Holders shall have any right in any manner whatever by virtue of, or by availing of, any provision of this Indenture to affect, disturb or prejudice the rights of any other of such Holders, or to obtain or to seek to obtain priority or preference over any other of such Holders or to enforce any right under this Indenture, except in the manner herein provided and for the equal and ratable benefit of all of such Holders. 6. Unconditional Right of Holders to Receive Principal, Premium and Interest. Notwithstanding any other provision in this Indenture, the Holder of any Security shall have the right, which is absolute and unconditional, to receive payment of the principal of (and premium, if any) and (subject to Section 307) interest, if any, on such Security on the Stated Maturity or Maturities expressed in such Security (or, in the case of redemption, on the Redemption Date) and to institute suit for the enforcement of any such payment, and such rights shall not be impaired without the consent of such Holder. 7. Restoration of Rights and Remedies. If the Trustee or any Holder has instituted any proceeding to enforce any right or remedy under this Indenture and such proceeding has been discontinued or abandoned for any reason, or has been determined adversely to the Trustee or to such Holder, then and in every such case, subject to any determination in such proceeding, the Company, the Trustee and the Holders shall be restored severally and respectively to their former positions hereunder and thereafter all rights and remedies of the Trustee and the Holders shall continue as though no such proceeding had been instituted. 8. Rights and Remedies Cumulative.
Except as otherwise provided with respect to the replacement or payment of mutilated, destroyed, lost or stolen Securities in the last paragraph of Section 306, no right or remedy herein conferred upon or reserved to the Trustee or to the Holders is intended to be exclusive of any other right or remedy, and every right and remedy shall, to the extent permitted by law, be cumulative and in addition to every other right and remedy given hereunder or now or hereafter existing at law or in equity or otherwise. The assertion or employment of any right or remedy hereunder, or otherwise, shall not prevent the concurrent assertion or employment of any other appropriate right or remedy. 9. Delay or Omission Not Waiver. No delay or omission of the Trustee or of any Holder of any Securities to exercise any right or remedy accruing upon any Event of Default shall impair any such right or remedy or constitute a waiver of any such Event of Default or an acquiescence therein. Every right and remedy given by this Article or by law to the Trustee or to the Holders may be exercised from time to time, and as often as may be deemed expedient, by the Trustee or by the Holders, as the case may be. 10. Control by Holders. The Holders of a majority in principal amount of the Outstanding Securities of any series shall have the right to direct the time, method and place of conducting any proceeding for any remedy available to the Trustee, or exercising any trust or power conferred on the Trustee, with respect to the Securities of such series, provided that 1. such direction shall not be in conflict with any rule of law or with this Indenture, and 2. the Trustee may take any other action deemed proper by the Trustee which is not inconsistent with such direction. Upon receipt by the Trustee of any written notice directing the time, method or place of conducting any such proceeding or exercising any such trust or power with respect to Securities of a series all or part of which is represented by a Global Security, a record date shall be established for determining Holders of Outstanding Securities of such series entitled to join in such notice, which record date shall be at the close of business on the day the Trustee receives such notice. The Holders on such record date, or their duly designated proxies, and only such Persons, shall be entitled to join in such notice, whether or not such Holders remain Holders after such record date; provided, that unless Holders of a majority in principal amount of the Outstanding Securities of such series shall have joined in such notice prior to the day which is 90 days after such record date, such
notice shall automatically and without further action by any Holder be canceled and of no further effect. Nothing in this paragraph shall prevent a Holder, or a proxy of a Holder, from giving, after expiration of such 90-day period, a new notice identical to a notice which has been canceled pursuant to the proviso to the preceding sentence, in which event a new record date shall be established pursuant to the provisions of this Section 512. 11. Waiver of Past Defaults. The Holders of not less than a majority in principal amount of the Outstanding Securities of any series may on behalf of the Holders of all the Securities of such series waive any past default hereunder with respect to such series and its consequences, except a default 1. in the payment of the principal of (or premium, if any) or interest, if any, on any Security of such series, or 2. in respect of a covenant or provision hereof which under Article Nine cannot be modified or amended without the consent of the Holder of each Outstanding Security of such series affected. The Company may, but shall not be obligated to, fix a record date for the purpose of determining the Persons entitled to waive any past default hereunder. If a record date is fixed, the Holders on such record date, or their duly designated proxies, and only such Person, shall be entitled to waive any default hereunder, whether or not such Holders remain Holders after such record date; provided, that unless such majority in principal amount shall have waived such default prior to the date which is 90 days after such record date, any such waiver of such default previously given shall automatically and without further action by any Holder be canceled and of no further effect. Upon any such waiver, such default shall cease to exist, and any Event of Default arising therefrom shall be deemed to have been cured, for every purpose of this Indenture; but no such waiver shall extend to any subsequent or other default or impair any right consequent thereon. 12. Undertaking for Costs. All parties to this Indenture agree, and each Holder of any Security by his acceptance thereof shall be deemed to have agreed, that any court may in its discretion require, in any suit for the enforcement of any right or remedy under this Indenture, or in any suit against the Trustee for any action taken, suffered or omitted by it as Trustee, the filing by any party litigant in such suit of an undertaking to pay the costs of such suit, and that such court may in its discretion assess reasonable costs, including reasonable attorneys'
fees, against any party litigant in such suit, having due regard to the merits and good faith of the claims or defenses made by such party litigant; but the provisions of this Section shall not apply to any suit instituted by the Company, to any suit instituted by the Trustee, to any suit instituted by any Holder, or group of Holders, holding in the aggregate more than 10% in principal amount of the Outstanding Securities of any series, or to any suit instituted by any Holder for the enforcement of the payment of the principal of (or premium, if any) or interest, if any, on any Security on or after the Stated Maturity or Maturities expressed in such Security (or, in the case or redemption, on or after the Redemption Date). 1. The Trustee 1. Certain Duties and Responsibilities. a. Except during the continuance of an Event of Default, 1. the Trustee undertakes to perform such duties and only such duties as are specifically set forth in this Indenture, and no implied covenants or obligations shall be read into this Indenture against the Trustee; and 2. in the absence of bad faith on its part, the Trustee may conclusively rely, as to the truth of the statements and the correctness of the opinions expressed therein, upon certificates or opinions furnished to the Trustee and conforming to the requirements of this Indenture; but in the case of any such certificates or opinions which by any provision hereof are specifically required to be furnished to the Trustee, the Trustee shall be under a duty to examine the same to determine whether or not they conform to the requirements of this Indenture. b. In case an Event of Default has occurred and is continuing, the Trustee shall exercise such of the rights and powers vested in it by this Indenture, and use the same degree of care and skill in their exercise, as a prudent man would exercise or use under the circumstances in the conduct of his own affairs. c. No provision of this Indenture shall be construed to relieve the Trustee from liability for its own negligent action, its own negligent failure to act, or its own wilful misconduct, except that 1. this Subsection shall not be construed to limit the effect of Subsection (a) of this Section; 2. the Trustee shall not be liable for any error of judgment made in good faith by a Responsible Officer, unless it shall be proved that the Trustee was negligent in ascertaining the pertinent facts; 3. the Trustee shall not be liable with respect to any action taken or omitted to be taken by it in good faith in accordance with the direction of the Holders of a majority
in principal amount of the Outstanding Securities of any series, determined as provided in Section 512, relating to the time, method and place of conducting any proceeding for any remedy available to the Trustee, or exercising any trust or power conferred upon the Trustee, under this Indenture with respect to the Securities of such series; and 4. no provision of this Indenture shall require the Trustee to expend or risk its own funds or otherwise incur any financial liability in the performance of any of its duties hereunder, or in the exercise of any of its rights or powers, if it shall have reasonable grounds for believing that repayment of such funds or adequate indemnity against such risk or liability is not reasonably assured to it. d. Whether or not therein expressly so provided, every provision of this Indenture relating to the conduct or affecting the liability of or affording protection to the Trustee shall be subject to the provisions of this Section. 2. Notice of Defaults. Within 90 days after the occurrence of any default hereunder known to the Trustee with respect to the Securities of any series, the Trustee shall transmit by mail to all Holders of Securities of such series, as their names and addresses appear in the Security Register, notice of such default hereunder, unless such default shall have been cured or waived; provided, however, that, except in the case of a default in the payment of the principal of (or premium, if any) or interest on any Security of such series or in the payment of any sinking fund instalment with respect to Securities of such series, the Trustee shall be protected in the withholding such notice if and so long as the board of directors, the executive committee or a trust committee of directors or Responsible Officers of the Trustee in good faith determine that withholding of such notice is in the interest of the Holders of Securities of such series; and provided, further, that in the case of any default of the character specified in Section 501(4) with respect to Securities of such series, no such notice to Holders shall be given until at least 60 days after the occurrence thereof. For the purpose of this Section, the term "default" means any event which is, or after notice or lapse of time or both would become, an Event of Default with respect to Securities of such series. 3. Certain Rights of Trustee. Subject to the provisions of Section 601: a. the Trustee may rely and shall be protected in acting or refraining from acting upon any resolution, certificate, statement, instrument, opinion, report, notice, request, direction, consent, order, bond,
debenture, note, other evidence of indebtedness or other paper or document believed by it to be genuine and to have been signed or presented by the proper party or parties; b. any request or direction of the Company mentioned herein shall be sufficiently evidenced by a Company Request or Company Order and any resolution of the Board of Directors may be sufficiently evidenced by a Board Resolution; c. whenever in the administration of this Indenture the Trustee shall deem it desirable that a matter be proved or established prior to taking, suffering or omitting any action hereunder, the Trustee (unless other evidence be herein specifically prescribed) may, in the absence of bad faith on its part, rely upon an Officers' Certificate; d. the Trustee may consult with counsel and the written advice of such counsel or any Opinion of Counsel shall be full and complete authorization and protection in respect of any action taken, suffered or omitted by it hereunder in good faith and in reliance thereon; e. the Trustee shall be under no obligation to exercise any of the rights or powers vested in it by this Indenture at the request or direction of any of the Holders pursuant to this Indenture, unless such Holders shall have offered to the Trustee reasonable security or indemnity against the costs, expenses and liabilities which might be incurred by it in compliance with such request or direction; f. the Trustee shall not be bound to make any investigation into the facts or matters stated in any resolution, certificate, statement, instrument, opinion, report, notice, request, direction, consent, order, bond, debenture, note, other evidence of indebtedness or other paper or document, but the Trustee, in its discretion, may make such further inquiry or investigation into such facts or matters as it may see fit, and, if the Trustee shall determine to make such further inquiry or investigation, it shall be entitled to examine the books, records and premises of the Company, personally or by agent or attorney; and g. the Trustee may execute any of the trusts or powers hereunder or perform any duties hereunder either directly or by or through agents or attorneys and the Trustee shall not be responsible for any misconduct or negligence on the part of any agent or attorney appointed with due care by it hereunder. 4. Not Responsible for Recitals or Issuance of Securities. The recitals contained herein and in the Securities, except the Trustee's certificates of authentication, shall be taken as the statements of the Company, and the Trustee or any Authenticating Agent assumes no responsibility for their correctness. The Trustee makes no representations as to the validity or sufficiency of this Indenture or of the Securities. The
Trustee or any Authenticating Agent shall not be accountable for the use or application by the Company of Securities or the proceeds thereof. 5. May Hold Securities. The Trustee, any Authenticating Agent, any Paying Agent, any Security Registrar or any other agent of the Company, in its individual or any other capacity, may become the owner or pledgee of Securities and, subject to Sections 608 and 613, may otherwise deal with the Company with the same rights it would have if it were not Trustee, Authenticating Agent, Paying Agent, Security Registrar or such other agent. 6. Money Held in Trust. Money held by the Trustee in trust hereunder need not be segregated from other funds except to the extent required by law. The Trustee shall be under no liability for interest on any money received by it hereunder except as otherwise agreed with the Company. 7. Compensation and Reimbursement. The Company agrees 1. to pay to the Trustee from time to time reasonable compensation for all services rendered by it hereunder (which compensation shall not be limited by any provision of law in regard to the compensation of a trustee of an express trust); 2. except as otherwise expressly provided herein, to reimburse the Trustee upon its request for all reasonable expenses, disbursements and advances incurred or made by the Trustee in accordance with any provision of this Indenture (including the reasonable compensation and the expenses and disbursements of its agents and counsel), except any such expense, disbursement or advance as may be attributable to its negligence or bad faith; and 3. to indemnify the Trustee for, and to hold it harmless against, any loss, liability or expense incurred without negligence or bad faith on its part, arising out of or in connection with the acceptance or administration of the trust or trusts hereunder, including the costs and expenses of defending itself against any claim or liability in connection with the exercise or performance of any of its powers or duties hereunder. 8. Disqualifications; Conflicting Interests.
a. If the Trustee has or shall acquire any conflicting interest, as defined in this Section, with respect to the Securities of any series, it shall, within 90 days after ascertaining that it has such conflicting interest, either eliminate such conflicting interest or resign with respect to the Securities of that series in the manner and with the effect hereinafter specified in this Article. b. In the event that the Trustee shall fail to comply with the provisions of Subsection (a) of this Section with respect to the Securities of any series, the Trustee shall, within 10 days after the expiration of such 90-day period, transmit by mail to all Holders of Securities of that series, as their names and addresses appear in the Security Register, notice of such failure. c. For the purposes of this Section, the Trustee shall be deemed to have a conflicting interest with respect to the Securities of any series if 1. the Trustee is trustee under this Indenture with respect to the Outstanding Securities of any series other than that series or is trustee under another indenture under which any other securities, or certificates of interest or participation in any other securities, of the Company are outstanding, unless such other indenture is a collateral trust indenture under which the only collateral consists of Securities issued under this Indenture, provided that there shall be excluded from the operation of this paragraph this Indenture with respect to the Securities of any series other than that series, the Indenture dated as of November 1, 1982, as supplemented, between the Company and the Trustee, under which the Company's Medium Term Notes at various rates and with various maturity dates, Step-Down Floating Rate Notes due 1990, 9-1/2% Notes due 1991, and 9.55% Senior Notes due 1993 are outstanding as of the date hereof or any other indenture or indentures under which other securities, or certificates of interest or participation in other securities, of the Company are outstanding, if i. this Indenture and such other indenture or indentures are wholly unsecured and such other indenture or indentures are hereafter qualified under the Trust Indenture Act, unless the Commission shall have found and declared by order pursuant to Section 305(b) or Section 307(c) of the Trust Indenture Act that differences exist between the provisions of this Indenture with respect to Securities of that series and one or more other series or the provisions of such other indenture or indentures which are so likely to involve a
material conflict of interest as to make it necessary in the public interest or for the protection of investors to disqualify the Trustee from acting as such under this Indenture with respect to the Securities of that series and such other series or under such other indenture or indentures, or ii. the Company shall have sustained the burden of proving, on application to the Commission and after opportunity for hearing thereon, that trusteeship under this Indenture with respect to the Securities of that series and such other series or such other indenture or indentures is not so likely to involve a material conflict of interest as to make it necessary in the public interest or for the protection of investors to disqualify the Trustee from acting as such under this Indenture with respect to the Securities of that series and such other series or under such other indenture or indentures; 2. the Trustee or any of its directors or executive officers is an obligor upon the Securities or an underwriter for the Company; 3. the Trustee directly or indirectly controls or is directly or indirectly controlled by or is under direct or indirect common control with the Company or an underwriter for the Company; 4. the Trustee or any of its directors or executive officers is a director, officer, partner, employee, appointee or representative of the Company, or of an underwriter (other than the Trustee itself) for the Company who is currently engaged in the business of underwriting, except that (i) one individual may be a director or an executive officer, or both, of the Trustee and a director or an executive officer, or both, of the Company but may not be at the same time an executive officer of both the Trustee and the Company; (ii) if and so long as the number of directors of the Trustee in office is more than nine, one additional individual may be a director or an executive officer, or both, of the Trustee and a director of the Company; and (iii) the Trustee may be designated by the Company or by any underwriter for the Company to act in the capacity of transfer agent, registrar, custodian, paying agent, fiscal agent, escrow agent or depositary, or in any other similar capacity, or, subject to
the provisions of paragraph (1) of this Subsection, to act as trustee, whether under an indenture or otherwise; 5. 10% or more of the voting securities of the Trustee is beneficially owned either by the Company or by any director, partner or executive officer thereof, or 20% or more of such voting securities is beneficially owned, collectively, by any two or more of such persons; or 10% or more of the voting securities of the Trustee is beneficially owned either by an underwriter for the Company or by any director, partner or executive officer thereof, or is beneficially owned, collectively, by any two or more such persons; 6. the Trustee is the beneficial owner of, or holds as collateral security for an obligation which is in default (as hereinafter in this Subsection defined), (i) 5% or more of the voting securities, or 10% or more of any other class of security, of the Company not including the Securities issued under this Indenture and securities issued under any other indenture under which the Trustee is also trustee, or (ii) 10% or more of any class of security of an underwriter for the Company; 7. the Trustee is the beneficial owner of, or holds as collateral security for an obligation which is in default (as hereinafter in this Subsection defined), 5% or more of the voting securities of any person who, to the knowledge of the Trustee, owns 10% or more of the voting securities of, or controls directly or indirectly or is under direct or indirect common control with, the Company; 8. the Trustee is the beneficial owner of, or holds as collateral security for an obligation which is in default (as hereinafter in this Subsection defined), 10% or more of any class of security of any person who, to the knowledge of the Trustee, owns 50% or more of the voting securities of the Company; or 9. the Trustee owns, on May 15 in any calendar year, in the capacity of executor, administrator, testamentary or inter vivos trustee, guardian, committee or conservator, or in any other similar capacity, an aggregate of 25% or more of the voting securities, or of any class of security, of any person, the beneficial ownership of a specified percentage of which would have constituted a conflicting interest under paragraph (6), (7) or (8) of this Subsection. As to any such securities of which the Trustee acquired ownership through becoming executor, administrator or testamentary trustee of an estate which included them, the provisions of the preceding sentence shall not apply, for a period of two years from the date of such acquisition, to the extent that
such securities included in such estate do not exceed 25% of such voting securities or 25% of any such class of security. Promptly after May 15 in each calendar year, the Trustee shall make a check of its holdings of such securities in any of the above-mentioned capacities as of such May 15. If the Company fails to make payment in full of the principal of (or premium, if any) or interest on any of the Securities when and as the same becomes due and payable, and such failure continues for 30 days thereafter, the Trustee shall make a prompt check of its holdings of such securities in any of the above-mentioned capacities as of the date of the expiration of such 30-day period, and after such date, notwithstanding the foregoing provisions of this paragraph, all such securities so held by the Trustee, with sole or joint control over such securities vested in it, shall, but only so long as such failure shall continue, be considered as though beneficially owned by the Trustee for the purposes of paragraphs (6), (7) and (8) of this Subsection. The specification of percentages in paragraphs (5) to (9), inclusive, of this Subsection shall not be construed as indicating that the ownership of such percentages of the securities of a person is or is not necessary or sufficient to constitute direct or indirect control for the purposes of paragraph (3) or (7) of this Subsection. For the purposes of paragraphs (6), (7), (8) and (9) of this Subsection only, (i) the terms "security" and "securities" shall include only such securities as are generally known as corporate securities, but shall not include any note or other evidence of indebtedness issued to evidence an obligation to repay moneys lent to a person by one or more banks, trust companies or banking firms, or any certificate of interest or participation in any such note or evidence of indebtedness; (ii) an obligation shall be deemed to be "in default" when a default in payment of principal shall have continued for 30 days or more and shall not have been cured; and (iii) the Trustee shall not be deemed to be the owner or holder of (A) any security which it holds as collateral security, as trustee or otherwise, for an obligation which is not in default as defined in clause (ii) above, or (B) any security which it holds as collateral security under this Indenture, irrespective of any default hereunder, or (C) any security which it holds as agent for collection, or as custodian, escrow agent or depositary, or in any similar representative capacity. d. For the purposes of this Section:
1. The term "underwriter", when used with reference to the Company, means every person who, within three years prior to the time as of which the determination is made, has purchased from the Company with a view to, or has offered or sold for the Company in connection with, the distribution of any security of the Company outstanding at such time, or has participated or has had a direct or indirect participation in any such undertaking, or has participated or has had a participation in the direct or indirect underwriting of any such undertaking, but such term shall not include a person whose interest was limited to a commission from an underwriter or dealer not in excess of the usual and customary distributors' or sellers' commission. 2. The term "director" means any director of a corporation or any individual performing similar functions with respect to any organization, whether incorporated or unincorporated. 3. The term "person" means an individual, a corporation, a partnership, an association, a joint-stock company, a trust, an unincorporated organization or a government or political subdivision thereof. As used in this paragraph, the term "trust" shall include only a trust where the interest or interests of the beneficiary or beneficiaries are evidenced by a security. 4. The term "voting security" means any security presently entitling the owner or holder thereof to vote in the direction or management of the affairs of a person, or any security issued under or pursuant to any trust, agreement or arrangement whereby a trustee or trustees or agent or agents for the owner or holder of such security are presently entitled to vote in the direction or management of the affairs of a person. 5. The term "Company" means any obligor upon the Securities. 6. The term "executive officer" means the president, every vice president, every trust officer, the cashier, the secretary and the treasurer of a corporation, and any individual customarily performing similar functions with respect to any organization whether incorporated or unincorporated, but shall not include the chairman of the board of directors. e. The percentages of voting securities and other securities specified in this Section shall be calculated in accordance with the following provisions: 1. A specified percentage of the voting securities of the Trustee, the Company or any other person referred to in this Section (each of whom is referred to as a "person" in this paragraph) means such amount of the outstanding
voting securities of such person as entitles the holder or holders thereof to cast such specified percentage of the aggregate votes which the holders of all the outstanding voting securities of such person are entitled to cast in the direction or management of the affairs of such person. 2. A specified percentage of a class of securities of a person means such percentage of the aggregate amount of securities of the class outstanding. 3. The term "amount," when used in regard to securities, means the principal amount if relating to evidences of indebtedness, the number of shares if relating to capital shares and the number of units if relating to any other kind of security. 4. The term "outstanding" means issued and not held by or for the account of the issuer. The following securities shall not be deemed outstanding within the meaning of this definition: i. securities of an issuer held in a sinking fund relating to securities of the issuer of the same class; ii. securities of an issuer held in a sinking fund relating to another class of securities of the issuer, if the obligation evidenced by such other class of securities is not in default as to principal or interest or otherwise; iii. securities pledged by the issuer thereof as security for an obligation of the issuer not in default as to principal or interest or otherwise; and iv. securities held in escrow if placed in escrow by the issuer thereof; provided, however, that any voting securities of an issuer shall be deemed outstanding if any person other than the issuer is entitled to exercise the voting rights thereof. 5. A security shall be deemed to be of the same class as another security if both securities confer upon the holder or holders thereof substantially the same rights and privileges; provided, however, that, in the case of secured evidences of indebtedness, all of which are issued under a single indenture, differences in the interest rates or maturity dates of various series thereof shall not be deemed sufficient to constitute such series different classes and provided, further, that, in the case of unsecured evidences of indebtedness, differences in the interest rates or maturity
dates thereof shall not be deemed sufficient to constitute them securities of different classes, whether or not they are issued under a single indenture. 9. Corporate Trustee Required; Eligibility. There shall at all times be a Trustee hereunder which shall be a corporation organized and doing business under the laws of the United States of America, any State thereof or the District of Columbia, authorized under such laws to exercise corporate trust powers, having a combined capital and surplus of a least $50,000,000 subject to supervision or examination by Federal or State authority and having its Corporate Trust Office in the Borough of Manhattan, The City of New York. If such corporation publishes reports of condition at least annually, pursuant to law or to the requirements of said supervising or examining authority, then for the purposes of this Section, the combined capital and surplus of such corporation shall be deemed to be its combined capital and surplus as set forth in its most recent report of condition so published. If at any time the Trustee shall cease to be eligible in accordance with the provisions of this Section, it shall resign immediately in the manner and with the effect hereinafter specified in this Article. 10. Resignation and Removal; Appointment of Successor. a. No resignation or removal of the Trustee and no appointment of a successor Trustee pursuant to this Article shall become effective until the acceptance of appointment by the successor Trustee in accordance with the applicable requirements of Section 611. b. The Trustee may resign at any time with respect to the Securities of one or more series by giving written notice thereof to the Company. If the instrument of acceptance by a successor Trustee required by Section 611 shall not have been delivered to the Trustee within 30 days after the giving of such notice of resignation, the resigning Trustee may petition any court of competent jurisdiction for the appointment of a successor Trustee with respect to the Securities of such series. c. The Trustee may be removed at any time with respect to the Securities of any series by Act of the Holders of a majority in principal amount of the Outstanding Securities of such series, delivered to the Trustee and to the Company. d. If at any time: 1. the Trustee shall fail to comply with Section 608(a) after written request therefor by the Company or by any Holder who has been a bona fide Holder of a Security for at least six months, or 2. the Trustee shall cease to be eligible under Section 609 and shall fail to resign after written request therefor by the Company or by any such Holder, or
3. the Trustee shall become incapable of acting or shall be adjudged a bankrupt or insolvent or a receiver of the Trustee or of its property shall be appointed or any public officer shall take charge or control of the Trustee or of its property or affairs for the purpose of rehabilitation, conservation or liquidation, then, in any such case, (i) the Company by a Board Resolution may remove the Trustee with respect to all securities, or (ii) subject to Section 514, any Holder who has been a bona fide Holder of a Security for at least six months may, on behalf of himself and all others similarly situated, petition any court of competent jurisdiction for the removal of the Trustee with respect to all Securities and the appointment of a successor Trustee or Trustees. e. If the Trustee shall resign, be removed or become incapable of acting, or if a vacancy shall occur in the office of Trustee for any cause, with respect to the Securities of one or more series, the Company, by a Board Resolution, shall promptly appoint a successor Trustee or Trustees with respect to the Securities of that or those series (it being understood that any such successor Trustee may be appointed with respect to the Securities of one or more or all of such series and that at any time there shall be only one Trustee with respect to the Securities of any particular series) and shall comply with the applicable requirements of Section 611. If, within one year after such resignation, removal or incapability, or the occurrence of such vacancy, a successor Trustee with respect to the Securities of any series shall be appointed by Act of the Holders of a majority in principal amount of the Outstanding Securities of such series delivered to the Company and the retiring Trustee, the successor Trustee so appointed shall, forthwith upon its acceptance of such appointment in accordance with the applicable requirements of Section 611, become the successor Trustee with respect to the Securities of such series and to that extent supersede the successor Trustee appointed by the Company. If no successor Trustee with respect to the Securities of any Series shall have been so appointed by the Company or the Holders and accepted appointment in the manner required by Section 611, any Holder who has been a bona fide Holder of a Security of such series for at least six months may, on behalf of himself and all others similarly situated, petition any court of competent jurisdiction for the appointment of a successor Trustee with respect to the Securities of such series. f. The Company shall give notice of each resignation and each removal of the Trustee with respect to the Securities of any series and each appointment of a successor Trustee with respect to the
Securities of any series by mailing written notice of such event by first-class mail, postage prepaid, to all Holders of Securities of such series as their names and addresses appear in the Security Register. Each notice shall include the name of the successor Trustee with respect to the Securities of such series and the address of its Corporate Trust Office. 11. Acceptance of Appointment by Successor. a. In case of the appointment hereunder of a successor Trustee with respect to all Securities, every such successor Trustee so appointed shall execute, acknowledge and deliver to the Company and to the retiring Trustee an instrument accepting such appointment, and thereupon the resignation or removal of the retiring Trustee shall become effective and such successor Trustee, without any further act, deed or conveyance, shall become vested with all the rights, powers, trusts and duties of the retiring Trustee; but, on the request of the Company or the successor Trustee, such retiring Trustee shall, upon payment of its charges, execute and deliver an instrument transferring to such successor Trustee all the rights, powers and trusts of the retiring Trustee and shall duly assign, transfer and deliver to such successor Trustee all property and money held by such retiring Trustee hereunder. b. In case of the appointment hereunder of a successor Trustee with respect to the Securities of one or more (but not all) series, the Company, the retiring Trustee and each successor Trustee with respect to the Securities of one or more series shall execute and deliver an indenture supplemental hereto wherein each successor Trustee shall accept such appointment and which (1) shall contain such provisions as shall be necessary or desirable to transfer and confirm to, and to vest in, each successor Trustee all the rights, powers, trusts and duties of the retiring Trustee with respect to the Securities of that or those series to which the appointment of such successor Trustee relates, (2) if the retiring Trustee is not retiring with respect to all Securities, shall contain such provisions as shall be deemed necessary or desirable to confirm that all the rights, powers, trusts and duties of the retiring Trustee with respect to the Securities of that or those series as to which the retiring Trustee is not retiring shall continue to be vested in the retiring Trustee, and (3) shall add to or change any of the provisions of this Indenture as shall be necessary to provide for or facilitate the administration of the trusts hereunder by more than one Trustee, it being understood that nothing herein or in such supplemental indenture shall constitute such Trustees cotrustees of the same trust and that each such Trustee shall be trustee of a trust or trusts hereunder separate and apart from any trust or trusts hereunder administered by any other such Trustee; and upon the execution and delivery of such supplemental indenture the resignation or removal of the retiring
Trustee shall become effective to the extent provided therein and each such successor Trustee, without any further act, deed or conveyance, shall become vested with all the rights, powers, trusts and duties of the retiring Trustee with respect to the Securities of that or those series to which the appointment of such successor Trustee relates; but, on request of the Company or any successor Trustee, such retiring Trustee shall duly assign, transfer and deliver to such successor Trustee all property and money held by such retiring Trustee hereunder with respect to the Securities of that or those series to which the appointment of such successor Trustee relates. c. Upon request of any such successor Trustee, the Company shall execute any and all instruments for more fully and certainly vesting in and confirming to such successor Trustee all such rights, powers and trusts referred to in paragraphs (a) and (b) of this Section, as the case may be. d. No successor Trustee shall accept its appointment unless at the time of such acceptance such successor Trustee shall be qualified and eligible under this Article. 12. Merger, Conversion, Consolidation or Succession to Business. Any corporation into which the Trustee may be merged or converted or with which it may be consolidated, or any corporation resulting from any merger, conversion or consolidation to which the Trustee shall be a party, or any corporation succeeding to all or substantially all the corporate trust business of the Trustee, shall be the successor of the Trustee hereunder, provided such corporation shall be otherwise qualified and eligible under this Article, without the execution or filing of any paper or any further act on the part of any of the parties hereto. In case any Securities shall have been authenticated, but not delivered, by the Trustee then in office, any successor by merger, conversion or consolidation to such authenticating Trustee may adopt such authentication and deliver the Securities so authenticated with the same effect as if such successor Trustee had itself authenticated such Securities. 13. Preferential Collection of Claims Against Company. a. Subject to Subsection (b) of this Section, if the Trustee shall be or shall become a creditor, directly or indirectly, secured or unsecured, of the Company within four months prior to a default, as defined in Subsection (c) of this Section, or subsequent to such a default, then, unless and until such default shall be cured, the Trustee shall set apart and hold in a special account for the benefit of the Trustee individually, the Holders of the Securities and the holders of other indenture securities, as defined in Subsection (c) of this Section:
1. an amount equal to any and all reductions in the amount due and owing upon any claim as such creditor in respect of principal or interest, effected after the beginning of such four months' period and valid as against the Company and its other creditors, except any such reduction resulting from the receipt or disposition of any property described in paragraph (2) of this Subsection, or from the exercise of any right of set-off which the Trustee could have exercised if a petition in bankruptcy had been filed by or against the Company upon the date of such default; and 2. all property received by the Trustee in respect of any claims as such creditor, either as security therefor, or in satisfaction or composition thereof, or otherwise, after the beginning of such four months' period, or an amount equal to the proceeds of any such property, if disposed of, subject, however, to the rights, if any, of the Company and its other creditors in such property or such proceeds. Nothing herein contained, however, shall affect the right of the Trustee: A. to retain for its own account (i) payments made on account of any such claim by any Person (other than the Company) who is liable thereon, and (ii) the proceeds of the bona fide sale of any such claim by the Trustee to a third Person, and (iii) distributions made in cash, securities or other property in respect of claims filed against the Company in bankruptcy or receivership or in proceedings for reorganization pursuant to the Federal Bankruptcy Act or applicable State law; B. to realize, for its own account, upon any property held by it as security for any such claim, if such property was so held prior to the beginning of such four months' period; C. to realize, for its own account, but only to the extent of the claim hereinafter mentioned, upon any property held by it as security for any such claim, if such claim was created after the beginning of such four months' period and such property was received as security therefor simultaneously with the creation thereof, and if the Trustee shall sustain the burden of proving that at the time such property was so received the Trustee had no reasonable cause to believe that a default, as defined in Subsection (c) of this Section, would occur within four months; or
D. to receive payment on any claim referred to in paragraph (B) or (C), against the release of any property held as security for such claim as provided in paragraph (B) or (C), as the case may be, to the extent of the fair value of such property. For the purposes of paragraphs (B), (C) and (D), property substituted after the beginning of such four months' period for property held as security at the time of such substitution shall, to the extent of the fair value of the property released, have the same status as the property released, and, to the extent that any claim referred to in any of such paragraphs is created in renewal of or in substitution for or for the purpose of repaying or refunding any pre-existing claim of the Trustee as such creditor, such claim shall have the same status as such pre-existing claim. If the Trustee shall be required to account, the funds and property held in such special account and the proceeds thereof shall be apportioned among the Trustee, the Holders and the holders of other indenture securities in such manner that the Trustee, the Holders and the holders of other indenture securities realize, as a result of payments from such special account and payments of dividends on claims filed against the Company in bankruptcy or receivership or in proceedings for reorganization pursuant to the Federal Bankruptcy Act or applicable State law, the same percentage of their respective claims, figured before crediting to the claim of the Trustee anything on account of the receipt by it from the Company of the funds and property in such special account and before crediting to the respective claims of the Trustee and the Holders and the holders of other indenture securities dividends on claims filed against the Company in bankruptcy or receivership or in proceedings for reorganization pursuant to the Federal Bankruptcy Act or applicable State law, but after crediting thereon receipts on account of the indebtedness represented by their respective claims from all sources other than from such dividends and from the funds and property so held in such special account. As used in this paragraph, with respect to
any claim, the term "dividends" shall include any distribution with respect to such claim, in bankruptcy or receivership or proceedings for reorganization pursuant to the Federal Bankruptcy Act or applicable State law, whether such distribution is made in cash, securities or other property, but shall not include any such distribution with respect to the secured portion, if any, of such claim. The court in which such bankruptcy, receivership or proceedings for reorganization is pending shall have jurisdiction (i) to apportion among the Trustee, the Holders and the holders of other indenture securities, in accordance with the provisions of this paragraph, the funds and property held in such special account and proceeds thereof, or (ii) in lieu of such apportionment, in whole or in part, to give to the provisions of this paragraph due consideration in determining the fairness of the distributions to be made to the Trustee and the Holders and the holders of other indenture securities with respect to their respective claims, in which event it shall not be necessary to liquidate or to appraise the value of any securities or other property held in such special account or as security for any such claim, or to make a specific allocation of such distributions as between the secured and unsecured portions of such claims, or otherwise to apply the provisions of this paragraph as a mathematical formula. Any Trustee which has resigned or been removed after the beginning of such four months' period shall be subject to the provisions of this Subsection as though such resignation or removal had not occurred. If any Trustee has resigned or been removed prior to the beginning of such four months' period, it shall be subject to the provisions of this Subsection if and only if the following conditions exist: i. the receipt of property or reduction of claim, which would have given rise to the obligation to account, if such Trustee had continued as Trustee, occurred after the beginning of such four months' period; and
ii. such receipt of property or reduction of claim occurred within four months after such resignation or removal. b. There shall be excluded from the operation of Subsection (a) of this Section a creditor relationship arising from: 1. the ownership or acquisition of securities issued under any indenture, or any security or securities having a maturity of one year or more at the time of acquisition by the Trustee; 2. advances authorized by a receivership or bankruptcy court of competent jurisdiction or by this Indenture, for the purpose of preserving any property which shall at any time be subject to the lien of this Indenture or of discharging tax liens or other prior liens or encumbrances thereon, if notice of such advances and of the circumstances surrounding the making thereof is given to the Holders at the time and in the manner provided in this Indenture; 3. disbursements made in the ordinary course of business in the capacity of trustee under the indenture, transfer agent, registrar, custodian, paying agent, fiscal agent or depositary, or other similar capacity; 4. an indebtedness created as a result of services rendered or premises rented; or an indebtedness created as a result of goods or securities sold in a cash transaction, as defined in Subsection (c) of this Section; 5. the ownership of stock or of other securities of a corporation organized under the provisions of Section 25(a) of the Federal Reserve Act, as amended, which is directly or indirectly a creditor of the Company; and 6. the acquisition, ownership, acceptance or negotiation of any drafts, bills of exchange, acceptances or obligations which fall within the classification of self-liquidating paper, as defined in Subsection (c) of this Section. c. For the purposes of this Section only: 1. the term "default" means any failure to make payment in full of the principal of or interest on any of the Securities or upon the other indenture securities when and as such principal or interest becomes due and payable; 2. the term "other indenture securities" means securities upon which the Company is an obligor outstanding under any other indenture (i) under which the Trustee is also trustee, (ii) which contains provisions substantially similar to the provisions of this Section, and (iii) under which a default exists at the time of the apportionment of the funds and property held in such special account; 3. the term "cash transaction" means any transaction in which full payment for goods or securities sold is made within
seven days after delivery of the goods or securities in currency or in checks or other orders drawn upon banks or bankers and payable upon demand; 4. the term "self-liquidating paper" means any draft, bull of exchange, acceptance or obligations which is made, drawn, negotiated or incurred by the Company for the purpose of financing the purchase, processing, manufacturing, shipment, storage or sale of goods, wares or merchandise and which is secured by documents evidencing title to, possession of, or lien upon, the goods, wares or merchandise or the receivables or proceeds arising from the sale of the goods, wares or merchandise previously constituting the security, provided the security is received by the Trustee simultaneously with the creation of the creditor relationship with the Company arising from the making, drawing, negotiating or incurring of the draft, bill of exchange, acceptance or obligation; 5. the term "Company" means any obligor upon the Securities; and 6. the term "Federal Bankruptcy Act" means the Bankruptcy Act or Title 11 of the United States Code. 14. Appointment of Authenticating Agent. As of the date of the Indenture and at any time when any of the Securities remain Outstanding the Trustee may appoint an Authenticating Agent or Agents (which may be an Affiliate or Affiliates of the Company) with respect to one or more series of Securities which shall be authorized to act on behalf of the Trustee to authenticate Securities of such series issued upon original issuance, exchange, registration of transfer or partial redemption thereof or pursuant to Section 306, and Securities so authenticated shall be entitled to the benefits of this Indenture and shall be valid and obligatory for all purposes as if authenticated by the Trustee hereunder. Wherever reference is made in this Indenture to the authentication and delivery of Securities by the Trustee or the Trustee's certificate of authentication, such reference shall be deemed to include authentication and delivery on behalf of the Trustee by an Authenticating Agent and a certificate of authentication executed on behalf of the Trustee by an Authenticating Agent. Each Authenticating Agent shall be acceptable to the Company and shall at all times be a corporation organized and doing business under the laws of the United States of America, any State thereof or the District of Columbia, authorized under such laws to act as Authenticating Agent, having a combined capital and surplus of not less than $50,000,000 and subject to supervision or examination by Federal or State authority. If such Authenticating Agent publishes reports of condition at least annually, pursuant to law or to the requirements of said supervising or examining authority, then for the purposes of this Section, the combined capital and surplus of such Authenticating Agent shall be deemed to be its combined capital surplus as set forth in its most recent report of condition so published. If at
any time an Authenticating Agent shall cease to be eligible in accordance with the provisions of this Section, such Authenticating Agent shall resign immediately in the manner and with the effect specified in this Section. Any corporation into which an Authenticating Agent may be merged or converted or with which it may be consolidated, or any corporation resulting from any merger, conversion or consolidation, to which such Authenticating Agent shall be a party, or any corporation succeeding to the corporate agency or corporate trust business of an Authenticating Agent, shall continue to be an Authenticating Agent, provided such corporation shall be otherwise eligible under this Section, without the execution or filing of any paper or any further act on the part of the Trustee or the Authenticating Agent. An Authenticating Agent may resign at any time by giving written notice thereof to the Trustee and to the Company. The Trustee may at any time terminate the agency of an Authenticating Agent by giving written notice thereof to such Authenticating Agent and to the Company. Upon receiving such a notice or resignation or upon such a termination, or in case at any time such Authenticating Agent shall cease to be eligible in accordance with the provisions of this Section, the Trustee may appoint a successor Authenticating Agent which shall be acceptable to the Company and shall mail written notice of such appointment by first-class mail, postage prepaid, to all Holders of Securities of the series with respect to which such Authenticating Agent will serve, as their names and addresses appear in the Security Register. Any successor Authenticating Agent upon acceptance of its appointment hereunder shall become vested with all the rights, powers and duties of its predecessor hereunder, with like effect as if originally named as an Authenticating Agent. No successor Authenticating Agent shall be appointed unless eligible under the provisions of this Section. The Company agrees to pay each Authenticating Agent from time to time reasonable compensation for its services under this Section. The Bank is initially designated as the Authenticating Agent for the Securities. If an appointment with respect to one or more series is made pursuant to this Section, the Securities of such series may have endorsed thereon, in addition to the Trustee's certificate of authentication, an alternate certificate of authentication in the following form: This is one of the Securities of the series designated therein referred to in the within-mentioned Indenture. THE CHASE MANHATTAN BANK (NATIONAL ASSOCIATION) As Trustee
By___________________________________ As Authenticating Agent By___________________________________ Authorized Officer 2. Holders' Lists and Reports by Trustee and Company 1. Company to Furnish Trustee Names and Addresses of Holders. The Company will furnish or cause to be furnished to the Trustee a. semi-annually, not more than fifteen days after each Regular Record Date, or, in the case of any series of Securities on which no interest is payable, not more than fifteen days after each coupon date or other date specified by the Trustee, a list, in such form as the Trustee may reasonably require, of the names and addresses of the Holders as of such Record Date, and b. at such other times as the Trustee may request in writing, within 30 days after the receipt by the Company of any such request, a list of similar form and content as of a date not more than 15 days prior to the time such list is furnished; excluding from any such list names and addresses received by the Trustee if and so long as it is acting as Security Registrar. 2. Preservation of Information; Communications to Holders. a. The Trustee shall preserve, in as current a form as is reasonably practicable, the names and addresses of Holders contained in the most recent list furnished to the Trustee as provided in Section 701 and the names and addressees of Holders received by the Trustee if and so long as it is acting as Security Registrar. The Trustee may
destroy any list furnished to it as provided in Section 701 upon receipt of a new list so furnished. b. If three or more Holders of the same series (herein referred to as "applicants") apply in writing to the Trustee, and furnish to the Trustee reasonable proof that each such applicant has owned a Security for a period of at least six months preceding the date of such application, and such application states that the applicants desire to communicate with other Holders with respect to their rights under this Indenture or under the Securities and is accompanied by a copy of the form of proxy or other communication which such applicants propose to transmit, then the Trustee shall, within five business days after the receipt of such application, at its election, either i. afford such applicants access to the information preserved at the time by the Trustee in accordance with Section 702(a), or ii. inform such applicants as to the approximate number of Holders whose names and addresses appear in the information preserved at the time by the Trustee in accordance with Section 702(a), and as to the approximate cost of mailing to such Holders the form of proxy or other communication, if any, specified in such application. If the Trustee shall elect not to afford such applicants access to such information. the Trustee shall, upon the written request of such applicants, mail to each Holder whose name and address appear in the information preserved at the time by the Trustee in accordance with Section 702(a) a copy of the form of proxy or other communication which is specified in such request, with reasonable promptness after a tender to the Trustee of the material to be mailed and of payment, or provision for the payment, of the reasonable expenses of mailing, unless within five days after such tender the Trustee shall mail to such applicants and file with the Commission, together with a copy of the material to be mailed, a written statement to the effect that, in the opinion of the Trustee, such mailing would be contrary to the best interest of the Holders or would be in violation of applicable law. Such written statement
shall specify the basis of such opinion. If the Commission, after opportunity for a hearing upon the objections specified in the written statement so filed, shall enter an order refusing to sustain any of such objections or if, after the entry of an order sustaining one or more of such objections, the Commission shall find, after notice and opportunity for hearing, that all the objections so sustained have been met and shall enter an order so declaring, the Trustee shall mail copies of such material to all such Holders with reasonable promptness after the entry of such order and the renewal of such tender; otherwise the Trustee shall be relieved of any obligation or duty to such applicants respecting their application. c. Every Holder of Securities, by receiving and holding the same, agrees with the Company and the Trustee that neither the Company nor the Trustee nor any agent of either of them shall be held accountable by reason of the disclosure of any such information as to the names and addresses of the Holders in accordance with Section 702(b), regardless of the source from which such information was derived, and that the Trustee shall not be held accountable by reason of mailing any material pursuant to a request made under Section 702(b). 3. Reports by Trustee. a. On or before September 15 of each year commencing with the year 1990, the Trustee shall transmit by mail to all Holders, as their names and addresses appear in the Security Register, a brief report dated as of the preceding July 15 with respect to: 1. its eligibility under Section 609 and its qualifications under Section 608, or in lieu thereof, if to the best of its knowledge it has continued to be eligible and qualified under said Sections, a written statement to such effect; 2. the character and amount of any advances (and if the Trustee elects so to state, the circumstances surrounding the making thereof) made by the Trustee (as such) which remain unpaid on the date of such report, and for the reimbursement of which it claims or may claim a lien or charge, prior to that of the Securities, on any property or funds held or collected by it as Trustee, except that the Trustee shall not be required (but may elect) to report such advances if such advances so remain unpaid aggregate not more than 1/2 of 1% of the principal amount of the Securities Outstanding on the date of such report; 3. the amount, interest rate and maturity date of all other indebtedness owing by the Company (or by any other obligor on the Securities) to the Trustee in its individual capacity, on the date of such report, with a brief description
of any property held as collateral security therefor, except an indebtedness based upon a creditor relationship arising in any manner described in Section 613(b)(2), (3), (4) or (6); 4. the property and funds, if any, physically in the possession of the Trustee as such on the date of such report; 5. any additional issue of Securities which the Trustee has not previously reported; and 6. any action taken by the Trustee in the performance of its duties hereunder which it has not previously reported and which in its opinion materially affects the Securities, except action in respect of a default, notice of which has been or is to be withheld by the Trustee in accordance with Section 602. b. The Trustee shall transmit by mail to all Holders, as their names and addresses appear in the Security Register, a brief report with respect to the character and amount of any advances (and if the Trustee elects so to state, the circumstances surrounding the making thereof) made by the Trustee (as such) since the date of the last report transmitted pursuant to Subsection (a) of this Section (or if no such report has yet been so transmitted, since the date of execution of this instrument) for the reimbursement of which it claims or may claim a lien or charge, prior to that of the Securities, on property or funds held or collected by it as Trustee and which it has not previously reported pursuant to this Subsection, except that the Trustee shall not be required (but may elect) to report such advances if such advances remaining unpaid at any time aggregate 10% or less of the principal amount of the Securities Outstanding at such time, such report to be transmitted within 90 days after such time. c. A copy of each such report shall, at the time of such transmission to Holders, be filed by the Trustee with each stock exchange upon which any Securities are listed, with the Commission and with the Company. The Company will notify the Trustee when any Securities are listed on any stock exchange. 4. Reports by Company. The Company shall: 1. file with the Trustee, within 15 days after the Company is required to file the same with the Commission, copies of the annual reports and of the information, documents and other reports (or copies of such portions of any of the foregoing as the Commission may from time to time by rules and regulations prescribe) which the Company may be required to file with the Commission pursuant to Section
13 or Section 15(d) of the Securities Exchange Act of 1934; or, if the Company is not required to file information, documents or reports pursuant to either of said Sections, then it shall file with the Trustee and the Commission, in accordance with rules and regulations prescribed from time to time by the Commission, such of the supplementary and periodic information, documents and reports which may be required pursuant to Section 13 of the Securities Exchange Act of 1934 in respect of a security listed and registered on a national securities exchange as may be prescribed from time to time in such rules and regulations; 2. file with the Trustees and the Commission, in accordance with rules and regulations prescribed from time to time by the Commission, such additional information, documents and reports with respect to compliance by the Company with the conditions and covenants of this Indenture as may be required from time to time by such rules and regulations; and 3. transmit by mail to all Holders, as their names and addresses appear in the Security Register, within 30 days after the filing thereof with the Trustee, such summaries of any information, documents and reports required to be filed by the Company pursuant to paragraphs (1) and (2) of this Section as may be required by rules and regulations prescribed from time to time by the Commission. 3. Consolidation, Merger, Conveyance, Transfer or Lease 1. Company May Consolidate, Etc., Only on Certain Terms. The Company shall not consolidate with or merge into any other Person or convey, transfer or lease its properties and assets substantially as an entirety to any Person, unless: 1. the Person formed by such consolidation or into which the Company is merged or the Person which acquires by conveyance or transfer, of which leases, the properties and assets of the Company substantially as an entirety shall be a corporation organized and existing under the laws of the United States of America, any State thereof or the District of Columbia and shall expressly assume, by an indenture supplemental hereto, executed and delivered to the Trustee, in form satisfactory to the Trustee, the due and punctual payment of the principal of (and premium, if any) and interest on all the Securities and the performance of every
covenant of this Indenture on the part of the Company to be performed or observed; 2. immediately after giving effect to such transaction, no Event of Default and no event which, after notice or lapse of time or both, would become an Event of Default shall have happened and be continuing; and 3. the Company shall have delivered to the Trustee an Officers' Certificate and an Opinion of Counsel, each stating that such consolidation, merger, conveyance, transfer or lease and such supplemental indenture comply with this Article and that all conditions precedent herein provided for relating to such transaction have been complied with. 2. Successor Corporation Substituted. Upon any consolidation by the Company with or merger by the Company into any other Person or any conveyance, transfer or lease of the properties and assets of the Company substantially as an entirety in accordance with Section 801, the successor Person formed by such consolidation or into which the Company is merged or to which such conveyance, transfer or lease is made shall succeed to, and be substituted for, and may exercise every right and power of, the Company under this Indenture with the same effect as if such successor Person had been named as the Company herein, and thereafter, except in the case of a lease, the predecessor Person shall be relieved of all obligations and covenants under this Indenture and the Securities. 4. Supplemental Indentures 1. Supplemental Indentures Without Consent of Holders. Without the consent of any Holders, the Company, when authorized by a Board Resolution, and the Trustee, at any time and from time to time, may enter into one or more indentures supplemental hereto, in form satisfactory to the Trustee, for any of the following purposes: 1. to evidence the succession of another corporation to the Company and the assumption by any such successor of the covenants of the Company herein and in the Securities; or 2. to add to the covenants of the Company for the benefit of the Holders of all or any series of Securities (and if such covenants are to be for the benefit of fewer than all series of Securities, stating that such covenants are expressly being included solely for the benefit of such series) or to surrender any right or power herein conferred upon the Company; or
3. to add any additional Events of Default; or 4. to add to or change any of the provisions of this Indenture to such extent as shall be necessary to permit or facilitate the issuance of Securities in bearer form, registrable or not registrable as to principal, and with or without interest coupons, or to permit or facilitate the issuance of Securities in certificated form or global form; or 5. to change or eliminate any of the provisions of this Indenture, provided that any such change or elimination shall become effective only when there is no Security Outstanding of any series created prior to the execution of such supplemental indenture which is entitled to the benefit of such provision; or 6. to secure the Securities; or 7. to establish the form or terms of Securities of any series as permitted by Sections 201 and 301; or 8. to evidence and provide for the acceptance of appointment hereunder by a successor Trustee with respect to the Securities of one or more series and to add to or change any of the provisions of this Indenture as shall be necessary to provide for or facilitate the administration of the trusts hereunder by more than one Trustee, pursuant to the requirements of Section 611(b); or 9. to cure any ambiguity, to correct or supplement any provision herein which may be inconsistent with any other provision herein, or to make any other provisions with respect to matters or questions arising under this Indenture, provided such action shall not adversely affect the interests of the Holders of Securities or any series in any material respect. 2. Supplemental Indentures with Consent of Holders. With the consent of the Holders of not less than a majority in principal amount of the Outstanding Securities of each series affected by such supplemental indenture, by Act of said Holders delivered to the Company and the Trustee, the Company, when authorized by a Board Resolution, and the Trustee may enter into an indenture or indentures supplemental hereto for the purpose of adding any provisions to or changing in any manner or eliminating any of the provisions of this Indenture or of modifying in any manner the rights of the Holders of Securities of such series under this Indenture; provided, however, that no such supplemental indenture shall, without the consent of the Holder of each Outstanding Security affected thereby, 1. change the Stated Maturity of the principal of, or any instalment of principal of or interest on, any Security, or
reduce the principal amount thereof or the rate of, or method of computation of the rate of, interest thereon or any premium payable upon the redemption thereof, or reduce the amount of the principal of an Original Issue Discount Security that would be due and payable upon a declaration of acceleration of the Maturity thereof pursuant to Section 502, or reduce the amount of, or postpone the date fixed for, the payment of any sinking fund or analogous obligation, or change any Place of Payment where, or the coin or currency in which, any Security or any premium of the interest thereon is payable, or impair the right to institute suit for the enforcement of any such payment on or after the Stated Maturity thereof (or, in the case of redemption, on or after the Redemption Date), or 2. reduce the percentage in principal amount of the Outstanding Securities of any series, the consent of whose Holders is required for any such supplemental indenture, of the consent of whose Holders is required for any waiver (of compliance with certain provisions of this Indenture or certain defaults hereunder and their consequences) provided for in this Indenture, or 3. modify any of the provisions of this Section, Section 513 or Section 1008, except to increase any such percentage or to provide that certain other provisions of this Indenture cannot be modified or waived without the consent of the Holder of each Outstanding Security affected thereby, provided, however, that this clause shall not be deemed to require the consent of any Holder with respect to changes in the references to the "Trustee", and concomitant changes in this Section and Section 1008, or the deletion of this proviso, in accordance with the requirements of Sections 611(b) and 901(8). A supplemental indenture which changes or eliminates any covenant or other provision of this Indenture which has expressly been included solely for the benefit of one or more particular series of Securities, or which modifies the rights of the Holders of Securities of such series with respect to such covenant or other provision, shall be deemed not to affect the rights under this Indenture of the Holders of Securities of any other series. The Company may, but shall not be obligated to, fix a record date for the purpose of determining the Persons entitled to consent to any indenture supplemental hereto. If a record date is fixed, the Holders on such record date or their duly designated proxies, and only such Persons, shall be entitled to consent to such supplemental indenture, whether or not such Holders remain Holders after such record date; provided, that unless such
consent shall have become effective by virtue of the requisite percentage having been obtained prior to the date which is 90 days after such record date, any such consent previously given shall automatically and without further action by any Holder be canceled and of no further effect. It shall not be necessary for any Act of Holders under this Section to approve the particular form of any proposed supplemental indenture, but it shall be sufficient if such Act shall approve the substance thereof. 3. Execution of Supplemental Indentures. In executing, or accepting the additional trusts created by, any supplemental indenture permitted by this Article or the modifications thereby of the trusts created by this Indenture, the Trustee may receive, and (subject to Section 601) shall be fully protected in relying upon, an Opinion of Counsel stating that the execution of such supplemental indenture is authorized or permitted by this Indenture. The Trustee may, but shall not be obligated to, enter into any such supplemental indenture which affects the Trustee's own rights, duties or immunities under this Indenture or otherwise. 4. Effect of Supplemental Indentures. Upon the execution of any supplemental indenture under this Article, this Indenture shall be modified in accordance therewith, and such supplemental indenture shall form a part of this Indenture for all purposes; and every Holder of Securities theretofore or thereafter authenticated and delivered hereunder shall be bound thereby. 5. Conformity with Trust Indenture Act. Every supplemental indenture executed pursuant to this Article shall conform to the requirements of the Trust Indenture Act as then in effect. 6. Reference in Securities to Supplemental Indentures. Securities of any series authenticated and delivered after the execution of any supplemental indenture pursuant to this Article may, and shall if required by the Trustee, bear a notation in form approved by the Trustee as to any matter provided for in such supplemental indenture. If the Company shall so determine, new Securities of any series so modified as to conform, in the opinion of the Trustee and the Company, to any such supplemental indenture may be prepared and executed by the Company and authenticated and delivered by the Trustee in exchange for Outstanding Securities of such series.
5. Covenants 1. Payment of Principal, Premium and Interest. The Company covenants and agrees for the benefit of each series of Securities that it will duly and punctually pay the principal of (and premium, if any) and interest on the Securities of that series in accordance with the terms of the Securities and this Indenture. The Company shall have the right to require a Holder, in connection with the payment of the principal of (and premium, if any) or interest, if any, on a Security, to present at the office or agency of the Company at which such payment is made a certificate, in such form as the Company may from time to time prescribe, to enable the Company to determine its duties and liabilities with respect to any taxes, assessments or governmental charges which it may be required to deduct or withhold therefrom under any present or future law of the United States of America or of any State, County, Municipality or taxing authority therein, and the Company shall be entitled to determine its duties and liabilities with respect to such deduction or withholding on the basis of information contained in such certificate or, if no such certificate shall be so presented, on the basis of any presumption created by any such law, and shall be entitled to act in accordance with such determination. 2. Maintenance of Office or Agency. The Company will maintain in the Borough of Manhattan, The City of New York and in each Place of Payment for any series of Securities an office or agency where Securities of that series may be presented or surrendered for payment (provided, however, that, unless otherwise provided with respect to any series of Securities, at the option of the Company payment of interest may be made by check mailed to the address of the person entitled thereto as such address shall appear in the Security Register), where Securities of that series may be surrendered for registration of transfer or exchange and where notices and demands to or upon the Company in respect of the Securities of that series and this Indenture may be served. The Company initially appoints the corporate trust office of the Bank as its agent for purposes of presentation and surrender of Securities for payment, registration of transfer or exchange and for service of notices and demands to or upon the Company in respect of the Securities of a series and this Indenture. The Company will give prompt written notice to the Trustee of the location, and any change in the location, of such office or agency. If at any time the Company shall fail to maintain any such required office or agency or shall fail to furnish the Trustee with the address thereof, such presentations, surrenders, notices
and demands may be made or served at the Corporate Trust Office of the Trustee, and the Company hereby appoints the Trustee as its agent to receive all such presentations, surrenders, notices and demands. The Company may also from time to time designate one or more other offices or agencies where the Securities of one or more series may be presented or surrendered for any or all such purposes and may from time to time rescind such designations; provided, however, that no such designation or rescission shall in any manner relieve the Company of its obligation to maintain an office or agency in the Borough of Manhattan, The City of New York and in each Place of Payment for Securities of any series for such purposes. The Company will give prompt written notice to the Trustee of any such designation or rescission and of any change in the location of any such other office or agency. 3. Money for Securities Payments to Be Held in Trust. If the Company shall at any time act as its own Paying Agent with respect to any series of Securities, it will, on or before each due date of the principal of (and premium, if any) or interest on any of the Securities of that series, segregate and hold in trust for the benefit of the Persons entitled thereto a sum sufficient to pay the principal (and premium, if any) or interest so becoming due until such sums shall be paid to such Persons or otherwise disposed of as herein provided and will promptly notify the Trustee of its action or failure so to act. Whenever the Company shall have one or more Paying Agents for any series of Securities, it will, prior to each due date of the principal of (and premium, if any) or interest on any Securities of that series, deposit with a Paying Agent a sum sufficient to pay the principal (and premium, if any) or interest so becoming due, such sum to be held in trust for the benefit of the Persons entitled to such principal, premium or interest, and (unless such Paying Agent is the Trustee) the Company will promptly notify the Trustee of its action or failure so to act. The Company will cause each Paying Agent for any series of Securities other than the Trustee to execute and deliver to the Trustee an instrument in which such Paying Agent shall agree with the Trustee, subject to the provisions of this Section, that such Paying Agent will: 1. hold all sums held by it for the payment of the principal of (and premium, if any) or interest on Securities of that series in trust for the benefit of the Persons entitled thereto until such sums shall be paid to such Persons or otherwise disposed of as herein provided;
2. give the Trustee notice of any default by the Company (or any other obligor upon the Securities of that series) in the making of any payment of principal of (and premium, if any) or interest on the Securities of that series; and 3. at any time during the continuance of any such default, upon the written request of the Trustee, forthwith pay to the Trustee all sums so held in trust by such Paying Agent. The Company may at any time, for the purpose of obtaining the satisfaction and discharge of this Indenture or for any other purpose, pay, or by Company Order direct any Paying Agent to pay, to the Trustee all sums held in trust by the Company or such Paying Agent, such sums to be held by the Trustee upon the same trusts as those upon which such sums were held by the Company or such Paying Agent; and, upon such payment by any Paying Agent to the Trustee, such Paying Agent shall be released from all further liability with respect to such money. Any money deposited with the Trustee or any Paying Agent, or then held by the Company, in trust for the payment of the principal of (and premium, if any) or interest on any Security of any series and remaining unclaimed for two years after such principal (and premium, if any) or interest has become due and payable shall be paid to the Company on Company Request, or (if then held by the Company) shall be discharged from such trust; and the Holder of such Security shall thereafter, as an unsecured general creditor, look only to the Company for payment thereof, and all liability of the Trustee or such Paying Agent with respect to such trust money, and all liability of the Company as trustee thereof, shall thereupon cease; provided, however, that the Trustee or such Paying Agent, before being required to make any such repayment, may at the expense of the Company cause to be published once, in a newspaper published in the English language, customarily published on each Business Day and of general circulation in the Borough of Manhattan, The City of New York, notice that such money remains unclaimed and that, after a date specified therein, which shall not be less than 30 days from the date of such publication, any unclaimed balance of such money then remaining will be repaid to the Company. 4. Corporate Existence. Except as permitted by the provisions of Article Eight and subject to Section 1006, the Company will do or cause to be done all things necessary to preserve and keep in full force and effect its corporate existence and that of the Bank and material rights (charter and statutory) and material franchises of the Company and the Bank; provided, however, that the Company shall not be required to preserve any such right or franchise if the Board of Directors shall determine that the preservation
thereof is no longer desirable in the conduct of the business of the Company and its Subsidiaries considered as a whole, and that the loss thereof is not disadvantageous in any material respect to the Holders. 5. Payment of Taxes and Other Claims. The Company will pay or discharge or cause to be paid or discharged, before the same shall become delinquent, (1) all taxes, assessments and governmental charges levied or imposed upon the Company and the Bank or upon the income, profits or property of the Company and the Bank, and (2) all lawful claims for labor, materials and supplies which, if unpaid, might by law become a lien upon the property of the Company and the Bank; provided, however, that the Company shall not be required to pay or discharge or cause to be paid or discharged any such tax, assessment, charge or claim whose amount, applicability or validity is being contested in good faith by appropriate proceedings. 6. Limitation on Disposition of Stock of Bank. So long as any Securities shall be Outstanding, neither the Company nor any Intermediate Subsidiary (as hereinafter defined) will (except to the Company or an Intermediate Subsidiary) sell, assign, transfer, grant a security interest in or otherwise dispose of any shares of, securities convertible into, or options, warrants or rights to subscribe for or purchase shares of, Voting Stock of the Bank, nor will the Company or any Intermediate Subsidiary permit the Bank to issue any shares of, or securities convertible into, or options, warrants or rights to subscribe for or purchase shares of, Voting Stock of the Bank, nor will the Company permit any Intermediate Subsidiary that owns any shares of, or securities convertible into, or options, warrants or rights to subscribe for or purchase shares of, Voting Stock of the Bank to cease to be an Intermediate Subsidiary, except that (i) the Company or an Intermediate Subsidiary may make any such sale, assignment, transfer, or grant of a security interest or other disposition for fair market value on the date thereof, as determined by the Board of Directors of the Company or such Intermediate Subsidiary, as the case may be (which determination shall be conclusive), and evidenced by a duly adopted resolution thereof, and (ii) in each such case, after giving effect thereto, the Company and any one or more Intermediate Subsidiaries will own at least 80% of the Voting Stock of the Bank then issued and outstanding free and clear of any security interest. Notwithstanding the foregoing, the Bank may be merged into or consolidated with another banking institution organized under the laws of the United States, any State thereof or the District of Columbia, if after giving effect to such merger or consolidation the Company and any one or more Intermediate Subsidiaries own at least 80% of the Voting Stock of such other banking institution and immediately after giving effect thereto
and treating any such resulting bank thereafter as the Bank for purposes of this Indenture, no Event of Default, and no event which, after notice or lapse of time or both, would become an Event of Default, shall have happened and be continuing. For purposes of this Section, an "Intermediate Subsidiary" means a Subsidiary (i) that is organized under the laws of the United States, any State thereof or the District of Columbia, and (ii) of which all the shares of each class of capital stock issued and outstanding, and all securities convertible into, and options, warrants and rights to subscribe for or purchase shares of, such capital stock, are owned directly by the Company, free and clear of any security interest. The provisions of this Section 1006 shall not prohibit the Company from consolidating with or merging into any other Person or from conveying, transferring or leasing the Company's properties and assets substantially as an entirety to any Person as otherwise permitted pursuant to Article Eight. 7. Statement as to Compliance. The Company will deliver to the Trustee, within 120 days after the end of each fiscal year of the Company, a written statement, which need not comply with Section 102, signed by the Chairman of the Board, a Vice Chairman, the President, the Chief Financial Officer or a Vice President and by the Controller, Assistant Controller, the Secretary or an Assistant Secretary of the Company stating, as to each signer thereof, that 1. a review of the activities of the Company during such year and of performance under this Indenture has been made under his supervision, and 2. to the best of his knowledge, based on such review, (a) the Company has fulfilled all its obligations under this Indenture throughout such year, or, if there has been a default in the fulfillment of any such obligation, specifying each such default known to him and the nature and status thereof, and (b) no event has occurred and is continuing which is, or after notice or lapse of time or both would become, an Event of Default, or, if such an event has occurred and is continuing, specifying each such event known to him and the nature and status thereof. 8. Waiver of Certain Covenants. The Company may omit in any particular instance to comply with any term, covenant or condition set forth in Sections 1004 to 1006, inclusive, with respect to the Securities of any series if before the time for such compliance the Holders of at least a majority in principal amount of the Outstanding Securities of such series shall, by Act of such Holders, either waive such compliance in such instance or
generally waive compliance with such term, covenant or condition, but no such waiver shall extend to or affect such term, covenant or condition except to the extent so expressly waived, and, until such waiver shall become effective, the obligations of the Company and the duties of the Trustee in respect of any such term, covenant or condition shall remain in full force and effect. The Company may, but shall not be obligated to, fix a record date for the purpose of determining the Persons entitled to waive any such term, provision or condition. If a record date is fixed, the Holders on such record date or their duly designated proxies, and only such Persons, shall be entitled to waive any such term, provision or condition hereunder, whether or not such Holders remain Holders after such record date; provided, that unless the Holders of at least a majority in principal amount of the Outstanding Securities of such series shall have waived such term, provision or condition prior to the date which is 90 days after such record date, any such waiver previously given shall automatically and without further action by any Holder be canceled and of no further effect. 6. Redemption of Securities 1. Applicability of Article. Securities of any series which are redeemable before their Stated Maturity shall be redeemable in accordance with their terms and (except as otherwise specified as contemplated by Section 301 for Securities of any series) in accordance with this Article. 2. Election to Redeem; Notice to Trustee. The election of the Company to redeem any Securities shall be evidenced by a Board Resolution. In case of any redemption at the election of the Company of fewer than all the Securities of any series, the Company shall, at least 60 days prior to the Redemption Date fixed by the Company (unless a shorter notice shall be satisfactory to the Trustee), notify the Trustee of such Redemption Date, of the tenor, if applicable, of the Securities to be redeemed, and of the principal amount of Securities of such series to be redeemed. In the case of any redemption of Securities prior to the expiration of any restriction on such redemption provided in the terms of such Securities or elsewhere in this Indenture, the Company shall furnish the Trustee with an Officers' Certificate evidencing compliance with such restriction. 3. Selection by Trustee of Securities to Be Redeemed. If fewer than all the Securities of any series are to be redeemed (unless all of the Securities of a specified tenor are to e redeemed), the particular
Securities to be redeemed shall be selected not more than 60 days prior to the Redemption Date by the Trustee, from the Outstanding Securities of such series subject to such redemption and not previously called for redemption, by such method as the Trustee shall deem fair and appropriate (but subject to compliance with the rules of any securities exchange on which the securities of such series may be listed) and which may provide for the selection for redemption of portions (equal to the minimum authorized denomination for Securities of that series or any integral multiple thereof) of the principal amount of Securities of such series of a denomination larger than the minimum authorized denomination for Securities of that series. If fewer than all of the Securities of such series and of a specified tenor are to be redeemed, the particular Securities to be redeemed shall be selected not more than 45 days prior to the Redemption Date by the Trustee, from the Outstanding Securities of such series and specified tenor not previously called for redemption in accordance with the preceding sentence. The Trustee shall promptly notify the Company in writing of the Securities selected for redemption and, in the case of any Securities selected for partial redemption, the principal amount thereof to be redeemed. For all purposes of this Indenture, unless the context otherwise requires, all provisions relating to the redemption of Securities shall relate, in the case of any Securities redeemed or to be redeemed only in part, to the portion of the principal amount of such Securities which has been or is to be redeemed. 4. Notice of Redemption. Notice of redemption shall be given by first-class mail, postage prepaid, mailed not less than 30 nor more than 60 days prior to the Redemption Date, to each Holder of Securities to be redeemed, at his address appearing in the Security Register. All notices of redemption shall state: 1. the Redemption Date, 2. the Redemption Price, 3. if fewer than all the Outstanding Securities of any series are to be redeemed, the identification (and, in the case of partial redemption, the principal amounts) of the particular Securities to be redeemed, 4. the CUSIP number of the Securities to be redeemed, 5. that on the Redemption Date the Redemption Price will become due and payable upon each such Security to be
redeemed and, if applicable, that interest thereon will cease to accrue on and after said date, 6. the place or places where such Securities are to be surrendered for payment of the Redemption Price, and 7. that the redemption is for a sinking fund, if such is the case. Notice of redemption of Securities to be redeemed at the election of the Company shall be given by the Company or, at the Company's request, by the Trustee in the name and at the expense of the Company. 5. Deposit of Redemption Price. Prior to any Redemption Date, the Company shall deposit with the Trustee or with a Paying Agent (or, if the Company is acting as its own Paying Agent, segregate and hold in trust as provided in Section 1003) an amount of money sufficient to pay the Redemption Price of, and (except if the Redemption Date shall be an Interest Payment Date) accrued interest on, all the Securities which are to be redeemed on that date. 6. Securities Payable on Redemption Date. Notice of redemption having been given as aforesaid, the Securities so to be redeemed shall, on the Redemption Date, become due and payable at the Redemption Price therein specified, and from and after such date (unless the Company shall default in the payment of the Redemption Price and accrued interest) such Securities shall cease to bear interest. Upon surrender of any such Security for redemption in accordance with said notice, such Security shall be paid by the Company at the Redemption Price, together with accrued interest to the Redemption Date; provided, however, that installments of interest whose Stated Maturity is on or prior to the Redemption Date shall be payable to the Holders of such Securities, or one or more Predecessor Securities, registered as such at the close of business on the relevant Record Dates according to their terms and the provisions of Section 307. If any Security called for redemption shall not be so paid upon surrender thereof for redemption, the principal (and premium, if any) shall, until paid, bear interest from the Redemption Date at the rate prescribed therefor in the Security. 7. Securities Redeemed in Part. Any Security which is to be redeemed only in part shall be surrendered at a Place of Payment therefor (with, if the Company or the Trustee so requires, due endorsement by, or a written instrument of transfer in form satisfactory to the Company and the Trustee duly executed by, the Holder thereof or his attorney
duly authorized in writing), and the Company shall execute, and the Trustee shall authenticate and make available for delivery to the Holder of such Security without service charge, a new Security or Securities of the same series and of like tenor, of any authorized denomination as requested by such Holder, in aggregate principal amount equal to and in exchange for the unredeemed portion of the principal of the Security so surrendered. If a Global Security is so surrendered, such new Security so issued shall be a new Global Security. 7. Sinking Funds 1. Applicability of Article. The provisions of this Article shall be applicable to any sinking fund for the retirement of Securities of a series except as otherwise specified as contemplated by Section 301 for Securities of such series. The minimum amount of any sinking fund payment provided for by the terms of Securities of any series is herein referred to as a "mandatory sinking fund payment", and any payment in excess of such minimum amount provided for by the terms of Securities of any series is herein referred to as an "optional sinking fund payment". If provided for by the terms of Securities of any series, the cash amount of any sinking fund payment may be subject to reduction as provided in Section 1202. Each sinking fund payment shall be applied to the redemption of Securities of any series as provided for by the terms of Securities of such series. 2. Satisfaction of Sinking Fund Payments with Securities. The Company (1) may deliver Outstanding Securities of a series (other than any previously called for redemption) and (2) may apply as a credit Securities of a series which have been redeemed either at the election of the Company pursuant to the terms of such Securities or through the application of permitted optional sinking fund payments pursuant to the terms of such Securities, in each case in satisfaction of all or any part of any sinking fund payment with respect to the Securities of such series required to be made pursuant to the terms of such Securities as provided for by the terms of such series; provided that such Securities have not been previously so credited; provided further that, in the case of (1) above, with respect to any Outstanding Securities so delivered, and in the case of (2) above, with respect to any such Securities so credited, such Outstanding Securities or Securities, as the case may be, be Securities subject to the sinking fund payment required to be made with respect to the Securities of such series. Such Securities shall be received and credited for such purpose by the Trustee at the Redemption Price specified in such
Securities for redemption through operation of the sinking fund and the amount of such sinking fund payment shall be reduced accordingly. 3. Redemption of Securities for Sinking Fund. Not less than 60 days prior to each sinking fund payment date for any series of Securities, the Company will deliver to the Trustee an Officers' Certificate specifying the amount of the next ensuing sinking fund payment for that series pursuant to the terms of that series, the portion thereof, if any, which is to be satisfied by payment of cash and the portion thereof, if any, which is to be satisfied by delivering and crediting Securities of that series pursuant to Section 1202 and will also deliver to the Trustee any Securities to be so delivered. Not less than 45 days before each such sinking fund payment date the Trustee shall select the Securities to be redeemed upon such sinking fund payment date in the manner specified in Section 1103 and cause notice of the redemption thereof to be given in the name of and at the expense of the Company in the manner provided in Section 1104. Such notice having been duly given, the redemption of such Securities shall be made upon the terms and in the manner stated in Sections 1106 and 1107. 8. Defeasance and Covenant Defeasance 1. Applicability of Article; Company's Option to Effect Defeasance or Covenant Defeasance. If pursuant to Section 301 provision is made for either or both of (a) defeasance of the Securities of a series under Section 1302 or (b) covenant defeasance of the Securities of a series under Section 1303, then the provisions of such Section or Sections, as the case may be, together with the other provisions of this Article Thirteen, shall be applicable to the Securities of such series, and the Company may at its option by Board Resolution, at any time, with respect to the Securities of such series, elect to have either Section 1302 (if applicable) or Section 1303 (if applicable) be applied to the Outstanding Securities of such series upon compliance with the conditions set forth below in this Article Thirteen. 2. Defeasance and Discharge. Upon the Company's exercise of the above option applicable to this Section, the Company shall be deemed to have been discharged from its obligations with respect to the Outstanding Securities of such series on and after the date the conditions precedent set forth below are satisfied but subject to satisfaction of the conditions subsequent set forth below (hereinafter, "defeasance"). For this purpose, such defeasance means that the Company shall be deemed to have paid and discharged the entire
indebtedness represented by the Outstanding Securities of such series and to have satisfied all its other obligations under such Securities and this Indenture insofar as such Securities are concerned (and the Trustee, at the expense of the Company, shall execute proper instruments acknowledging the same), except for the following which shall survive until otherwise terminated or discharged hereunder: (A) the rights of Holders of the series of Securities defeased pursuant to this Section 1302 to receive, solely from the trust fund described in Section 1304 and as more fully set forth in such Section, payments of the principal of (and premium, if any) and interest on such Securities when such payments are due, (B) the Company's obligations with respect to such Securities under Sections 304, 305, 306, 1002 and 1003 and such obligations as shall be ancillary thereto, (C) the rights, powers, trusts, duties, immunities and other provisions in respect of the Trustee hereunder and (D) this Article Thirteen. Subject to compliance with this Article Thirteen, the Company may exercise its option under this Section 1302 notwithstanding the prior exercise of its option under Section 1303 with respect to the Securities of such series. Following a defeasance, payment of the Securities of such series may not be accelerated because of an Event of Default. 3. Covenant Defeasance. Upon the Company's exercise of the above option applicable to this Section, the Company shall be released from its obligations under Section 1005 and Section 1006, (and any other Sections applicable to such Securities that are determined pursuant to Section 301 to be subject to this provision) and the occurrence of an event of default specified in Section 501(4) (insofar as it is with respect to Section 1005 and Section 1006 or any other Section applicable to such Securities that are determined pursuant to Section 301 to be subject to this provision) or Section 501(5) shall be deemed not to be an Event of Default with respect to the Outstanding Securities of such series on and after the date the conditions precedent set forth below are satisfied but subject to satisfaction of the conditions subsequent set forth below (hereinafter, "covenant defeasance"). For this purpose, such covenant defeasance means that, with respect to the Outstanding Securities of such series, the Company may omit to comply with and shall have no liability in respect of any term, condition or limitation set forth in any such Section, whether directly or indirectly by reason of any reference elsewhere herein to any such Section or by reason of any reference in any such Section to any other provision herein or in any other document, but the remainder of this Indenture and such Securities shall be unaffected thereby. Following a covenant defeasance, payment of the Securities of such series may not be accelerated because of an Event of Default specified in Section 501(5) or by reference to such other Section specified above in this Section 1303.
4. Conditions to Defeasance or Covenant Defeasance. The following shall be the conditions precedent or, as specifically noted below, subsequent to application of either Section 1302 or Section 1303 to the Outstanding Securities of such series: 1. The Company shall irrevocably have deposited or caused to be deposited with the Trustee (or another trustee satisfying the requirements of Section 609 who shall agree to comply with the provisions of this Article Thirteen applicable to it) as trust funds in trust for the purpose of making the following payments, specifically pledged as security for, and dedicated solely to, the benefit of the Holders of such Securities, (A) money in an amount, or (B) U.S. Government Obligations which through the scheduled payment of principal and interest in respect thereof in accordance with their terms will provide, not later than one day before the due date of any payment, money in an amount, or (C) a combination thereof, sufficient, without reinvestment, in the opinion of a nationally recognized firm of independent public accountants expressed in a written certification thereof delivered to the Trustee, to pay and discharge, and which shall be applied by the Trustee (or other qualifying trustee) to pay and discharge, (i) the principal of (and premium, if any) and interest on the Outstanding Securities of such series to maturity or redemption, as the case may be, and (ii) any mandatory sinking fund payments or analogous payments applicable to the Outstanding Securities of such series on the due dates thereof. Before such a deposit the Company may make arrangements satisfactory to the Trustee for the redemption of Securities at a future date or dates in accordance with Article Eleven, which shall be given effect in applying the foregoing. For this purpose, "U.S. Government Obligations" means securities that are (x) direct obligations of the United States of America for the payment of which its full faith and credit is pledged or (y) obligations of a Person controlled or supervised by and acting as an agency or instrumentality of the United States of America the payment of which is unconditionally guaranteed as a full faith and credit obligation by the United States of America, which, in either case, are not callable or redeemable at the option of the issuer thereof, and shall also include a depository receipt issued by a bank (as defined in Section 3(a)(2) of the Securities Act of 1933, as amended) as custodian with respect to any such U.S. Government
Obligation or a specific payment of principal of or interest on any such U.S. Government Obligation held by such custodian for the account of the holder of such depository receipt, provided that (except as required by law) such custodian is not authorized to make any deduction from the amount payable to the holder of such depository receipt from any amount received by the custodian in respect of the U.S. Government Obligation or the specific payment of principal of or interest on the U.S. Government Obligation evidenced by such depository receipt. 2. No Event of Default or event which with notice or lapse of time or both would become an Event of Default with respect to the Securities of such series shall have occurred and be continuing (A) on the date of such deposit or (B) insofar as subsections 501(6) and (7) are concerned, at any time during the period ending on the 123rd day after the date of such deposit or, if longer, ending on the day following the expiration of the longest preference period applicable to the Company in respect of such deposit (it being understood that the condition in this clause (B) is a condition subsequent and shall not be deemed satisfied until the expiration of such period). 3. Such defeasance or covenant defeasance shall not (A) cause the Trustee for the Securities of such series to have a conflicting interest as defined in Section 608 or for purposes of the Trust Indenture Act with respect to any securities of the Company or (B) result in the trust arising from such deposit to constitute, unless it is qualified as, a regulated investment company under the Investment Company Act of 1940, as amended. 4. Such defeasance or covenant defeasance shall not result in a breach or violation of, or constitute a default under, this Indenture or any other agreement or instrument to which the Company is a party or by which it is bound. 5. Such defeasance or covenant defeasance shall not cause any Securities of such series then listed on any registered national securities exchange under the Securities Exchange Act of 1934, as amended, to be delisted. 6. In the case of an election under Section 1302, the Company shall have delivered to the Trustee an Opinion of Counsel stating that (x) the Company has received from, or there has been published by, the Internal Revenue Service a ruling, or (y) since the date of this Indenture there has been a change in the applicable Federal income tax law, in either case to the effect that, and based thereon such opinion shall confirm that, the Holders of the Outstanding Securities of
such series will not recognize income, gain or loss for Federal income tax purposes as a result of such defeasance and will be subject to Federal income tax on the same amounts, in the same manner and at the same times as would have been the case if such defeasance had not occurred. 7. In the case of an election under Section 1303, the Company shall have delivered to the Trustee an Opinion of Counsel to the effect that the Holders of the Outstanding Securities of such series will not recognize income, gain or loss for Federal income tax purposes as a result of such covenant defeasance and will be subject to Federal income tax on the same amounts, in the same manner and at the same times as would have been the case if such covenant defeasance had not occurred. 8. Such defeasance or covenant defeasance shall be effected in compliance with any additional terms, conditions or limitations which may be imposed on the Company in connection therewith pursuant to Section 301. 9. The Company shall have delivered to the Trustee an Officers' Certificate and an Opinion of Counsel, each stating that all conditions precedent provided for relating to either the defeasance under Section 1302 or the covenant defeasance under Section 1303 (as the case may be) have been complied with. 5. Deposited Money and U.S. Government Obligations to Be Held in Trust; Other Miscellaneous Provisions. Subject to the provisions of the last paragraph of Section 1003, all money and U.S. Government Obligations (including the proceeds thereof) deposited with the Trustee (or other qualifying trustee collectively, for purposes of this Section 1305, the "Trustee") pursuant to Section 1304 in respect of the Outstanding Securities of such series shall be held in trust and applied by the Trustee, in accordance with the provisions of such Securities and this Indenture, to the payment, either directly or through any Paying Agent (but not including the Company acting as its own Paying Agent) as the Trustee may determine, to the Holders of such Securities, of all sums due and to become due thereon in respect of principal (and premium, if any) and interest, but such money need not be segregated from other funds except to the extent required by law. The Company shall pay and indemnify the Trustee against any tax, fee or other charge imposed on or assessed against the money or U.S. Government Obligations deposited pursuant to Section 1304 or the principal and interest received in respect thereof. Anything herein to the contrary notwithstanding, the Trustee shall deliver or pay to the Company from time to time upon Company Request any money or U.S. Government Obligations held by it as provided in Section 1304 which, in the opinion of a nationally
recognized firm of independent public accountants expressed in a written certification thereof delivered to the Trustee, are in excess of the amount thereof which would then be required to be deposited to effect an equivalent defeasance or covenant defeasance. Anything herein to the contrary notwithstanding, if and to the extent the deposited money or U.S. Government Obligations (or the proceeds thereof) either (i) cannot be applied by the Trustee in accordance with this Section because of a court order or (ii) are for any reason insufficient in amount, then the Company's obligations to pay principal of (and premium, if any) and interest on the Securities of such series shall be reinstated to the extent necessary to cover the deficiency on any due date for payment. In any case specified in clause (i), the Company's interest in the deposited money and U.S. Government Obligations (and proceeds thereof) shall be reinstated to the extent the Company's payment obligations are reinstated. This instrument may be executed in any number of counterparts, each of which so executed shall be deemed to be an original, but all such counterparts shall together constitute but one and the same instrument. In Witness Whereof, the parties hereto have caused this Indenture to be duly executed, and their respective corporate seals to be hereunto affixed and attested, all as of the day and year first above written.
Chemical Banking Corporation By [Corporate Seal] Attest: The Chase Manhattan Bank (National Association) By [Corporate Seal] Attest: State of New York) )SS.: County Of New York ) On the day of , , before me personally came , to me known, who, being by me duly sworn, did depose and say that he is of Chemical Banking Corporation one of the corporations described in and which executed the foregoing instruments; that he knows the seal of said corporation; that the seal affixed to said instrument is such corporate seal; that it was so affixed by authority of the Board of Directors of said corporation, and that he signed his name thereto by like authority. Notary Public in and for said State [Notarial Seal] State Of New York) )SS.: County Of New York) On the day of , , before me personally came , to me known, who, being by me duly sworn, did depose and say that he is of The Chase Manhattan Bank (National Association) one of the corporations described in and which executed the foregoing instrument; that he knows the seal of said corporation; that the seal affixed to said instrument is such corporate seal; that it was so affixed by authority of the Board of Directors of said corporation, and that he signed his name thereto by like authority. Notary Public in and for said State [Notarial Seal]
Exhibit 4.8(a) - ------------------------------------------------------------------------------- THE CHASE MANHATTAN CORPORATION TO THE BANK OF NEW YORK TRUSTEE ------------------------------------------------ JUNIOR SUBORDINATED INDENTURE DATED AS OF , 1996 ------------------------------------------------ - --------------------------------------------------------------------------------
THE CHASE MANHATTAN CORPORATION Reconciliation and tie between the Trust Indenture Act of 1939 (including cross-references to provisions of Sections 310 to and including 317 which, pursuant to Section 318(c) of the Trust Indenture Act of 1939, as amended by the Trust Reform Act of 1990, are a part of and govern the Indenture whether or not physically contained therein) and the Junior Subordinated Indenture, dated as of , 199 . Trust Indenture Indenture ACT SECTION SECTION - ----------- --------- Section 310 (a) (1), (2) and (5)............ 6.9 (a) (3)......................... Not Applicable (a) (4)......................... Not Applicable (b)............................. 6.8 ................................ 6.10 (c)............................. Not Applicable Section 311 (a)............................. 6.13(a) (b)............................. 6.13(b) (b) (2)......................... 7.3(a) (2) ............................... .7.3(a) (2) Section 312 (a)............................. 7.1 ................................ 7.2(a) (b)............................. 7.2(b) (c)............................. 7.2(c) Section 313 (a)............................. 7.3(a) (b)............................. 7.3(b) (c)............................. 7.3(a), 7.3(b) (d)............................. 7.3(c) Section 314 (a) (1), (2) and (3)............ 7.4 (a) (4)......................... 10.5 (b)............................. Not Applicable (c) (1)......................... 1.2 (c) (2)......................... 1.2 (c) (3)......................... Not Applicable (d)............................. Not Applicable (e)............................. 1.2 (f)............................. Not Applicable Section 315 (a)............................. 6.1(a) (b)............................. 6.2 ................................ 7.3(a) (6) (c)............................. 6.1(b)
TRUST INDENTURE INDENTURE ACT SECTION SECTION - --------------- --------- (d)............................. 6.1(c) (d) (1)......................... 6.1(a) (1) (d) (2)......................... 6.1(c) (2) (d) (3)......................... 6.1(c) (3) (e)............................. 5.14 Section 316 (a)............................. 1.1 (a) (1) (A)..................... 5.12 (a) (1) (B)..................... 5.13 (a) (2)......................... Not Applicable (b)............................. 5.8 (c)............................. 1.4(f) Section 317 (a) (1)......................... 5.3 (a) (2)......................... 5.4 (b)............................. 10.3 Section 318 (a)............................. 1.7 Note: This reconciliation and tie shall not, for any purpose, be deemed to be a part of the Junior Subordinated Indenture.
TABLE OF CONTENTS ----------------- Page ---- ARTICLE I..................... 1 SECTION 1.1. Definitions. .............................................. 1 SECTION 1.2. Compliance Certificate and Opinions. ...................... 9 SECTION 1.3. Forms of Documents Delivered to Trustee. .................. 10 SECTION 1.4. Acts of Holders. .......................................... 10 SECTION 1.5. Notices, Etc. to Trustee and Company. ..................... 12 SECTION 1.6. Notice to Holders; Waiver. ................................ 13 SECTION 1.7. Conflict with Trust Indenture Act. ........................ 13 SECTION 1.8. Effect of Headings and Table of Contents. ................. 13 SECTION 1.9. Successors and Assigns. ................................... 13 SECTION 1.10. Separability Clause. ..................................... 13 SECTION 1.11 Benefits of Indenture. .................................... 13 SECTION 1.12. Governing Law. ........................................... 14 SECTION 1.13. Non-Business Days. ....................................... 14 ARTICLE II..................... 14 SECTION 2.1. Forms Generally. .......................................... 14 SECTION 2.2. Form of Face of Security. ................................. 15 SECTION 2.3. Form of Reverse of Security. .............................. 18 SECTION 2.4. Additional Provisions Required in Global Security. ........ 20 SECTION 2.5. Form of Trustee's Certificate of Authentication. .......... 21 ARTICLE III.................... 21 SECTION 3.1. Title and Terms. .......................................... 21 SECTION 3.2. Denominations. ............................................ 24 SECTION 3.3. Execution, Authentication, Delivery and Dating. ........... 24 SECTION 3.4. Temporary Securities. ..................................... 25 SECTION 3.5. Registration, Transfer and Exchange. ...................... 26 SECTION 3.6. Mutilated, Destroyed, Lost and Stolen Securities. ......... 27 SECTION 3.7. Payment of Interest; Interest Rights Preserved. ........... 28 SECTION 3.8. Persons Deemed Owners. .................................... 29 SECTION 3.9. Cancellation. ............................................. 30 SECTION 3.10. Computation of Interest. ................................. 30 SECTION 3.11. Deferrals of Interest Payment Dates. ..................... 30 SECTION 3.12. Right of Set-Off. ........................................ 31 SECTION 3.13. Agreed Tax Treatment. .................................... 31 SECTION 3.14. Shortening or Extension of Stated Maturity................ 32 SECTION 3.15. CUSIP Numbers. ........................................... 32 - i -
Page ---- ARTICLE IV.................................................. 32 SECTION 4.1. Satisfaction and Discharge of Indenture. ............................................... 32 SECTION 4.2. Application of Trust Money. ............................................................ 34 ARTICLE V.................................................. 34 SECTION 5.1. Events of Default. ..................................................................... 34 SECTION 5.2. Acceleration of Maturity; Rescission and Annulment. .................................... 35 SECTION 5.3. Collection of Indebtedness and Suits for Enforcement by Trustee. ..................................................................................... 36 SECTION 5.4. Trustee May File Proofs of Claim. ...................................................... 37 SECTION 5.5. Trustee May Enforce Claim Without Possession of Securities. ............................ 38 SECTION 5.6. Application of Money Collected. ........................................................ 38 SECTION 5.7. Limitation on Suits. ................................................................... 38 SECTION 5.8. Unconditional Right of Holders to Receive Principal, Premium and Interest; Direct Action by Holders of Preferred Securities. .............................. 39 SECTION 5.9. Restoration of Rights and Remedies. .................................................... 40 SECTION 5.10. Rights and Remedies Cumulative. ....................................................... 40 SECTION 5.11. Delay or Omission Not Waiver. ......................................................... 40 SECTION 5.12. Control by Holders. ................................................................... 40 SECTION 5.13. Waiver of Past Defaults. .............................................................. 41 SECTION 5.14. Undertaking for Costs. ................................................................ 41 SECTION 5.15. Waiver of Usury, Stay or Extension Laws. .............................................. 42 ARTICLE VI.................................................. 42 SECTION 6.1. Certain Duties and Responsibilities. ................................................... 42 SECTION 6.2. Notice of Defaults. .................................................................... 43 SECTION 6.3. Certain Rights of Trustee. ............................................................. 43 SECTION 6.4. Not Responsible for Recitals or Issuance of Securities. ................................ 44 SECTION 6.5. May Hold Securities. ................................................................... 44 SECTION 6.6. Money Held in Trust. ................................................................... 45 SECTION 6.7. Compensation and Reimbursement. ........................................................ 45 SECTION 6.8. Disqualification; Conflicting Interests. ............................................... 45 SECTION 6.9. Corporate Trustee Required; Eligibility. ............................................... 46 SECTION 6.10. Resignation and Removal; Appointment of Successor. .................................... 46 SECTION 6.11. Acceptance of Appointment by Successor. ............................................... 48 SECTION 6.12. Merger, Conversion, Consolidation or Succession to Business. .......................... 49 SECTION 6.13. Preferential Collection of Claims Against Company. .................................... 49 SECTION 6.14. Appointment of Authenticating Agent. .................................................. 49 ARTICLE VII................................................. 51 SECTION 7.1. Company to Furnish Trustee Names and Addresses of Holders............................... 51 SECTION 7.2. Preservation of Information, Communications to Holders. ................................ 51 SECTION 7.3. Reports by Trustee. .................................................................... 51 SECTION 7.4. Reports by Company. .................................................................... 52 - ii -
Page ---- ARTICLE VIII................................................. 52 SECTION 8.1. Company May Consolidate, Etc., Only on Certain Terms. .................................. 52 Section 8.2. Successor Corporation Substituted. ..................................................... 53 ARTICLE IX.................................................. 54 SECTION 9.1. Supplemental Indentures without Consent of Holders. .................................... 54 SECTION 9.2. Supplemental Indentures with Consent of Holders. ....................................... 55 SECTION 9.3. Execution of Supplemental Indentures.................................................... 56 SECTION 9.4. Effect of Supplemental Indentures. ..................................................... 56 SECTION 9.5. Conformity with Trust Indenture Act. ................................................... 56 SECTION 9.6. Reference in Securities to Supplemental Indentures. .................................... 57 ARTICLE X.................................................. 57 SECTION 10.1. Payment of Principal, Premium and Interest. ........................................... 57 SECTION 10.2. Maintenance of Office or Agency. ...................................................... 57 SECTION 10.3. Money for Security Payments to be Held in Trust. ...................................... 58 SECTION 10.4. Statement as to Compliance. ........................................................... 59 SECTION 10.5. Waiver of Certain Covenants. .......................................................... 59 SECTION 10.6. Additional Sums. ...................................................................... 59 SECTION 10.7. Additional Covenants. ................................................................. 60 ARTICLE XI.................................................. 61 SECTION 11.1. Applicability of This Article. ........................................................ 61 SECTION 11.2. Election to Redeem; Notice to Trustee. ................................................ 61 SECTION 11.3. Selection of Securities to be Redeemed. ............................................... 61 SECTION 11.4. Notice of Redemption. ................................................................. 62 SECTION 11.5. Deposit of Redemption Price. .......................................................... 63 SECTION 11.6. Payment of Securities Called for Redemption. .......................................... 63 SECTION 11.7. Right of Redemption of Securities Initially Issued to a Trust. ........................ 63 ARTICLE XII................................................. 64 SECTION 12.1. Applicability of Article. ............................................................. 64 SECTION 12.2. Satisfaction of Sinking Fund Payments with Securities. ................................ 64 SECTION 12.3. Redemption of Securities for Sinking Fund. ............................................ 64 ARTICLE XIII................................................. 66 SECTION 13.1. Securities Subordinate to Senior Debt. ................................................ 66 SECTION 13.2. Payment Over of Proceeds Upon Dissolution, Etc. ....................................... 66 SECTION 13.3. Prior Payment to Senior Debt Upon Acceleration of Securities........................... 67 SECTION 13.4. No Payment When Senior Debt in Default. ............................................... 68 SECTION 13.5. Payment Permitted If No Default. ...................................................... 68 SECTION 13.6. Subrogation to Rights of Holders of Senior Debt. ...................................... 69 SECTION 13.7. Provisions Solely to Define Relative Rights. .......................................... 69 SECTION 13.8. Trustee to Effectuate Subordination. .................................................. 69 - iii -
Page ---- SECTION 13.9. No Waiver of Subordination Provisions. ................................................ 70 SECTION 13.10. Notice to Trustee. .................................................................. 70 SECTION 13.11. Reliance on Judicial Order or Certificate of Liquidating Agent. ....................................................................................... 71 SECTION 13.12. Trustee Not Fiduciary for Holders of Senior Debt. ................................... 71 SECTION 13.13. Rights of Trustee as Holder of Senior Debt; Preservation of Trustee's Rights. ............................................................................ 71 SECTION 13.14. Article Applicable to Paying Agents. ................................................ 71 SECTION 13.15. Certain Conversions or Exchanges Deemed Payment. .................................... 72 - iv -
JUNIOR SUBORDINATED INDENTURE, dated as of , 199 , between THE CHASE MANHATTAN CORPORATION, a Delaware corporation (hereinafter called the "Company") having its principal office at 270 Park Avenue, New York, NY 10017, and THE BANK OF NEW YORK, a national banking association duly organized and existing under the laws of the United States, as Trustee (hereinafter called the "Trustee"). RECITALS OF THE COMPANY The Company has duly authorized the execution and delivery of this Indenture to provide for the issuance from time to time of its unsecured junior subordinated debt securities in series (hereinafter called the "Securities") of substantially the tenor hereinafter provided, including, without limitation, Securities issued to evidence loans made to the Company of the proceeds from the issuance from time to time by one or more business trusts (each a "Trust," and, collectively, the "Trusts") of preferred trust interests in such Trusts (the "Preferred Securities") and common interests in such Trusts (the "Common Securities" and, collectively with the Preferred Securities, the "Trust Securities"), and to provide the terms and conditions upon which the Securities are to be authenticated, issued and delivered. All things necessary to make the Securities, when executed by the Company and authenticated and delivered hereunder and duly issued by the Company, the valid obligations of the Company, and to make this Indenture a valid agreement of the Company, in accordance with their and its terms, have been done. NOW THEREFORE, THIS INDENTURE WITNESSETH: For and in consideration of the premises and the purchase of the Securities by the Holders thereof, it is mutually covenanted and agreed, for the equal and proportionate benefit of all Holders of the Securities or of any series thereof, as follows: ARTICLE I DEFINITIONS AND OTHER PROVISIONS OF GENERAL APPLICATION SECTION 1.1. Definitions. For all purposes of this Indenture, except as otherwise expressly provided or unless the context otherwise requires: (1) The terms defined in this Article have the meanings assigned to them in this Article, and include the plural as well as the singular; (2) All other terms used herein which are defined in the Trust Indenture Act, either directly or by reference therein, have the meanings assigned to them therein; (3) All accounting terms not otherwise defined herein have the meanings assigned to them in accordance with generally accepted accounting principles, and the term "generally accepted
2 accounting principles" with respect to any computation required or permitted hereunder shall mean such accounting principles which are generally accepted at the date or time of such computation; provided, that when two or more principles are so generally accepted, it shall mean that set of principles consistent with those in use by the Company; and (4) The words "herein," "hereof" and "hereunder" and other words of similar import refer to this Indenture as a whole and not to any particular Article, Section or other subdivision. "Act" when used with respect to any Holder has the meaning specified in Section 1.4. "Additional Interest" means the interest, if any, that shall accrue on any interest on the Securities of any series the payment of which has not been made on the applicable Interest Payment Date and which shall accrue at the rate per annum specified or determined as specified in such Security. "Additional Sums" has the meaning specified in Section 10.6. "Additional Taxes" means the sum of any additional taxes, duties and other governmental charges to which a Trust has become subject from time to time as a result of a Tax Event. "Administrative Trustee" means, in respect of any Trust, each Person identified as an "Administrative Trustee" in the related Trust Agreement, solely in such Person's capacity as Administrative Trustee of such Trust under such Trust Agreement and not in such Person's individual capacity, or any successor administrative trustee appointed as therein provided. "Affiliate" of any specified Person means any other Person directly or indirectly controlling or controlled by or under direct or indirect common control with such specified Person; provided, however, no Trust to which Securities have been issued shall be deemed to be an Affiliate of the Company. For the purposes of this definition, "control" when used with respect to any specified Person means the power to direct the management and policies of such Person, directly or indirectly, whether through the ownership of voting securities, by contract or otherwise; and the terms "controlling" and "controlled" have meanings correlative to the foregoing. "Allocable Amounts," when used with respect to any Senior Debt, means all amounts due or to become due on such Senior Debt less, if applicable, any amount which would have been paid to, and retained by, the holders of such Senior Debt (whether as a result of the receipt of payments by the holders of such Senior Debt from the Company or any other obligor thereon or from any holders of, or trustee in respect of, other indebtedness that is subordinate and junior in right of payment to such Senior Debt pursuant to any provision of such indebtedness for the payment over of amounts received on account of such indebtedness to the holders of such Senior Debt or otherwise) but for the fact that such Senior Debt is subordinate or junior in right of payment to (or subject to a requirement that amounts received on such Senior Debt be paid over to obligees on) trade accounts payable or accrued liabilities arising in the ordinary course of business.
3 "Authenticating Agent" means any Person authorized by the Trustee pursuant to Section 6.14 to act on behalf of the Trustee to authenticate Securities of one or more series. "Board of Directors" means either the board of directors of the Company or any committee of that board duly authorized to act hereunder. "Board Resolution" means a copy of a resolution certified by the Secretary or an Assistant Secretary of the Company to have been duly adopted by the Board of Directors, or such committee of the Board of Directors or officers of the Company to which authority to act on behalf of the Board of Directors has been delegated, and to be in full force and effect on the date of such certification, and delivered to the Trustee. "Business Day" means any day other than (i) a Saturday or Sunday, (ii) a day on which banking institutions in The City of New York are authorized or required by law or executive order to remain closed or (iii) a day on which the Corporate Trust Office of the Trustee, or, with respect to the Securities of a series initially issued to a Trust, the principal office of the Property Trustee under the related Trust Agreement, is closed for business. "Commission" means the Securities and Exchange Commission, as from time to time constituted, created under the Exchange Act, or if at any time after the execution of this instrument such Commission is not existing and performing the duties now assigned to it under the Trust Indenture Act, then the body performing such duties on such date. "Common Securities" has the meaning specified in the first recital of this Indenture. "Common Stock" means the common stock[, par value $ per share,] [, without par value,] of the Company. "Company" means the Person named as the "Company" in the first paragraph of this instrument until a successor corporation shall have become such pursuant to the applicable provisions of this Indenture, and thereafter "Company" shall mean such successor corporation. "Company Request" and "Company Order" mean, respectively, the written request or order signed in the name of the Company by the Chairman of the Board of Directors, the Vice Chairman of the Board of Directors, its President or a Vice President, and by its Treasurer, an Assistant Treasurer, its Secretary or an Assistant Secretary of the Company, and delivered to the Trustee. "Corporate Trust Office" means the principal office of the Trustee at which at any particular time its corporate trust business shall be administered. "corporation" includes a corporation, association, company, joint-stock company or business trust. "Debt" means, with respect to any Person, whether recourse is to all or a portion of the assets of such Person and whether or not contingent, (i) every obligation of such Person for
4 money borrowed; (ii) every obligation of such Person evidenced by bonds, debentures, notes or other similar instruments, including obligations incurred in connection with the acquisition of property, assets or businesses; (iii) every reimbursement obligation of such Person with respect to letters of credit, bankers' acceptances or similar facilities issued for the account of such Person; (iv) every obligation of such Person issued or assumed as the deferred purchase price of property or services (but excluding trade accounts payable or accrued liabilities arising in the ordinary course of business); (v) every capital lease obligation of such Person; (vi) all indebtedness of the Company, whether incurred on or prior to the date of this Indenture or thereafter incurred, for claims in respect of derivative products, including interest rate, foreign exchange rate and commodity forward contracts, options and swaps and similar arrangements; and (vii) every obligation of the type referred to in clauses (i) through (vi) of another Person and all dividends of another Person the payment of which, in either case, such Person has guaranteed or is responsible or liable for, directly or indirectly, as obligor or otherwise. "Defaulted Interest" has the meaning specified in Section 3.7. "Depositary" means, with respect to the Securities of any series issuable or issued in whole or in part in the form of one or more Global Securities, the Person designated as Depositary by the Company pursuant to Section 3.1 with respect to such series (or any successor thereto). "Discount Security" means any security which provides for an amount less than the principal amount thereof to be due and payable upon a declaration of acceleration of the Maturity thereof pursuant to Section 5.2. "Distributions," with respect to the Trust Securities issued by an Trust, means amounts payable in respect of such Trust Securities as provided in the related Trust Agreement and referred to therein as "Distributions." "Dollar" means the currency of the United States of America that, as at the time of payment, is legal tender for the payment of public and private debts. "Event of Default" unless otherwise specified in the supplemental indenture creating a series of Securities has the meaning specified in Article V. "Exchange Act" means the Securities Exchange Act of 1934 and any statute successor thereto, in each case as amended from time to time. "Extension Period" has the meaning specified in Section 3.11. "Global Security" means a Security in the form prescribed in Section 2.4 evidencing all or part of a series of Securities, issued to the Depository or its nominee for such series, and registered in the name of such Depository or its nominee.
5 "Guarantee" means the guarantee by the Company of distributions on the Preferred Securities of a Trust to the extent provided in the Guarantee Agreement. "Guarantee Agreement" means the Guarantee Agreement substantially in the form attached hereto as Annex C, or substantially in such form as may be specified as contemplated by Section 3.1 with respect to the Securities of any series, in each case as amended from time to time. "Holder" means a Person in whose name a Security is registered in the Securities Register. "Indenture" means this instrument as originally executed or as it may from time to time be supplemented or amended by one or more indentures supplemental hereto entered into pursuant to the applicable provisions hereof and shall include the terms of each particular series of Securities established as contemplated by Section 3.1. "Interest Payment Date" means as to each series of Securities the Stated Maturity of an installment of interest on such Securities. "Junior Subordinated Payment" has the meaning specified in Section 13.2. "Maturity" when used with respect to any Security means the date on which the principal of such Security becomes due and payable as therein or herein provided, whether at the Stated Maturity or by declaration of acceleration, call for redemption or otherwise. "Moody's" means Moody's Investors Service, Inc. "Notice of Default" means a written notice of the kind specified in Section 5.1(3). "Officers' Certificate" means a certificate signed by the Chairman of the Board of Directors , a Vice Chairman of the Board of Directors, the President or a Vice President, and by the Treasurer, an Assistant Treasurer, the Secretary or an Assistant Secretary of the Company, and delivered to the Trustee. "Opinion of Counsel" means a written opinion of counsel, who may be counsel for the Company, and who shall be acceptable to the Trustee. "Original Issue Date" means the date of issuance specified as such in each Security. "Outstanding" means, when used in reference to any Securities, as of the date of determination, all Securities theretofore authenticated and delivered under this Indenture, except: (i) Securities theretofore canceled by the Trustee or delivered to the Trustee for cancellation;
6 (ii) Securities for whose payment money in the necessary amount has been theretofore deposited with the Trustee or any Paying Agent in trust for the Holders of such Securities; and (iii) Securities in substitution for or in lieu of which other Securities have been authenticated and delivered or which have been paid pursuant to Section 3.6, unless proof satisfactory to the Trustee is presented that any such Securities are held by Holders in whose hands such Securities are valid, binding and legal obligations of the Company; provided, however, that in determining whether the Holders of the requisite principal amount of Outstanding Securities have given any request, demand, authorization, direction, notice, consent or waiver hereunder, Securities owned by the Company or any other obligor upon the Securities or any Affiliate of the Company or such other obligor shall be disregarded and deemed not to be Outstanding, except that, in determining whether the Trustee shall be protected in relying upon any such request, demand, authorization, direction, notice, consent or waiver, only Securities which the Trustee knows to be so owned shall be so disregarded. Securities so owned which have been pledged in good faith may be regarded as Outstanding if the pledgee establishes to the satisfaction of the Trustee the pledgee's right so to act with respect to such Securities and that the pledgee is not the Company or any other obligor upon the Securities or any Affiliate of the Company or such other obligor. Upon the written request of the Trustee, the Company shall furnish to the Trustee promptly an Officers' Certificate listing and identifying all Securities, if any, known by the Company to be owned or held by or for the account of the Company, or any other obligor on the Securities or any Affiliate of the Company or such obligor, and, subject to the provisions of Section 6.1, the Trustee shall be entitled to accept such Officers' Certificate as conclusive evidence of the facts therein set forth and of the fact that all Securities not listed therein are Outstanding for the purpose of any such determination. "Paying Agent" means the Trustee or any Person authorized by the Company to pay the principal of or interest on any Securities on behalf of the Company. "Person" means any individual, corporation, partnership, joint venture, trust, unincorporated organization or government or any agency or political subdivision thereof. "Place of Payment" means, with respect to the Securities of any series, the place or places where the principal of (and premium, if any) and interest on the Securities of such series are payable pursuant to Sections 3.1 and 3.11. "Predecessor Security" of any particular Security means every previous Security evidencing all or a portion of the same debt as that evidenced by such particular Security; and, for the purposes of this definition, any security authenticated and delivered under Section 3.6 in lieu of a lost, destroyed or stolen Security shall be deemed to evidence the same debt as the lost, destroyed or stolen Security. "Preferred Securities" has the meaning specified in the first recital of this Indenture. "Proceeding" has the meaning specified in Section 13.2.
7 "Property Trustee" means, in respect of any Trust, the commercial bank or trust company identified as the "Property Trustee" in the related Trust Agreement, solely in its capacity as Property Trustee of such Trust under such Trust Agreement and not in its individual capacity, or its successor in interest in such capacity, or any successor property trustee appointed as therein provided. "Redemption Date," when used with respect to any Security to be redeemed, means the date fixed for such redemption by or pursuant to this Indenture. "Redemption Price," when used with respect to any Security to be redeemed, means the price at which it is to be redeemed pursuant to this Indenture. "Regular Record Date" for the interest payable on any Interest Payment Date with respect to the Securities of a series means, unless otherwise provided pursuant to Section 3.1 with respect to Securities of a series, (i) in the case of Securities of a series represented by one or more Global Securities, the Business Day next preceding such Interest Payment Date and (ii) in the case of Securities of a series not represented by one or more Global Securities, the date which is fifteen days next preceding such Interest Payment Date (whether or not a Business Day). "Responsible Officer" when used with respect to the Trustee means any officer of the Trustee assigned by the Trustee from time to time to administer its corporate trust matters. "Rights Plan" means a plan of the Company providing for the issuance by the Company to all holders of its Common Stock of rights entitling the holders thereof to subscribe for or purchase shares of Common Stock or any class or series of preferred stock, which rights (i) are deemed to be transferred with such shares of Common Stock, (ii) are not exercisable and (iii) are also issued in respect of future issuances of Common Stock, in each case until the occurrence of a specified event or events. "S&P" means Standard & Poor's Ratings Services. "Securities" or "Security" means any debt securities or debt security, as the case may be, authenticated and delivered under this Indenture. "Securities Register" and "Securities Registrar" have the respective meanings specified in Section 3.5. "Senior Debt" means the principal of (and premium, if any) and interest, if any (including interest accruing on or after the filing of any petition in bankruptcy or for reorganization relating to the Company whether or not such claim for post-petition interest is allowed in such proceeding), on Debt of the Company, whether incurred on or prior to the date of this Indenture or thereafter incurred, unless, in the instrument creating or evidencing the same or pursuant to which the same is outstanding, it is provided that such obligations are not superior in right of payment to the Securities or to other Debt which is pari passu with, or subordinated to, the Securities, provided, however, that Senior Debt shall not be deemed to include (a) any Debt of the Company which, when incurred and without respect to any election under Section 1111(b)
8 of the Bankruptcy Reform Act of 1978, was without recourse to the Company, (b) any Debt of the Company to any of its Subsidiaries, (c) Debt to any employee of the Company, and (d) any Securities. "Special Record Date" for the payment of any Defaulted Interest means a date fixed by the Trustee pursuant to Section 3.7. "Stated Maturity" when used with respect to any Security or any installment of principal thereof or interest thereon means the date specified pursuant to the terms of such Security as the date on which the principal of such Security or such installment of interest is due and payable, in the case of such principal, as such date may be shortened or extended as provided pursuant to the terms of such Security and this Indenture. "Subsidiary" means a corporation more than 50% of the outstanding voting stock of which is owned, directly or indirectly, by the Company or by one or more other Subsidiaries, or by the Company and one or more other Subsidiaries. For purposes of this definition, "voting stock" means stock which ordinarily has voting power for the election of directors, whether at all times or only so long as no senior class of stock has such voting power by reason of any contingency. "Tax Event" means the receipt by a Trust of an Opinion of Counsel (as defined in the relevant Trust Agreement) experienced in such matters to the effect that, as a result of any amendment to, or change (including any announced prospective change) in, the laws (or any regulations thereunder) of the United States or any political subdivision or taxing authority thereof or therein, or as a result of any official administrative pronouncement or judicial decision interpreting or applying such laws or regulations, which amendment or change is effective or which pronouncement or decision is announced on or after the date of issuance of the Preferred Securities of such Trust, there is more than an insubstantial risk that (i) such Trust is, or will be within 90 days of the date of such Opinion of Counsel, subject to United States Federal income tax with respect to income received or accrued on the corresponding series of Securities issued by the Company to such Trust, (ii) interest payable by the Company on such corresponding series of Securities is not, or within 90 days of the date of such Opinion of Counsel, will not be, deductible by the Company, in whole or in part, for United States Federal income tax purposes or (iii) such Trust is, or will be within 90 days of the date of such Opinion of Counsel, subject to more than a de minimis amount of other taxes, duties or other governmental charges. "Trust" has the meaning specified in the first recital of this Indenture. "Trust Agreement" means the Trust Agreement substantially in the form attached hereto as Annex A, as amended by the form of Amended and Restated Trust Agreement substantially in the form attached hereto as Annex B, or substantially in such form as may be specified as contemplated by Section 3.1 with respect to the Securities of any series, in each case as amended from time to time.
9 "Trustee" means the Person named as the "Trustee" in the first paragraph of this instrument until a successor Trustee shall have become such pursuant to the applicable provisions of this Indenture, and thereafter "Trustee" shall mean or include each Person who is then a Trustee hereunder and, if at any time there is more than one such Person, "Trustee" as used with respect to the Securities of any series shall mean the Trustee with respect to Securities of that series. "Trust Indenture Act" means the Trust Indenture Act of 1939 (15 U.S.C. " 77aaa-77bbb), as amended and as in effect on the date as of this Indenture, except as provided in Section 9.5. "Trust Securities" has the meaning specified in the first recital of this Indenture. "Vice President" when used with respect to the Company, means any duly appointed vice president, whether or not designated by a number or a word or words added before or after the title "vice president." SECTION 1.2. Compliance Certificate and Opinions. Upon any application or request by the Company to the Trustee to take any action under any provision of this Indenture, the Company shall furnish to the Trustee an Officers' Certificate stating that all conditions precedent (including covenants, compliance with which constitutes a condition precedent), if any, provided for in this Indenture relating to the proposed action have been complied with and an Opinion of Counsel stating that in the opinion of such counsel all such conditions precedent (including covenants compliance with which constitute a condition precedent), if any, have been complied with, except that in the case of any such application or request as to which the furnishing of such documents is specifically required by any provision of this Indenture relating to such particular application or request, no additional certificate or opinion need be furnished. Every certificate or opinion with respect to compliance with a condition or covenant provided for in this Indenture (other than the certificates provided pursuant to Section 10.5) shall include: (1) a statement that each individual signing such certificate or opinion has read such covenant or condition and the definitions herein relating thereto; (2) a brief statement as to the nature and scope of the examination or investigation upon which the statements or opinions contained in such certificate or opinion are based; (3) a statement that, in the opinion of each such individual, he has made such examination or investigation as is necessary to enable him to express an informed opinion as to whether or not such covenant or condition has been complied with; and (4) a statement as to whether, in the opinion of each such individual, such condition or covenant has been complied with.
10 SECTION 1.3. Forms of Documents Delivered to Trustee. In any case where several matters are required to be certified by, or covered by an opinion of, any specified Person, it is not necessary that all such matters be certified by, or covered by the opinion of, only one such Person, or that they be so certified or covered by only one document, but one such Person may certify or give an opinion with respect to some matters and one or more other such Persons as to other matters, and any such Person may certify or give an opinion as to such matters in one or several documents. Any certificate or opinion of an officer of the Company may be based, insofar as it relates to legal matters, upon a certificate or opinion of, or representations by, counsel, unless such officer knows, or in the exercise of reasonable care should know, that the certificate or opinion or representations with respect to matters upon which his certificate or opinion is based are erroneous. Any such certificate or Opinion of Counsel may be based, insofar as it relates to factual matters, upon a certificate or opinion of, or representations by, an officer or officers of the Company stating that the information with respect to such factual matters is in the possession of the Company, unless such counsel knows, or in the exercise of reasonable care should know, that the certificate or opinion or representations with respect to such matters are erroneous. Where any Person is required to make, give or execute two or more applications, requests, consents, certificates, statements, opinions, or other instruments under this Indenture, they may, but need not, be consolidated and form one instrument. SECTION 1.4. Acts of Holders. (a) Any request, demand, authorization, direction, notice, consent, waiver or other action provided by this Indenture to be given to or taken by Holders may be embodied in and evidenced by one or more instruments of substantially similar tenor signed by such Holders in person or by an agent duly appointed in writing; and, except as herein otherwise expressly provided, such action shall become effective when such instrument or instruments is or are delivered to the Trustee, and, where it is hereby expressly required, to the Company. Such instrument or instruments (and the action embodied therein and evidenced thereby) are herein sometimes referred to as the "Act" of the Holders signing such instrument or instruments. Proof of execution of any such instrument or of a writing appointing any such agent shall be sufficient for any purpose of this Indenture and (subject to Section 6.1) conclusive in favor of the Trustee and the Company, if made in the manner provided in this Section. (b) The fact and date of the execution by any Person of any such instrument or writing may be proved by the affidavit of a witness of such execution or by the certificate of any notary public or other officer authorized by law to take acknowledgments of deeds, certifying that the individual signing such instrument or writing acknowledged to him the execution thereof. Where such execution is by a Person acting in other than his individual capacity, such certificate or affidavit shall also constitute sufficient proof of his authority.
11 (c) The fact and date of the execution by any Person of any such instrument or writing, or the authority of the Person executing the same, may also be proved in any other manner which the Trustee deems sufficient and in accordance with such reasonable rules as the Trustee may determine. (d) The ownership of Securities shall be proved by the Securities Register. (e) Any request, demand, authorization, direction, notice, consent, waiver or other action by the Holder of any Security shall bind every future Holder of the same Security and the Holder of every Security issued upon the transfer thereof or in exchange therefor or in lieu thereof in respect of anything done or suffered to be done by the Trustee or the Company in reliance thereon, whether or not notation of such action is made upon such Security. (f) The Company may set any day as a record date for the purpose of determining the Holders of Outstanding Securities of any series entitled to give, make or take any request, demand, authorization, direction, notice, consent, waiver or other action provided or permitted by this Indenture to be given, made or taken by Holders of Securities of such series, provided that the Company may not set a record date for, and the provisions of this paragraph shall not apply with respect to, the giving or making of any notice, declaration, request or direction referred to in the next paragraph. If any record date is set pursuant to this paragraph, the Holders of Outstanding Securities of the relevant series on such record date, and no other Holders, shall be entitled to take the relevant action, whether or not such Holders remain Holders after such record date, provided that no such action shall be effective hereunder unless taken on or prior to the applicable Expiration Date by Holders of the requisite principal amount of Outstanding Securities of such series on such record date. Nothing in this paragraph shall be construed to prevent the Company from setting a new record date for any action for which a record date has previously been set pursuant to this paragraph (whereupon the record date previously set shall automatically and with no action by any Person be cancelled and of no effect), and nothing in this paragraph shall be construed to render ineffective any action taken by Holders of the requisite principal amount of Outstanding Securities of the relevant series on the date such action is taken. Promptly after any record date is set pursuant to this paragraph, the Company, at its own expense, shall cause notice of such record date, the proposed action by Holders and the applicable Expiration Date to be given to the Trustee in writing and to each Holder of Securities of the relevant series in the manner set forth in Section 1.6. The Trustee may set any day as a record date for the purpose of determining the Holders of Outstanding Securities of any series entitled to join in the giving or making of (i) any Notice of Default, (ii) any declaration of acceleration referred to in Section 5.2, (iii) any request to institute proceedings referred to in Section 5.7(2) or (iv) any direction referred to in Section 5.12, in each case with respect to Securities of such series. If any record date is set pursuant to this paragraph, the Holders of Outstanding Securities of such series on such record date, and no other Holders, shall be entitled to join in such notice, declaration, request or direction, whether or not such Holders remain Holders after such record date, provided that no such action shall be effective hereunder unless taken on or prior to the applicable Expiration Date by Holders of the requisite principal amount of Outstanding Securities of such series on such record date. Nothing in this paragraph shall be construed to prevent the Trustee from setting a new record date for any
12 action for which a record date has previously been set pursuant to this paragraph (whereupon the record date previously set shall automatically and with no action by any Person be cancelled and of no effect), and nothing in this paragraph shall be construed to render ineffective any action taken by Holders of the requisite principal amount of Outstanding Securities of the relevant series on the date such action is taken. Promptly after any record date is set pursuant to this paragraph, the Trustee, at the Company's expense, shall cause notice of such record date, the proposed action by Holders and the applicable Expiration Date to be given to the Company in writing and to each Holder of Securities of the relevant series in the manner set forth in Section 1.6. With respect to any record date set pursuant to this Section, the party hereto which sets such record dates may designate any day as the "Expiration Date" and from time to time may change the Expiration Date to any earlier or later day, provided that no such change shall be effective unless notice of the proposed new Expiration Date is given to the other party hereto in writing, and to each Holder of Securities of the relevant series in the manner set forth in Section 10.6, on or prior to the existing Expiration Date. If an Expiration Date is not designated with respect to any record date set pursuant to this Section, the party hereto which set such record date shall be deemed to have initially designated the 180th day after such record date as the Expiration Date with respect thereto, subject to its right to change the Expiration Date as provided in this paragraph. Notwithstanding the foregoing, no Expiration Date shall be later than the 180th day after the applicable record date. (g) Without limiting the foregoing, a Holder entitled hereunder to take any action hereunder with regard to any particular Security may do so with regard to all or any part of the principal amount of such Security or by one or more duly appointed agents each of which may do so pursuant to such appointment with regard to all or any part of such principal amount. SECTION 1.5. Notices, Etc. to Trustee and Company. Any request, demand, authorization, direction, notice, consent, waiver or Act of Holders or other document provided or permitted by this Indenture to be made upon, given or furnished to, or filed with, (1) the Trustee by any Holder, any holder of Preferred Securities or the Company shall be sufficient for every purpose hereunder if made, given, furnished or filed in writing to or with the Trustee at its Corporate Trust office, or (2) the Company by the Trustee, any Holder or any holder of Preferred Securities shall be sufficient for every purpose (except as otherwise provided in Section 5.1) hereunder if in writing and mailed, first class, postage prepaid, to the Company addressed to it at the address of its principal office specified in the first paragraph of this instrument or at any other address previously furnished in writing to the Trustee by the Company.
13 SECTION 1.6. Notice to Holders; Waiver. Where this Indenture provides for notice to Holders of any event, such notice shall be sufficiently given (unless otherwise herein expressly provided) if in writing and mailed, first class postage prepaid, to each Holder affected by such event, at the address of such Holder as it appears in the Securities Register, not later than the latest date, and not earlier than the earliest date, prescribed for the giving of such notice. In any case where notice to Holders is given by mail, neither the failure to mail such notice, nor any defect in any notice so mailed, to any particular Holder shall affect the sufficiency of such notice with respect to other Holders. Where this Indenture provides for notice in any manner, such notice may be waived in writing by the Person entitled to receive such notice, either before or after the event, and such waiver shall be the equivalent of such notice. Waivers of notice by Holders shall be filed with the Trustee, but such filing shall not be a condition precedent to the validity of any action taken in reliance upon such waiver. SECTION 1.7. Conflict with Trust Indenture Act. If any provision of this Indenture limits, qualifies or conflicts with the duties imposed by any of Sections 310 to 317, inclusive, of the Trust Indenture Act through operation of Section 318(c) thereof, such imposed duties shall control. SECTION 1.8. Effect of Headings and Table of Contents. The Article and Section headings herein and the Table of Contents are for convenience only and shall not affect the construction hereof. SECTION 1.9. Successors and Assigns. All covenants and agreements in this Indenture by the Company shall bind its successors and assigns, whether so expressed or not. SECTION 1.10. Separability Clause. In case any provision in this Indenture or in the Securities shall be invalid, illegal or unenforceable, the validity, legality and enforceability of the remaining provisions shall not in any way be affected or impaired thereby. SECTION 1.11 Benefits of Indenture. Nothing in this Indenture or in the Securities, express or implied, shall give to any Person, other than the parties hereto and their successors and assigns, the holders of Senior Debt, the Holders of the Securities and, to the extent expressly provided in Sections 5.2, 5.8, 5.9, 5.11, 5.13, 9.1 and 9.2, the holders of Preferred Securities, any benefit or any legal or equitable right, remedy or claim under this Indenture.
14 SECTION 1.12. Governing Law. This Indenture and the Securities shall be governed by and construed in accordance with the laws of the State of New York. SECTION 1.13. Non-Business Days. In any case where any Interest Payment Date, Redemption Date or Stated Maturity of any Security shall not be a Business Day, then (notwithstanding any other provision of this Indenture or the Securities) payment of interest or principal (and premium, if any) need not be made on such date, but may be made on the next succeeding Business Day (and no interest shall accrue for the period from and after such Interest Payment Date, Redemption Date or Stated Maturity, as the case may be, until such next succeeding Business Day except that, if such Business Day is in the next succeeding calendar year, such payment shall be made on the immediately preceding Business Day (in each case with the same force and effect as if made on the Interest Payment Date or Redemption Date or at the Stated Maturity). ARTICLE II SECURITY FORMS SECTION 2.1. Forms Generally. The Securities of each series and the Trustee's certificate of authentication shall be in substantially the forms set forth in this Article, or in such other form or forms as shall be established by or pursuant to a Board Resolution or in one or more indentures supplemental hereto, in each case with such appropriate insertions, omissions, substitutions and other variations as are required or permitted by this Indenture and may have such letters, numbers or other marks of identification and such legends or endorsements placed thereon as may be required to comply with applicable tax laws or the rules of any securities exchange or as may, consistently herewith, be determined by the officers executing such securities, as evidenced by their execution of the Securities. If the form of Securities of any series is established by action taken pursuant to a Board Resolution, a copy of an appropriate record of such action shall be certified by the Secretary or an Assistant Secretary of the Company and delivered to the Trustee at or prior to the delivery of the Company Order contemplated by Section 3.3 with respect to the authentication and delivery of such Securities. The Trustee's certificates of authentication shall be substantially in the form set forth in this Article. The definitive Securities shall be printed, lithographed or engraved or produced by any combination of these methods, if required by any securities exchange on which the Securities may be listed, on a steel engraved border or steel engraved borders or may be produced in any other manner permitted by the rules of any securities exchange on which the Securities may be
15 listed, all as determined by the officers executing such Securities, as evidenced by their execution of such securities. SECTION 2.2. Form of Face of Security. THE CHASE MANHATTAN CORPORATION % JUNIOR SUBORDINATED DEFERRABLE INTEREST DEBENTURES No. $ THE CHASE MANHATTAN CORPORATION, a corporation organized and existing under the laws of the state of Delaware (hereinafter called the "Company", which term includes any successor corporation under the Indenture hereinafter referred to), for value received, hereby promises to pay to , or registered assigns, the principal sum of Dollars on , 2026; provided that the Company may (i) shorten the Stated Maturity of the principal of this Security to a date not earlier than , 2001 and (ii) extend the Stated Maturity of the principal of this Security at any time on one or more occasions, subject to certain conditions specified in Section 3.14 of the Indenture, but in no event to a date later than , 2045. The Company further promises to pay interest on said principal sum from , or from the most recent interest payment date (each such date, an "Interest Payment Date") on which interest has been paid or duly provided for, quarterly (subject to deferral as set forth herein) in arrears on March 31, June 30, September 30 and December 31 of each year, commencing March 31, 1997, at the rate of % per annum, until the principal hereof shall have become due and payable, plus Additional Interest, if any, until the principal hereof is paid or duly provided for or made available for payment and on any overdue principal and (without duplication and to the extent that payment of such interest is enforceable under applicable law) on any overdue installment of interest at the rate of % per annum, compounded quarterly. The amount of interest payable for any period shall be computed on the basis of twelve 30-day months and a 360-day year. The amount of interest payable for any partial period shall be computed on the basis of the number of days elapsed in a 360-day year of twelve 30-day months. In the event that any date on which interest is payable on this Security is not a Business Day, then a payment of the interest payable on such date will be made on the next succeeding day which is a Business Day (and without any interest or other payment in respect of any such delay), except that, if such Business Day is in the next succeeding calendar year, such payment shall be made on the immediately preceding Business Day, in each case with the same force and effect as if made on the date the payment was originally payable. A "Business Day" shall mean any day other than (i) a Saturday or Sunday, (ii) a day on which banking institutions in The City of New York are authorized or required by law or exective order to remain closed or (iii) a day on which the Corporate Trust Office of the Trustee or the Property Trustee under the Trust Agreement hereinafter referred to for Chase Capital I, is closed for business. The interest installment so payable, and punctually paid or duly provided for, on any Interest Payment Date will, as provided in the Indenture, be paid to the Person in whose name this Security (or one or more Predecessor Securities is registered at the close of business on the Regular Record Date for such interest installment, which shall be, unless otherwise provided pursuant to Section 3.1 of the Junior Subordinated Indenture, dated as of , 199 (herein called the "Indenture") between the Company and The Bank of New York, as Trustee (herein called the
16 "Trustee", which term includes any successor trustee under the Indenture), with respect to Securities of a series, (i) in the case of Securities of a series represented by one or more Global Securities, the Business Day next preceding such Interest Payment Date and (ii) in the case of Securities of a series not represented by one or more Global Securities, the date which is fifteen days next preceding such Interest Payment Date (whether or not a Business Day). Any such interest installment not so punctually paid or duly provided for shall forthwith cease to be payable to the Holder on such Regular Record Date and may either be paid to the Person in whose name this Security (or one or more Predecessor Securities) is registered at the close of business on a Special Record Date for the payment of such Defaulted Interest to be fixed by the Trustee, notice whereof shall be given to Holders of Securities of this series not less than 10 days prior to such Special Record Date, or be paid at any time in any other lawful manner not inconsistent with the requirements of any securities exchange on which the Securities of this series may be listed, and upon such notice as may be required by such exchange, all as more fully provided in said Indenture. So long as no Event of Default has occurred and is continuing, the Company shall have the right at any time during the term of this Security to defer payment of interest on this Security, at any time or from time to time, for up to 20 consecutive quarterly interest payment periods with respect to each deferral period (each an "Extension Period"), during which Extension Periods the Company shall have the right to make partial payments of interest on any Interest Payment Date, and at the end of which the Company shall pay all interest then accrued and unpaid (together with Additional Interest thereon to the extent permitted by applicable law); provided, however, that no Extension Period shall extend beyond the Stated Maturity of the principal of this Security; provided, further, that during any such Extension Period, the Company shall not, and shall not permit any Subsidiary of the Company to, (i) declare or pay any dividends or distributions or redeem, purchase, acquire or make a liquidation payment with respect to, any of the Company's capital stock or (ii) make any payment of principal of or interest or premium, if any, on or repay, repurchase or redeem any debt security of the Company that ranks pari passu with or junior in interest to this Security or make any guarantee payments with respect to any guarantee by the Company of the debt securities of any Subsidiaries of the Company if such guarantee ranks pari passu with or junior in interest to this Security (other than (a) dividends or distributions in Common Stock, (b) any declaration of a dividend in connection with the implementation of a Rights Plan, the issuance of any Common Stock or any class or series of preferred stock of the Company under any Rights Plan or the repurchase of any rights distributed pursuant to a Rights Plan, (c) payments under any Guarantee, and (d) purchases of Common Stock related to the issuance of Common Stock under any of the Company's benefit plans for its directors, officers or employees. Prior to the termination of any such Extension Period, the Company may further extend the interest payment period, provided that no Extension Period shall exceed beyond the Stated Maturity of the principal of this Security. Upon the termination of any such Extension Period and upon the payment of all accrued and unpaid interest and any Additional Interest then due, the Company may elect to begin a new Extension Period, subject to the above requirements. No interest shall be due and payable during an Extension Period except at the end thereof. The Company shall give the Holder of this Security and the Trustee notice of its election to begin any Extension Period at least one Business Day prior to the next succeeding Interest Payment Date on which interest on this Security would be payable but for such deferral or, with respect to the Securities issued to a Trust, so long as such
17 Securities are held by such Trust, prior to the earlier of (i) the next succeeding date on which Distributions on the Preferred Securities would be payable but for such deferral or (ii) the date the Administrative Trustees are required to give notice to any securities exchange or other applicable self-regulatory organization or to holders of such Preferred Securities of the record date or the date such Distributions are payable, but in any event not less than one Business Day prior to such record date. Payment of the principal of (and premium, if any) and interest on this Security will be made at the office or agency of the Company maintained for that purpose in the United States, in such coin or currency of the United States of America as at the time of payment is legal tender for payment of public and private debts [if applicable, insert C; provided, however, that at the option of the Company payment of interest may be made (i) by check mailed to the address of the Person entitled thereto as such address shall appear in the Securities Register or (ii) by wire transfer in immediately available funds at such place and to such account as may be designated by the Person entitled thereto as specified in the Securities Register]. The indebtedness evidenced by this Security is, to the extent provided in the Indenture, subordinate and subject in right of payments to the prior payment in full of all Senior Debt, and this Security is issued subject to the provisions of the Indenture with respect thereto. Each Holder of this Security, by accepting the same, (a) agrees to and shall be bound by such provisions, (b) authorizes and directs the Trustee on his behalf to take such actions as may be necessary or appropriate to effectuate the subordination so provided and (c) appoints the Trustee his attorney-in-fact for any and all such purposes. Each Holder hereof, by his acceptance hereof, waives all notice of the acceptance of the subordination provisions contained herein and in the Indenture by each holder of Senior Debt, whether now outstanding or hereafter incurred, and waives reliance by each such holder upon said provisions. Reference is hereby made to the further provisions of this Security set forth on the reverse hereof, which further provisions shall for all purposes have the same effect as if set forth at this place. Unless the certificate of authentication hereon has been executed by the Trustee referred to on the reverse hereof by manual signature, this Security shall not be entitled to any benefit under the Indenture or be valid or obligatory for any purpose. IN WITNESS WHEREOF, the Company has caused this instrument to be duly executed under its corporate seal. THE CHASE MANHATTAN CORPORATION By:----------------------------- [President or Vice President] Attest:
18 - ------------------------------------------- [Secretary or Assistant Secretary] SECTION 2.3. Form of Reverse of Security. This Security is one of a duly authorized issue of securities of the Company (herein called the "Securities"), issued and to be issued in one or more series under the Indenture, to which Indenture and all indentures supplemental thereto reference is hereby made for a statement of the respective rights, limitations of rights, duties and immunities thereunder of the Trustee, the Company and the Holders of the Securities, and of the terms upon which the Securities are, and are to be, authenticated and delivered. This Security is one of the series designated on the face hereof [, limited in aggregate principal amount to $ ]. All terms used in this Security that are defined in the Indenture or in the Amended and Restated Trust Agreement, dated as of , 1996, as amended (the "Trust Agreement"), for Chase Capital I among The Chase Manhattan Corporation, as Depositor, and the Trustees named therein, shall have the meanings assigned to them in the Indenture or the Trust Agreement, as the case may be. The Company may at any time, at its option, on or after , , and subject to the terms and conditions of Article XI of the Indenture, redeem this Security in whole at any time or in part from time to time, without premium or penalty, at a redemption price equal to 100% of the principal amount thereof plus accrued and unpaid interest, including Additional Interest, if any to the Redemption Date. Upon the occurrence and during the continuation of a Tax Event in respect of a Trust, the Company may, at its option, at any time within 90 days of the occurrence of such Tax Event redeem this Security, in whole but not in part, subject to the provisions of Section 11.7 and the other provisions of Article XI of the Indenture, at a redemption price equal to 100% of the principal amount thereof plus accrued and unpaid interest, including Additional Interest, if any, to the Redemption Date. In the event of redemption of this Security in part only, a new Security or Securities of this series for the unredeemed portion hereof will be issued in the name of the Holder hereof upon the cancellation hereof. The Indenture contains provisions for satisfaction and discharge of the entire indebtedness of this Security upon compliance by the Company with certain conditions set forth in the Indenture. The Indenture permits, with certain exceptions as therein provided, the Company and the Trustee at any time to enter into a supplemental indenture or indentures for the purpose of modifying in any manner the rights and obligations of the Company and of the Holders of the Securities, with the consent of the Holders of not less than a majority in principal amount of the Outstanding Securities of each series to be affected by such supplemental indenture. The Indenture also contains provisions permitting Holders of specified percentages in principal amount of the Securities of each series at the time Outstanding, on behalf of the Holders of all
19 Securities of such series, to waive compliance by the Company with certain provisions of the Indenture and certain past defaults under the Indenture and their consequences. Any such consent or waiver by the Holder of this Security shall be conclusive and binding upon such Holder and upon all future Holders of this Security and of any Security issued upon the registration of transfer hereof or in exchange herefor or in lieu hereof, whether or not notation of such consent or waiver is made upon this Security. As provided in and subject to the provisions of the Indenture, if an Event of Default with respect to the Securities of this series at the time Outstanding occurs and is continuing, then and in every such case the Trustee or the Holders of not less than 25% in principal amount of the Outstanding Securities of this series may declare the principal amount of all the Securities of this series to be due and payable immediately, by a notice in writing to the Company (and to the Trustee if given by Holders), provided that, in the case of the Securities of this series issued to a Trust, if upon an Event of Default, the Trustee or the Holders of not less than 25% in principal amount of the Outstanding Securities of this series fails to declare the principal of all the Securities of this series to be immediately due and payable, the holders of at least 25% in aggregate Liquidation Amount of the Preferred Securities then outstanding shall have such right by a notice in writing to the Company and the Trustee; and upon any such declaration the principal amount of and the accrued interest (including any Additional Interest) on all the Securities of this series shall become immediately due and payable, provided that the payment of principal and interest (including any Additional Interest) on such Securities shall remain subordinated to the extent provided in Article XIII of the Indenture. No reference herein to the Indenture and no provision of this Security or of the Indenture shall alter or impair the obligation of the Company, which is absolute and unconditional, to pay the principal of (and premium, if any) and interest on this Security at the times, place and rate, and in the coin or currency, herein prescribed. As provided in the Indenture and subject to certain limitations therein set forth, the transfer of this Security is registrable in the Securities Register, upon surrender of this Security for registration of transfer at the office or agency of the Company maintained under Section 10.2 of the Indenture duly endorsed by, or accompanied by a written instrument of transfer in form satisfactory to the Company and the Securities Registrar duly executed by, the Holder hereof or his attorney duly authorized in writing, and thereupon one or more new Securities of this series, of authorized denominations and for the same aggregate principal amount, will be issued to the designated transferee or transferees. No service charge shall be made for any such registration of transfer or exchange, but the Company may require payment of a sum sufficient to cover any tax or other governmental charge payable in connection therewith. Prior to due presentment of this Security for registration of transfer, the Company, the Trustee and any agent of the Company or the Trustee may treat the Person in whose name this Security is registered as the owner hereof for all purposes, whether or not this Security be overdue, and neither the Company, the Trustee nor any such agent shall be affected by notice to the contrary.
20 The Securities of this series are issuable only in registered form without coupons in denominations of $25.00 and any integral multiple thereof. As provided in the Indenture and subject to certain limitations therein set forth, Securities of this series are exchangeable for a like aggregate principal amount of Securities of such series of a different authorized denomination, as requested by the Holder surrendering the same. The Company and, by its acceptance of this Security or a beneficial interest therein, the Holder of, and any Person that acquires a beneficial interest in, this Security agree that for United States Federal, state and local tax purposes it is intended that this Security constitute indebtedness. THE INDENTURE AND THIS SECURITY SHALL BE GOVERNED BY AND CONSTRUED IN ACCORDANCE WITH THE LAWS OF THE STATE OF NEW YORK WITHOUT REGARD TO CONFLICTS OF LAWS PRINCIPLES THEREOF. SECTION 2.4. Additional Provisions Required in Global Security. Any Global Security issued hereunder shall, in addition to the provisions contained in Sections 2.2 and 2.3, bear a legend in substantially the following form: "This Security is a Global Security within the meaning of the Indenture hereinafter referred to and is registered in the name of a Depositary or a nominee of a Depositary. This Security is exchangeable for Securities registered in the name of a person other than the Depositary or its nominee only in the limited circumstances described in the Indenture and may not be transferred except as a whole by the Depositary to a nominee of the Depositary or by a nominee of the Depositary to the Depositary or another nominee of the Depositary." SECTION 2.5. Form of Trustee's Certificate of Authentication. This is one of the Securities referred to in the within mentioned Indenture. Dated: ------------------------------------------- as Trustee By: ---------------------------------------- Authorized officer ARTICLE III THE SECURITIES SECTION 3.1. Title and Terms. The aggregate principal amount of Securities which may be authenticated and delivered under this Indenture is unlimited.
21 The Securities may be issued in one or more series. There shall be established in or pursuant to a Board Resolution, and set forth in an Officers' Certificate, or established in one or more indentures supplemental hereto, prior to the issuance of Securities of a series: (a) the title of the securities of such series, which shall distinguish the Securities of the series from all other Securities; (b) the limit, if any, upon the aggregate principal amount of the Securities of such series which may be authenticated and delivered under this Indenture (except for Securities authenticated and delivered upon registration of transfer of, or in exchange for, or in lieu of, other Securities of the series pursuant to Section 3.4, 3.5, 3.6, 9.6 or 11.6 and except for any Securities which, pursuant to Section 3.3, are deemed never to have been authenticated and delivered hereunder); provided, however, that the authorized aggregate principal amount of such series may be increased above such amount by a Board Resolution to such effect; (c) the Stated Maturity or Maturities on which the principal of the Securities of such series is payable or the method of determination thereof; (d) the rate or rates, if any, at which the Securities of such series shall bear interest, if any, the rate or rates and extent to which Additional Interest, if any, shall be payable in respect of any Securities of such series, the Interest Payment Dates on which such interest shall be payable, the right, pursuant to Section 3.11 or as otherwise set forth therein, of the Company to defer or extend an Interest Payment Date, and the Regular Record Date for the interest payable on any Interest Payment Date or the method by which any of the foregoing shall be determined; (e) the place or places where the principal of (and premium, if any) and interest on the Securities of such series shall be payable, the place or places where the Securities of such series may be presented for registration of transfer or exchange, and the place or places where notices and demands to or upon the Company in respect of the Securities of such series may be made; (f) the period or periods within or the date or dates on which, if any, the price or prices at which and the terms and conditions upon which the Securities of such series may be redeemed, in whole or in part, at the option of the Company; (g) the obligation or the right, if any, of the Company to redeem, repay or purchase the Securities of such series pursuant to any sinking fund, amortization or analogous provisions, or at the option of a Holder thereof, and the period or periods within which, the price or prices at which, the currency or currencies (including currency unit or units) in which and the other terms and conditions upon which Securities of the series shall be redeemed, repaid or purchased, in whole or in part, pursuant to such obligation; (h) the denominations in which any Securities of such series shall be issuable, if other than denominations of $25 and any integral multiple thereof;
22 (i) if other than Dollars, the currency or currencies (including currency unit or units) in which the principal of (and premium, if any) and interest, if any, on the Securities of the series shall be payable, or in which the Securities of the series shall be denominated; (j) the additions, modifications or deletions, if any, in the Events of Default or covenants of the Company set forth herein with respect to the Securities of such series; (k) if other than the principal amount thereof, the portion of the principal amount of Securities of such series that shall be payable upon declaration of acceleration of the Maturity thereof; (l) the additions or changes, if any, to this Indenture with respect to the Securities of such series as shall be necessary to permit or facilitate the issuance of the Securities of such series in bearer form, registrable or not registrable as to principal, and with or without interest coupons; (m) any index or indices used to determine the amount of payments of principal of and premium, if any, on the Securities of such series or the manner in which such amounts will be determined; (n) whether the Securities of the series, or any portion thereof, shall initially be issuable in the form of a temporary Global Security representing all or such portion of the Securities of such series and provisions for the exchange of such temporary Global Security for definitive Securities of such series; (o) if applicable, that any Securities of the series shall be issuable in whole or in part in the form of one or more Global Securities and, in such case, the respective Depositaries for such Global Securities, the form of any legend or legends which shall be borne by any such Global Security in addition to or in lieu of that set forth in Section 2.4 and any circumstances in addition to or in lieu of those set forth in Section 3.5 in which any such Global Security may be exchanged in whole or in part for Securities registered, and any transfer of such Global Security in whole or in part may be registered, in the name or names of Persons other than the Depositary for such Global Security or a nominee thereof; (p) the appointment of any Paying Agent or Agents for the Securities of such series; (q) the terms of any right to convert or exchange Securities of such series into any other securities or property of the Company, and the additions or changes, if any, to this Indenture with respect to the Securities of such series to permit or facilitate such conversion or exchange; (r) the form or forms of the Trust Agreement, Amended and Restated Trust Agreement and Guarantee Agreement, if different from the forms attached hereto as Annexes A, B and C, respectively;
23 (s) the relative degree, if any, to which the Securities of the series shall be senior to or be subordinated to other series of Securities in right of payment, whether such other series of Securities are Outstanding or not; and (t) any other terms of the Securities of such series (which terms shall not be inconsistent with the provisions of this Indenture). All Securities of any one series shall be substantially identical except as to denomination and except as may otherwise be provided herein or in or pursuant to such Board Resolution and set forth in such Officers' Certificate or in any such indenture supplemental hereto. If any of the terms of the series are established by action taken pursuant to a Board Resolution, a copy of an appropriate record of such action shall be certified by the Secretary or an Assistant Secretary of the Company and delivered to the Trustee at or prior to the delivery of the Officers' Certificate setting forth the terms of the series. The Securities shall be subordinated in right of payment to Senior Debt as provided in Article XIII. SECTION 3.2. Denominations. The Securities of each series shall be in registered form without coupons and shall be issuable in denominations of $25 and any integral multiple thereof, unless otherwise specified as contemplated by Section 3.1. SECTION 3.3. Execution, Authentication, Delivery and Dating. The Securities shall be executed on behalf of the Company by its President or one of its Vice Presidents under its corporate seal reproduced or impressed thereon and attested by its Secretary or one of its Assistant Secretaries. The signature of any of these officers on the Securities may be manual or facsimile. Securities bearing the manual or facsimile signatures of individuals who were at any time the proper officers of the Company shall bind the Company, notwithstanding that such individuals or any of them have ceased to hold such offices prior to the authentication and delivery of such Securities or did not hold such offices at the date of such Securities. At any time and from time to time after the execution and delivery of this Indenture, the Company may deliver Securities of any series executed by the Company to the Trustee for authentication, together with a Company Order for the authentication and delivery of such Securities, and the Trustee in accordance with the Company Order shall authenticate and deliver such Securities. If the form or terms of the Securities of the series have been established by or pursuant to one or more Board Resolutions as permitted by Sections 2.1 and 3.1, in authenticating such Securities, and accepting the additional responsibilities under this Indenture in relation to such Securities, the Trustee shall be entitled to receive, and (subject to Section 6.1) shall be fully protected in relying upon, an Opinion of Counsel stating,
24 (1) if the form of such Securities has been established by or pursuant to Board Resolution as permitted by Section 2.1, that such form has been established in conformity with the provisions of this Indenture; (2) if the terms of such Securities have been established by or pursuant to Board Resolution as permitted by Section 3.1, that such terms have been established in conformity with the provisions of this Indenture; and (3) that such Securities, when authenticated and delivered by the Trustee and issued by the Company in the manner and subject to any conditions specified in such Opinion of Counsel, will constitute valid and legally binding obligations of the Company enforceable in accordance with their terms, subject to bankruptcy, insolvency, fraudulent transfer, reorganization, moratorium and similar laws of general applicability relating to or affecting creditors' rights and to general equity principles. If such form or terms have been so established, the Trustee shall not be required to authenticate such Securities if the issue of such Securities pursuant to this Indenture will affect the Trustee's own rights, duties or immunities under the Securities and this Indenture or otherwise in a manner which is not reasonably acceptable to the Trustee. Notwithstanding the provisions of Section 3.1 and of the preceding paragraph, if all Securities of a series are not to be originally issued at one time, it shall not be necessary to deliver the Officers' Certificate otherwise required pursuant to Section 3.1 or the Company Order and Opinion of Counsel otherwise required pursuant to such preceding paragraph at or prior to the authentication of each Security of such series if such documents are delivered at or prior to the authentication upon original issuance of the first Security of such series to be issued. Each Security shall be dated the date of its authentication. No Security shall be entitled to any benefit under this Indenture or be valid or obligatory for any purpose, unless there appears on such Security a certificate of authentication substantially in the form provided for herein executed by the Trustee by the manual signature of one of its authorized officers, and such certificate upon any Security shall be conclusive evidence, and the only evidence, that such Security has been duly authenticated and delivered hereunder. Notwithstanding the foregoing, if any Security shall have been authenticated and delivered hereunder but never issued and sold by the Company, and the Company shall deliver such Security to the Trustee for cancellation as provided in Section 3.9, for all purposes of this Indenture such Security shall be deemed never to have been authenticated and delivered hereunder and shall never be entitled to the benefits of this Indenture.
25 SECTION 3.4. Temporary Securities. Pending the preparation of definitive Securities of any series, the Company may execute, and upon Company Order the Trustee shall authenticate and deliver, temporary Securities which are printed, lithographed, typewritten, mimeographed or otherwise produced, in any denomination, substantially of the tenor of the definitive Securities of such series in lieu of which they are issued and with such appropriate insertions, omissions, substitutions and other variations as the officers executing such Securities may determine, as evidenced by their execution of such Securities. If temporary Securities of any series are issued, the Company will cause definitive Securities of such series to be prepared without unreasonable delay. After the preparation of definitive Securities, the temporary Securities shall be exchangeable for definitive Securities upon surrender of the temporary Securities at the office or agency of the Company designated for that purpose without charge to the Holder. Upon surrender for cancellation of any one or more temporary Securities, the Company shall execute and the Trustee shall authenticate and deliver in exchange therefor one or more definitive Securities of the same series, of any authorized denominations having the same Original Issue Date and Stated Maturity and having the same terms as such temporary Securities. Until so exchanged, the temporary Securities of any series shall in all respects be entitled to the same benefits under this Indenture as definitive Securities of such series. SECTION 3.5. Registration, Transfer and Exchange. The Company shall cause to be kept at the Corporate Trust Office of the Trustee a register in which, subject to such reasonable regulations as it may prescribe, the Company shall provide for the registration of Securities and of transfers of Securities. Such register is herein sometimes referred to as the "Securities Register." The Trustee is hereby appointed "Securities Registrar" for the purpose of registering Securities and transfers of Securities as herein provided. Upon surrender for registration of transfer of any Security at the office or agency of the Company designated for that purpose the Company shall execute, and the Trustee shall authenticate and deliver, in the name of the designated transferee or transferees, one or more new Securities of the same series of any authorized denominations, of a like aggregate principal amount, of the same Original Issue Date and Stated Maturity and having the same terms. At the option of the Holder, Securities may be exchanged for other Securities of the same series of any authorized denominations, of a like aggregate principal amount, of the same Original Issue Date and Stated Maturity and having the same terms, upon surrender of the Securities to be exchanged at such office or agency. Whenever any securities are so surrendered for exchange, the Company shall execute, and the Trustee shall authenticate and deliver, the Securities which the Holder making the exchange is entitled to receive. All Securities issued upon any transfer or exchange of Securities shall be the valid obligations of the Company, evidencing the same debt, and entitled to the same benefits under this Indenture, as the Securities surrendered upon such transfer or exchange.
26 Every Security presented or surrendered for transfer or exchange shall (if so required by the Company or the Securities Registrar) be duly endorsed, or be accompanied by a written instrument of transfer in form satisfactory to the Company and the Securities Registrar, duly executed by the Holder thereof or his attorney duly authorized in writing. No service charge shall be made to a Holder for any transfer or exchange of Securities, but the Company may require payment of a sum sufficient to cover any tax or other governmental charge that may be imposed in connection with any transfer or exchange of Securities. The provisions of Clauses (1), (2), (3) and (4) below shall apply only to Global Securities: (1) Each Global Security authenticated under this Indenture shall be registered in the name of the Depositary designated for such Global Security or a nominee thereof and delivered to such Depositary or a nominee thereof or custodian therefor, and each such Global Security shall constitute a single Security for all purposes of this Indenture. (2) Notwithstanding any other provision in this Indenture, no Global Security may be exchanged in whole or in part for Securities registered, and no transfer of a Global Security in whole or in part may be registered, in the name of any Person other than the Depositary for such Global Security or a nominee thereof unless (A) such Depositary (i) has notified the Company that it is unwilling or unable to continue as Depositary for such Global Security or (ii) has ceased to be a clearing agency registered under the Exchange Act at a time when the Depositary is required to be so registered to act as depositary, in each case unless the Company has approved a successor Depositary within 90 days, (B) there shall have occurred and be continuing an Event of Default with respect to such Global Security, (C) the Company in its sole discretion determines that such Global Security will be so exchangeable or transferable or (D) there shall exist such circumstances, if any, in addition to or in lieu of the foregoing as have been specified for this purpose as contemplated by Section 3.1. (3) Subject to Clause (2) above, any exchange of a Global Security for other Securities may be made in whole or in part, and all Securities issued in exchange for a Global Security or any portion thereof shall be registered in such names as the Depositary for such Global Security shall direct. (4) Every Security authenticated and delivered upon registration of transfer of, or in exchange for or in lieu of, a Global Security or any portion thereof, whether pursuant to this Section, Section 3.4, 3.6, 9.6 or 11.6 or otherwise, shall be authenticated and delivered in the form of, and shall be, a Global Security, unless such Security is registered in the name of a Person other than the Depositary for such Global Security or a nominee thereof. Neither the Company nor the Trustee shall be required, pursuant to the provisions of this Section, (a) to issue, transfer or exchange any Security of any series during a period beginning
27 at the opening of business 15 days before the day of selection for redemption of Securities pursuant to Article XI and ending at the close of business on the day of mailing of notice of redemption or (b) to transfer or exchange any Security so selected for redemption in whole or in part, except, in the case of any Security to be redeemed in part, any portion thereof not to be redeemed. SECTION 3.6. Mutilated, Destroyed, Lost and Stolen Securities. If any mutilated Security is surrendered to the Trustee together with such security or indemnity as may be required by the Company or the Trustee to save each of them harmless, the Company shall execute and the Trustee shall authenticate and deliver in exchange therefor a new Security of the same issue and series of like tenor and principal amount, having the same Original Issue Date and Stated Maturity, and bearing a number not contemporaneously outstanding. If there shall be delivered to the Company and to the Trustee (i) evidence to their satisfaction of the destruction, loss or theft of any Security, and (ii) such security or indemnity as may be required by them to save each of them harmless, then, in the absence of notice to the Company or the Trustee that such Security has been acquired by a bona fide purchaser, the Company shall execute and upon its request the Trustee shall authenticate and deliver, in lieu of any such destroyed, lost or stolen Security, a new Security of the same issue and series of like tenor and principal amount, having the same Original Issue Date and Stated Maturity as such destroyed, lost or stolen Security, and bearing a number not contemporaneously outstanding. In case any such mutilated, destroyed, lost or stolen Security has become or is about to become due and payable, the Company in its discretion may, instead of issuing a new Security, pay such Security. Upon the issuance of any new Security under this Section, the Company may require the payment of a sum sufficient to cover any tax or other governmental charge that may be imposed in relation thereto and any other expenses (including the fees and expenses of the Trustee) connected therewith. Every new Security issued pursuant to this Section in lieu of any destroyed, lost or stolen Security shall constitute an original additional contractual obligation of the Company, whether or not the destroyed, lost or stolen Security shall be at any time enforceable by anyone, and shall be entitled to all the benefits of this Indenture equally and proportionately with any and all other Securities duly issued hereunder. The provisions of this Section are exclusive and shall preclude (to the extent lawful) all other rights and remedies with respect to the replacement or payment of mutilated, destroyed, lost or stolen Securities.
28 SECTION 3.7. Payment of Interest; Interest Rights Preserved. Interest on any Security of any series which is payable, and is punctually paid or duly provided for, on any Interest Payment Date, shall be paid to the Person in whose name that Security (or one or more Predecessor Securities) is registered at the close of business on the Regular Record Date for such interest in respect of Securities of such series, except that, unless otherwise provided in the Securities of such series, interest payable on the Stated Maturity of the principal of a Security shall be paid to the Person to whom principal is paid. The initial payment of interest on any Security of any series which is issued between a Regular Record Date and the related Interest Payment Date shall be payable as provided in such Security or in the Board Resolution pursuant to Section 3.1 with respect to the related series of Securities. Any interest on any Security which is payable, but is not timely paid or duly provided for, on any Interest Payment Date for Securities of such series (herein called "Defaulted Interest"), shall forthwith cease to be payable to the registered Holder on the relevant Regular Record Date by virtue of having been such Holder, and such Defaulted Interest may be paid by the Company, at its election in each case, as provided in Clause (1) or (2) below: (1) The Company may elect to make payment of any Defaulted Interest to the Persons in whose names the Securities of such series in respect of which interest is in default (or their respective Predecessor Securities) are registered at the close of business on a Special Record Date for the payment of such Defaulted Interest, which shall be fixed in the following manner. The Company shall notify the Trustee in writing of the amount of Defaulted Interest proposed to be paid on each Security and the date of the proposed payment, and at the same time the Company shall deposit with the Trustee an amount of money equal to the aggregate amount proposed to be paid in respect of such Defaulted Interest or shall make arrangements satisfactory to the Trustee for such deposit prior to the date of the proposed payment, such money when deposited to be held in trust for the benefit of the Persons entitled to such Defaulted Interest as in this Clause provided. Thereupon the Trustee shall fix a Special Record Date for the payment of such Defaulted Interest which shall be not more than 15 days and not less than 10 days prior to the date of the proposed payment and not less than 10 days after the receipt by the Trustee of the notice of the proposed payment. The Trustee shall promptly notify the Company of such Special Record Date and, in the name and at the expense of the Company, shall cause notice of the proposed payment of such Defaulted Interest and the Special Record Date therefor to be mailed, first class, postage prepaid, to each Holder of a Security of such series at the address of such Holder as it appears in the Securities Register not less than 10 days prior to such Special Record Date. The Trustee may, in its discretion, in the name and at the expense of the Company, cause a similar notice to be published at least once in a newspaper, customarily published in the English language on each Business Day and of general circulation in the Borough of Manhattan, The City of New York, but such publication shall not be a condition precedent to the establishment of such Special Record Date. Notice of the proposed payment of such Defaulted Interest and the Special Record Date therefor having been mailed as aforesaid, such Defaulted Interest shall be paid to the Persons in whose names the Securities of such series (or their respective Predecessor Securities) are registered on such Special Record Date and shall no longer be payable pursuant to the following Clause (2).
29 (2) The Company may make payment of any Defaulted Interest in any other lawful manner not inconsistent with the requirements of any securities exchange on which the Securities of the series in respect of which interest is in default may be listed and, upon such notice as may be required by such exchange (or by the Trustee if the Securities are not listed), if, after notice given by the Company to the Trustee of the proposed payment pursuant to this Clause, such payment shall be deemed practicable by the Trustee. Subject to the foregoing provisions of this Section, each Security delivered under this Indenture upon transfer of or in exchange for or in lieu of any other Security shall carry the rights to interest accrued and unpaid, and to accrue, which were carried by such other Security. SECTION 3.8. Persons Deemed Owners. The Company, the Trustee and any agent of the Company or the Trustee may treat the Person in whose name any Security is registered as the owner of such Security for the purpose of receiving payment of principal of and (subject to Section 3.7) any interest on such Security and for all other purposes whatsoever, whether or not such Security be overdue, and neither the Company, the Trustee nor any agent of the Company or the Trustee shall be affected by notice to the contrary. SECTION 3.9. Cancellation. All Securities surrendered for payment, redemption, transfer or exchange shall, if surrendered to any Person other than the Trustee, be delivered to the Trustee, and any such Securities and Securities surrendered directly to the Trustee for any such purpose shall be promptly canceled by it. The Company may at any time deliver to the Trustee for cancellation any Securities previously authenticated and delivered hereunder which the Company may have acquired in any manner whatsoever, and all Securities so delivered shall be promptly canceled by the Trustee. No Securities shall be authenticated in lieu of or in exchange for any Securities canceled as provided in this Section, except as expressly permitted by this Indenture. All canceled Securities shall be destroyed by the Trustee and the Trustee shall deliver to the Company a certificate of such destruction. SECTION 3.10. Computation of Interest. Except as otherwise specified as contemplated by Section 3.1 for Securities of any series, interest on the Securities of each series for any period shall be computed on the basis of a 360- day year of twelve 30-day months and interest on the Securities of each series for any partial period shall be computed on the basis of the number of days elapsed in a 360-day year of twelve 30-day months. SECTION 3.11. Deferrals of Interest Payment Dates. If specified as contemplated by Section 2.1 or Section 3.1 with respect to the Securities of a particular series, so long as no Event of Default has occurred and is continuing, the Company shall have the right, at any time during the term of such series, from time to time to
30 defer the payment of interest on such Securities for such period or periods as may be specified as contemplated by Section 3.1 (each, an "Extension Period") during which Extension Periods the Company shall have the right to make partial payments of interest on any Interest Payment Date. No Extension Period shall end on a date other than an Interest Payment Date. At the end of any such Extension Period the Company shall pay all interest then accrued and unpaid on the Securities (together with Additional Interest thereon, if any, at the rate specified for the Securities of such series to the extent permitted by applicable law); provided, however, that no Extension Period shall extend beyond the Stated Maturity of the principal of the Securities of such series; provided, further, that during any such Extension Period, the Company shall not, and shall not permit any Subsidiary to, (i) declare or pay any dividends or distributions on, or redeem, purchase, acquire or make a liquidation payment with respect to, any of the Company's capital stock, or (ii) make any payment of principal of or interest or premium, if any, on or repay, repurchase or redeem any debt security of the Company that ranks pari passu with or junior in interest to the Securities of such series or make any guarantee payments with respect to any guarantee by the Company of the debt securities of any Subsidiary of the Company that by their terms rank pari passu with or junior in interest to the securities of such series (other than (a) dividends or distributions in Common Stock, (b) any declaration of a dividend in connection with the implementation of a Rights Plan, the issuance of any Common Stock of any class or series of preferred stock of the Company under any Rights Plan or the repurchase of any rights distributed pursuant to a Rights Plan, (c) payments under any Guarantee, and (d) purchases of Common Stock related to the issuance of Common Stock under any of the Company's benefit plans for its directors, officers or employees). Prior to the termination of any such Extension Period, the Company may further extend the interest payment period, provided that no Extension Period shall exceed the period or periods specified in such Securities or extend beyond the Stated Maturity of the principal of such Securities. Upon termination of any Extension Period and upon the payment of all accrued and unpaid interest and any Additional Interest then due on any Interest Payment Date, the Company may elect to begin a new Extension Period, subject to the above requirements. No interest shall be due and payable during an Extension Period, except at the end thereof. The Company shall give the Holders of the Securities of such series and the Trustee notice of its election to begin any such Extension Period at least one Business Day prior to the next succeeding Interest Payment Date on which interest on Securities of such series would be payable but for such deferral or, with respect to the Securities of a series issued to a Trust, so long as such Securities are held by such Trust, prior to the earlier of (i) the next succeeding date on which Distributions on the Preferred Securities of such Trust would be payable but for such deferral or (ii) the date the Administrative Trustees of such Trust are required to give notice to any securities exchange or other applicable self-regulatory organization or to holders of such Preferred Securities of the record date or the date such Distributions are payable, but in any event not less than one Business Day prior to such record date. The Trustee shall promptly give notice of the Company's election to begin any such Extension Period to the Holders of the Outstanding Securities of such series.
31 SECTION 3.12. Right of Set-Off. With respect to the Securities of a series issued to a Trust, notwithstanding anything to the contrary in the Indenture, the Company shall have the right to set-off any payment it is otherwise required to make thereunder in respect of any such Security to the extent the Company has theretofore made, or is concurrently on the date of such payment making, a payment under the Guarantee relating to such Security or under Section 5.8 of the Indenture. SECTION 3.13. Agreed Tax Treatment. Each Security issued hereunder shall provide that the Company and, by its acceptance of a Security or a beneficial interest therein, the Holder of, and any Person that acquires a beneficial interest in, such Security agree that for United States Federal, state and local tax purposes it is intended that such Security constitute indebtedness. SECTION 3.14. Shortening or Extension of Stated Maturity. If specified as contemplated by Section 2.1 or Section 3.1 with respect to the Securities of a particular series, the Company shall have the right to (i) shorten the Stated Maturity of the principal of the Securities of such series at any time to any date not earlier than the first date on which the Company has the right to redeem the Securities of such series, and (ii) extend the Stated Maturity of the principal of the Securities of such series at any time at its election for one or more periods, but in no event to a date later than the 49th anniversary of the first Interest Payment Date following the Original Issue Date of the Securities of such series; provided that, if the Company elects to exercise its right to extend the Stated Maturity of the principal of the Securities of such series pursuant to clause (ii), above, at the time such election is made and at the time of extension (A) the Company is not in bankruptcy, otherwise insolvent or in liquidation, (B) the Company is not in default in the payment of any interest or principal on such Securities, (C) in the case of any series of Securities issued to a Trust, such Trust is not in arrears on payments of Distributions on the Preferred Securities issued by such Trust and no deferred Distributions are accumulated and (D) such Securities are rated not less than BBB- by S&P or Baa3 by Moody's or the equivalent by any other nationally recognized statistical rating organization. In the event the Company elects to shorten or extend the Stated Maturity of the Series A Subordinated Debentures, it shall give notice to the Trustee, and the Trustee shall give notice of such shortening or extension to the Holders, no less than 30 and no more than 60 days prior to the effectiveness thereof. SECTION 3.15. CUSIP Numbers. The Company in issuing the Securities may use "CUSIP" numbers (if then generally in use), and, if so, the Trustee shall use "CUSIP" numbers in notices of redemption as a convenience to Holders; provided that any such notice may state that no representation is made as to the correctness of such numbers either as printed on the Securities or as contained in any notice of a redemption and that reliance may be placed only on the other identification numbers printed on the Securities, and any such redemption shall not be affected by any defect in or omission of such numbers.
32 ARTICLE IV SATISFACTION AND DISCHARGE SECTION 4.1. Satisfaction and Discharge of Indenture. This Indenture shall, upon Company Request, cease to be of further effect (except as to any surviving rights of registration of transfer or exchange of Securities herein expressly provided for and as otherwise provided in this Section 4.1) and the Trustee, on demand of and at the expense of the Company, shall execute proper instruments acknowledging satisfaction and discharge of this Indenture, when (1) either (A) all Securities theretofore authenticated and delivered (other than (i) Securities which have been destroyed, lost or stolen and which have been replaced or paid as provided in Section 3.6 and (ii) Securities for whose payment money has theretofore been deposited in trust or segregated and held in trust by the Company and thereafter repaid to the Company or discharged from such trust, as provided in Section 10.3) have been delivered to the Trustee for cancellation; or (B) all such Securities not theretofore delivered to the Trustee for cancellation (i) have become due and payable, or (ii) will become due and payable at their Stated Maturity within one year of the date of deposit, or (iii) are to be called for redemption within one year under arrangements satisfactory to the Trustee for the giving of notice of redemption by the Trustee in the name, and at the expense, of the Company, and the Company, in the case of Clause (B) (i), (ii) or (iii) above, has deposited or caused to be deposited with the Trustee as trust funds in trust for such purpose an amount in the currency or currencies in which the Securities of such series are payable sufficient to pay and discharge the entire indebtedness on such Securities not theretofore delivered to the Trustee for cancellation, for principal (and premium, if any) and interest (including any Additional Interest) to the date of such deposit (in the case of Securities which have become due and payable) or to the Stated Maturity or Redemption Date, as the case may be; (2) the Company has paid or caused to be paid all other sums payable hereunder by the Company; and
33 (3) the Company has delivered to the Trustee an Officers' Certificate and an Opinion of Counsel each stating that all conditions precedent herein provided for relating to the satisfaction and discharge of this Indenture have been complied with. Notwithstanding the satisfaction and discharge of this Indenture, the obligations of the Company to the Trustee under Section 6.7, the obligations of the Trustee to any Authenticating Agent under Section 6.14 and, if money shall have been deposited with the Trustee pursuant to subclause (B) of clause (1) of this Section, the obligations of the Trustee under Section 4.2 and the last paragraph of Section 10.3 shall survive. SECTION 4.2. Application of Trust Money. Subject to the provisions of the last paragraph of Section 10.3, all money deposited with the Trustee pursuant to Section 4.1 shall be held in trust and applied by the Trustee, in accordance with the provisions of the Securities and this Indenture, to the payment, either directly or through any Paying Agent (including the Company acting as its own Paying Agent) as the Trustee may determine, to the Persons entitled thereto, of the principal (and premium, if any) and interest for the payment of which such money or obligations have been deposited with or received by the Trustee. ARTICLE V REMEDIES SECTION 5.1. Events of Default. "Event of Default", wherever used herein with respect to the Securities of any series, means any one of the following events (whatever the reason for such Event of Default and whether it shall be voluntary or involuntary or be effected by operation of law or pursuant to any judgment, decree or order of any court or any order, rule or regulation of any administrative or governmental body): (1) default in the payment of any interest upon any Security of that series, including any Additional Interest in respect thereof, when it becomes due and payable, and continuance of such default for a period of 30 days (subject to the deferral of any due date in the case of an Extension Period); or (2) default in the payment of the principal of (or premium, if any, on) any Security of that series at its Maturity; or (3) default in the performance, or breach, in any material respect, of any covenant or warranty of the Company in this Indenture (other than a covenant or warranty a default in the performance of which or the breach of which is elsewhere in this Section specifically dealt with), and continuance of such default or breach for a period of 90 days after there has been given, by registered or certified mail, to the Company by the Trustee or to the Company and the Trustee
34 by the Holders of at least 25% in principal amount of the Outstanding Securities of that series a written notice specifying such default or breach and requiring it to be remedied; or (4) the entry of a decree or order by a court having jurisdiction in the premises adjudging the Company a bankrupt or insolvent, or approving as properly filed a petition seeking reorganization, arrangement, adjustment or composition of or in respect of the Company under any applicable Federal or State bankruptcy, insolvency, reorganization or other similar law, or appointing a receiver, liquidator, assignee, trustee, sequestrator (or other similar official) of the Company or of any substantial part of its property or ordering the winding up or liquidation of its affairs, and the continuance of any such decree or order unstayed and in effect for a period of 60 consecutive days; or (5) the institution by the Company of proceedings to be adjudicated a bankrupt or insolvent, or the consent by it to the institution of bankruptcy or insolvency proceedings against it, or the filing by it of a petition or answer or consent seeking reorganization or relief under any applicable Federal or State bankruptcy, insolvency, reorganization or other similar law, or the consent by it to the filing of any such petition or to the appointment of a receiver, liquidator, assignee, trustee, sequestrator (or other similar official) of the Company or of any substantial part of its property, or the making by it of an assignment for the benefit for creditors, or the admission by it in writing of its inability to pay its debts generally as they become due and its willingness to be adjudicated a bankrupt, or the taking of corporate action by the Company in furtherance of any such action; or (6) any other Event of Default provided with respect to Securities of that series. SECTION 5.2. Acceleration of Maturity; Rescission and Annulment. If an Event of Default (other than an Event of Default specified in Section 5.1(4) or 5.1(5)) with respect to Securities of any series at the time Outstanding occurs and is continuing, then and in every such case the Trustee or the Holders of not less than 25% in principal amount of the Outstanding Securities of that series may declare the principal amount (or, if the Securities of that series are Discount Securities, such portion of the principal amount as may be specified in the terms of that series) of all the Securities of that series to be due and payable immediately, by a notice in writing to the Company (and to the Trustee if given by Holders), provided that, in the case of the Securities of a series issued to a Trust, if, upon an Event of Default, the Trustee or the Holders of not less than 25% in principal amount of the Outstanding Securities of that series fail to declare the principal of all the Securities of that series to be immediately due and payable, the holders of at least 25% in aggregate liquidation amount of the corresponding series of Preferred Securities then outstanding shall have such right by a notice in writing to the Company and the Trustee; and upon any such declaration such principal amount (or specified portion thereof) of and the accrued interest (including any Additional Interest) on all the Securities of such series shall become immediately due and payable. Payment of principal and interest (including any Additional Interest) on such Securities shall remain subordinated to the extent provided in Article XIII notwithstanding that such amount shall become immediately due and payable as herein provided. If an Event of Default specified in Section 5.1(4) or 5.1(5) with respect to Securities of any series at the time Outstanding occurs, the principal amount of all the
35 Securities of that series (or, if the Securities of that series are Discount Securities, such portion of the principal amount of such Securities as may be specified by the terms of that series) shall automatically, and without any declaration or other action on the part of the Trustee or any Holder, become immediately due and payable. At any time after such a declaration of acceleration with respect to Securities of any series has been made and before a judgment or decree for payment of the money due has been obtained by the Trustee as hereinafter in this Article provided, the Holders of a majority in principal amount of the Outstanding Securities of that series, by written notice to the Company and the Trustee, may rescind and annul such declaration and its consequences if: (1) the Company has paid or deposited with the Trustee a sum sufficient to pay: (A) all overdue installments of interest (including any Additional Interest) on all Securities of that series, (B) the principal of (and premium, if any, on) any Securities of that series which have become due otherwise than by such declaration of acceleration and interest thereon at the rate borne by the Securities, and (C) all sums paid or advanced by the Trustee hereunder and the reasonable compensation, expenses, disbursements and advances of the Trustee, its agents and counsel; and (2) all Events of Default with respect to Securities of that series, other than the non-payment of the principal of Securities of that series which has become due solely by such acceleration, have been cured or waived as provided in Section 5.13. In the case of Securities of a series issued to a Trust, the holders of a majority in aggregate Liquidation Amount (as defined in the Trust Agreement under which such Trust is formed) of the related series of Preferred Securities issued by such Trust shall also have the right to rescind and annul such declaration and its consequences by written notice to the Company and the Trustee, subject to the satisfaction of the conditions set forth in Clauses (1) and (2) above of this Section 5.2. No such rescission shall affect any subsequent default or impair any right consequent thereon. SECTION 5.3. Collection of Indebtedness and Suits for Enforcement by Trustee. The Company covenants that if: (1) default is made in the payment of any installment of interest (including any Additional Interest) on any Security when such interest becomes due and payable and such default continues for a period of 30 days, or
36 (2) default is made in the payment of the principal of (and premium, if any, on) any Security at the Maturity thereof, the Company will, upon demand of the Trustee, pay to the Trustee, for the benefit of the Holders of such Securities, the whole amount then due and payable on such Securities for principal, including any sinking fund payment or analogous obligations (and premium, if any) and interest (including any Additional Interest); and, in addition thereto, all amounts owing the Trustee under Section 6.7. If the Company fails to pay such amounts forthwith upon such demand, the Trustee, in its own name and as trustee of an express trust, may institute a judicial proceeding for the collection of the sums so due and unpaid, and may prosecute such proceeding to judgment or final decree, and may enforce the same against the Company or any other obligor upon the Securities and collect the moneys adjudged or decreed to be payable in the manner provided by law out of the property of the Company or any other obligor upon the Securities, wherever situated. If an Event of Default with respect to Securities of any series occurs and is continuing, the Trustee may in its discretion proceed to protect and enforce its rights and the rights of the Holders of Securities of such series by such appropriate judicial proceedings as the Trustee shall deem most effectual to protect and enforce any such rights, whether for the specific enforcement of any covenant or agreement in this Indenture or in aid of the exercise of any power granted herein, or to enforce any other proper remedy. SECTION 5.4. Trustee May File Proofs of Claim. In case of the pendency of any receivership, insolvency, liquidation, bankruptcy, reorganization, arrangement, adjustment, composition or other judicial proceeding relative to the Company or any other obligor upon the Securities or the property of the Company or of such other obligor or their creditors, (a) the Trustee (irrespective of whether the principal of the Securities of any series shall then be due and payable as therein expressed or by declaration or otherwise and irrespective of whether the Trustee shall have made any demand on the Company for the payment of overdue principal (and premium, if any) or interest (including any Additional Interest)) shall be entitled and empowered, by intervention in such proceeding or otherwise, (i) to file and prove a claim for the whole amount of principal (and premium, if any) and interest (including any Additional Interest) owing and unpaid in respect to the Securities and to file such other papers or documents as may be necessary or advisable and to take any and all actions as are authorized under the Trust Indenture Act in order to have the claims of the Holders and any predecessor to the Trustee under Section 6.7 allowed in any such judicial proceedings; and
37 (ii) in particular, the Trustee shall be authorized to collect and receive any moneys or other property payable or deliverable on any such claims and to distribute the same in accordance with Section 5.6; and (b) any custodian, receiver, assignee, trustee, liquidator, sequestrator (or other similar official) in any such judicial proceeding is hereby authorized by each Holder to make such payments to the Trustee for distribution in accordance with Section 5.6, and in the event that the Trustee shall consent to the making of such payments directly to the Holders, to pay to the Trustee any amount due to it and any predecessor Trustee under Section 6.7. Nothing herein contained shall be deemed to authorize the Trustee to authorize or consent to or accept or adopt on behalf of any Holder any plan of reorganization, arrangement, adjustment or composition affecting the Securities or the rights of any Holder thereof, or to authorize the Trustee to vote in respect of the claim of any Holder in any such proceeding; provided, however, that the Trustee may, on behalf of the Holders, vote for the election of a trustee in bankruptcy or similar official and be a member of a creditors' or other similar committee. SECTION 5.5. Trustee May Enforce Claim Without Possession of Securities. All rights of action and claims under this Indenture or the Securities may be prosecuted and enforced by the Trustee without the possession of any of the Securities or the production thereof in any proceeding relating thereto, and any such proceeding instituted by the Trustee shall be brought in its own name as trustee of an express trust, and any recovery of judgment shall, after provision for the payment of all the amounts owing the Trustee and any predecessor Trustee under Section 6.7, its agents and counsel, be for the ratable benefit of the Holders of the Securities in respect of which such judgment has been recovered. SECTION 5.6. Application of Money Collected. Any money or property collected or to be applied by the Trustee with respect to a series of Securities pursuant to this Article shall be applied in the following order, at the date or dates fixed by the Trustee and, in case of the distribution of such money or property on account of principal (or premium, if any) or interest (including any Additional Interest), upon presentation of the Securities and the notation thereon of the payment if only partially paid and upon surrender thereof if fully paid: FIRST: To the payment of all amounts due the Trustee and any predecessor Trustee under Section 6.7; SECOND: Subject to Article XIII, to the payment of the amounts then due and unpaid upon such series of Securities for principal (and premium, if any) and interest (including any Additional Interest), in respect of which or for the benefit of which such money has been collected, ratably, without preference or priority of any kind, according to the amounts due and payable on such series of Securities for principal (and premium, if any) and interest (including any Additional Interest), respectively; and
38 THIRD: The balance, if any, to the Person or Persons entitled thereto. SECTION 5.7. Limitation on Suits. No Holder of any Securities of any series shall have any right to institute any proceeding, judicial or otherwise, with respect to this Indenture or for the appointment of a receiver, assignee, trustee, liquidator, sequestrator (or other similar official) or for any other remedy hereunder, unless: (1) such Holder has previously given written notice to the Trustee of a continuing Event of Default with respect to the Securities of that series; (2) the Holders of not less than 25% in principal amount of the Outstanding Securities of that series shall have made written request to the Trustee to institute proceedings in respect of such Event of Default in its own name as Trustee hereunder; (3) such Holder or Holders have offered to the Trustee reasonable indemnity against the costs, expenses and liabilities to be incurred in compliance with such request; (4) the Trustee for 60 days after its receipt of such notice, request and offer of indemnity has failed to institute any such proceeding; and (5) no direction inconsistent with such written request has been given to the Trustee during such 60-day period by the Holders of a majority in principal amount of the Outstanding Securities of that series; it being understood and intended that no one or more of such Holders shall have any right in any manner whatever by virtue of, or by availing itself of, any provision of this Indenture to affect, disturb or prejudice the rights of any other Holders of Securities, or to obtain or to seek to obtain priority or preference over any other of such Holders or to enforce any right under this Indenture, except in the manner herein provided and for the equal and ratable benefit of all such Holders.
39 SECTION 5.8. Unconditional Right of Holders to Receive Principal, Premium and Interest; Direct Action by Holders of Preferred Securities. Notwithstanding any other provision in this Indenture, the Holder of any Security shall have the right which is absolute and unconditional to receive payment of the principal of (and premium, if any) and (subject to Section 3.7) interest (including any Additional Interest) on such Security on the respective Stated Maturities expressed in such Security (or, in the case of redemption, on the Redemption Date) and to institute suit for the enforcement of any such payment, and such right shall not be impaired without the consent of such Holder. In the case of Securities of a series issued to a Trust, any holder of the corresponding series of Preferred Securities issued by such Trust shall have the right, upon the occurrence of an Event of Default described in Section 5.1(1) or 5.1(2), to institute a suit directly against the Company for enforcement of payment to such holder of principal of (premium, if any) and (subject to Section 3.7) interest (including any Additional Interest) on the Securities having a principal amount equal to the aggregate Liquidation Amount (as defined in the Trust Agreement under which such Trust is formed) of such Preferred Securities of the corresponding series held by such holder. SECTION 5.9. Restoration of Rights and Remedies. If the Trustee, any Holder or any holder of Preferred Securities has instituted any proceeding to enforce any right or remedy under this Indenture and such proceeding has been discontinued or abandoned for any reason, or has been determined adversely to the Trustee, such Holder or such holder of Preferred Securities, then and in every such case the Company, the Trustee, the Holders and such holder of Preferred Securities shall, subject to any determination in such proceeding, be restored severally and respectively to their former positions hereunder, and thereafter all rights and remedies of the Trustee, the Holders and the holders of Preferred Securities shall continue as though no such proceeding had been instituted. SECTION 5.10. Rights and Remedies Cumulative. Except as otherwise provided in the last paragraph of Section 3.6, no right or remedy herein conferred upon or reserved to the Trustee or to the Holders is intended to be exclusive of any other right or remedy, and every right and remedy shall, to the extent permitted by law, be cumulative and in addition to every other right and remedy given hereunder or now or hereafter existing at law or in equity or otherwise. The assertion or employment of any right or remedy hereunder, or otherwise, shall not prevent the concurrent assertion or employment of any other appropriate right or remedy. SECTION 5.11. Delay or Omission Not Waiver. No delay or omission of the Trustee, any Holder of any Security or any holder of any Preferred Security to exercise any right or remedy accruing upon any Event of Default shall impair any such right or remedy or constitute a waiver of any such Event of Default or an acquiescence therein.
40 Every right and remedy given by this Article or by law to the Trustee or to the Holders and the right and remedy given to the holders of Preferred Securities by Section 5.8 may be exercised from time to time, and as often as may be deemed expedient, by the Trustee, the Holders or the holders of Preferred Securities, as the case may be. SECTION 5.12. Control by Holders. The Holders of a majority in principal amount of the Outstanding Securities of any series shall have the right to direct the time, method and place of conducting any proceeding for any remedy available to the Trustee or exercising any trust or power conferred on the Trustee, with respect to the Securities of such series, provided that: (1) such direction shall not be in conflict with any rule of law or with this Indenture, (2) the Trustee may take any other action deemed proper by the Trustee which is not inconsistent with such direction, and (3) subject to the provisions of Section 6.1, the Trustee shall have the right to decline to follow such direction if a Responsible Officer or Officers of the Trustee shall, in good faith, determine that the proceeding so directed would be unjustly prejudicial to the Holders not joining in any such direction or would involve the Trustee in personal liability. SECTION 5.13. Waiver of Past Defaults. The Holders of not less than a majority in principal amount of the Outstanding Securities of any series and, in the case of any Securities of a series issued to a Trust, the holders of Preferred Securities issued by such Trust may waive any past default hereunder and its consequences with respect to such series except a default: (1) in the payment of the principal of (or premium, if any) or interest (including any Additional Interest) on any Security of such series, or (2) in respect of a covenant or provision hereof which under Article IX cannot be modified or amended without the consent of the Holder of each Outstanding Security of such series affected. Any such waiver shall be deemed to be on behalf of the Holders of all the Securities of such series or, in the case of a waiver by holders of Preferred Securities issued by such Trust, by all holders of Preferred Securities issued by such Trust. Upon any such waiver, such default shall cease to exist, and any Event of Default arising therefrom shall be deemed to have been cured, for every purpose of this Indenture; but no such waiver shall extend to any subsequent or other default or impair any right consequent thereon.
41 SECTION 5.14. Undertaking for Costs. All parties to this Indenture agree, and each Holder of any Security by his acceptance thereof shall be deemed to have agreed, that any court may in its discretion require, in any suit for the enforcement of any right or remedy under this Indenture, or in any suit against the Trustee for any action taken or omitted by it as Trustee, the filing by any party litigant in such suit of an undertaking to pay the costs of such suit, and that such court may in its discretion assess reasonable costs, including reasonable attorneys' fees, against any party litigant in such suit, having due regard to the merits and good faith of the claims or defenses made by such party litigant; but the provisions of this Section shall not apply to any suit instituted by the Trustee, to any suit instituted by any Holder, or group of Holders, holding in the aggregate more than 10% in principal amount of the Outstanding Securities of any series, or to any suit instituted by any Holder for the enforcement of the payment of the principal of (or premium, if any) or interest (including any Additional Interest) on any Security on or after the respective Stated Maturities expressed in such Security. SECTION 5.15. Waiver of Usury, Stay or Extension Laws. The Company covenants (to the extent that it may lawfully do so) that it will not at any time insist upon, or plead, or in any manner whatsoever claim or take the benefit or advantage of, any usury, stay or extension law wherever enacted, now or at any time hereafter in force, which may affect the covenants or the performance of this Indenture; and the Company (to the extent that it may lawfully do so) hereby expressly waives all benefit or advantage of any such law, and covenants that it will not hinder, delay or impede the execution of any power herein granted to the Trustee, but will suffer and permit the execution of every such power as though no such law had been enacted. ARTICLE VI THE TRUSTEE SECTION 6.1. Certain Duties and Responsibilities. (a) Except during the continuance of an Event of Default, (1) the Trustee undertakes to perform such duties and only such duties as are specifically set forth in this Indenture, and no implied covenants or obligations shall be read into this Indenture against the Trustee; and (2) in the absence of bad faith on its part, the Trustee may conclusively rely, as to the truth of the statements and the correctness of the opinions expressed therein, upon certificates or opinions furnished to the Trustee and conforming to the requirements of this Indenture; but in the case of any such certificates or opinions which by any provisions hereof are specifically required to be furnished to the Trustee, the Trustee shall be under a duty to examine the same to determine whether or not they conform to the requirements of this Indenture.
42 (b) In case an Event of Default has occurred and is continuing, the Trustee shall exercise such of the rights and powers vested in it by this Indenture, and use the same degree of care and skill in their exercise, as a prudent person would exercise or use under the circumstances in the conduct of his own affairs. (c) No provision of this Indenture shall be construed to relieve the Trustee from liability for its own negligent action, its own negligent failure to act, or its own willful misconduct except that (1) this Subsection shall not be construed to limit the effect of Subsection (a) of this Section; (2) the Trustee shall not be liable for any error of judgment made in good faith by a Responsible Officer, unless it shall be proved that the Trustee was negligent in ascertaining the pertinent facts; and (3) the Trustee shall not be liable with respect to any action taken or omitted to be taken by it in good faith in accordance with the direction of Holders pursuant to Section 5.12 relating to the time, method and place of conducting any proceeding for any remedy available to the Trustee, or exercising any trust or power conferred upon the Trustee, under this Indenture with respect to the Securities of such series. (d) No provision of this Indenture shall require the Trustee to expend or risk its own funds or otherwise incur any financial liability in the performance of any of its duties hereunder, or in the exercise of any of its rights or powers, if there shall be reasonable grounds for believing that repayment of such funds or adequate indemnity against such risk or liability is not reasonably assured to it. (e) Whether or not therein expressly so provided, every provision of this Indenture relating to the conduct or affecting the liability of or affording protection to the Trustee shall be subject to the provisions of this Section.
43 SECTION 6.2. Notice of Defaults. Within 90 days after actual knowledge by a Responsible Officer of the Trustee of the occurrence of any default hereunder with respect to the Securities of any series, the Trustee shall transmit by mail to all Holders of Securities of such series, as their names and addresses appear in the Securities Register, notice of such default, unless such default shall have been cured or waived; provided, however, that, except in the case of a default in the payment of the principal of (or premium, if any) or interest (including any Additional Interest) on any Security of such series, the Trustee shall be protected in withholding such notice if and so long as the board of directors, the executive committee or a trust committee of directors and/or Responsible Officers of the Trustee in good faith determines that the withholding of such notice is in the interests of the Holders of Securities of such series; and provided, further, that, in the case of any default of the character specified in Section 5.1(3), no such notice to Holders of Securities of such series shall be given until at least 30 days after the occurrence thereof. For the purpose of this Section, the term "default" means any event which is, or after notice or lapse of time or both would become, an Event of Default with respect to Securities of such series. SECTION 6.3. Certain Rights of Trustee. Subject to the provisions of Section 6.1: (a) the Trustee may rely and shall be protected in acting or refraining from acting upon any resolution, certificate, statement, instrument, opinion, report, notice, request, direction, consent, order, bond, debenture, Security or other paper or document believed by it to be genuine and to have been signed or presented by the proper party or parties; (b) any request or direction of the Company mentioned herein shall be sufficiently evidenced by a Company Request or Company Order and any resolution of the Board of Directors may be sufficiently evidenced by a Board Resolution; (c) whenever in the administration of this Indenture the Trustee shall deem it desirable that a matter be proved or established prior to taking, suffering or omitting any action hereunder, the Trustee (unless other evidence be herein specifically prescribed) may, in the absence of bad faith on its part, rely upon an Officers' Certificate; (d) the Trustee may consult with counsel and the advice of such counsel or any Opinion of Counsel shall be full and complete authorization and protection in respect of any action taken, suffered or omitted by it hereunder in good faith and in reliance thereon; (e) the Trustee shall be under no obligation to exercise any of the rights or powers vested in it by this Indenture at the request or direction of any of the Holders pursuant to this Indenture, unless such Holders shall have offered to the Trustee reasonable security or indemnity against the costs, expenses and liabilities which might be incurred by it in compliance with such request or direction;
44 (f) the Trustee shall not be bound to make any investigation into the facts or matters stated in any resolution, certificate, statement, instrument, opinion, report, notice, request, direction, consent, order, bond, indenture, Security or other paper or document, but the Trustee in its discretion may make such inquiry or investigation into such facts or matters as it may see fit, and, if the Trustee shall determine to make such inquiry or investigation, it shall be entitled to examine the books, records and premises of the Company, personally or by agent or attorney; and (g) the Trustee may execute any of the trusts or powers hereunder or perform any duties hereunder either directly or by or through agents or attorneys and the Trustee shall not be responsible for any misconduct or negligence on the part of any agent or attorney appointed with due care by it hereunder. SECTION 6.4. Not Responsible for Recitals or Issuance of Securities. The recitals contained herein and in the Securities, except the Trustee's certificates of authentication, shall be taken as the statements of the Company, and neither the Trustee nor any Authenticating Agent assumes any responsibility for their correctness. The Trustee makes no representations as to the validity or sufficiency of this Indenture or of the Securities. Neither the Trustee nor any Authenticating Agent shall be accountable for the use or application by the Company of the Securities or the proceeds thereof. SECTION 6.5. May Hold Securities. The Trustee, any Authenticating Agent, any Paying Agent, any Securities Registrar or any other agent of the Company, in its individual or any other capacity, may become the owner or pledgee of Securities and, subject to Sections 6.8 and 6.13, may otherwise deal with the Company with the same rights it would have if it were not Trustee, Authenticating Agent, Paying Agent, Securities Registrar or such other agent. SECTION 6.6. Money Held in Trust. Money held by the Trustee in trust hereunder need not be segregated from other funds except to the extent required by law. The Trustee shall be under no liability for interest on any money received by it hereunder except as otherwise agreed with the Company. SECTION 6.7. Compensation and Reimbursement. The Company agrees (1) to pay to the Trustee from time to time reasonable compensation for all services rendered by it hereunder in such amounts as the Company and the Trustee shall agree from time to time (which compensation shall not be limited by any provision of law in regard to the compensation of a trustee of an express trust);
45 (2) to reimburse the Trustee upon its request for all reasonable expenses, disbursements and advances incurred or made by the Trustee in accordance with any provision of this Indenture (including the reasonable compensation and the expenses and disbursements of its agents and counsel), except any such expense, disbursement or advance as may be attributable to its negligence or bad faith; and (3) to indemnify the Trustee for, and to hold it harmless against, any loss, liability or expense (including the reasonable compensation and the expenses and disbursements of its agents and counsel) incurred without negligence or bad faith, arising out of or in connection with the acceptance or administration of this trust or the performance of its duties hereunder, including the costs and expenses of defending itself against any claim or liability in connection with the exercise or performance of any of its powers or duties hereunder. This indemnification shall survive the termination of this Agreement. To secure the Company's payment obligations in this Section, the Company and the Holders agree that the Trustee shall have a lien prior to the Securities on all money or property held or collected by the Trustee. Such lien shall survive the satisfaction and discharge of this Indenture. When the Trustee incurs expenses or renders services after an Event of Default specified in Section 5.1(4) or (5) occurs, the expenses and the compensation for the services are intended to constitute expenses of administration under the Bankruptcy Reform Act of 1978 or any successor statute. SECTION 6.8. Disqualification; Conflicting Interests. The Trustee for the Securities of any series issued hereunder shall be subject to the provisions of Section 310(b) of the Trust Indenture Act. Nothing herein shall prevent the Trustee from filing with the Commission the application referred to in the second to last paragraph of said Section 310(b). SECTION 6.9. Corporate Trustee Required; Eligibility. There shall at all times be a Trustee hereunder which shall be (a) a corporation organized and doing business under the laws of the United States of America or of any State or Territory or the District of Columbia, authorized under such laws to exercise corporate trust powers and subject to supervision or examination by Federal, State, Territorial or District of Columbia authority, or (b) a corporation or other Person organized and doing business under the laws of a foreign government that is permitted to act as Trustee pursuant to a rule, regulation or order of the Commission, authorized under such laws to exercise corporate trust powers, and subject to supervision or examination by authority of such foreign government or a political subdivision thereof substantially equivalent to supervision or examination applicable to United States institutional trustees,
46 in either case having a combined capital and surplus of at least $50,000,000, subject to supervision or examination by Federal or State authority. If such corporation publishes reports of condition at least annually, pursuant to law or to the requirements of the aforesaid supervising or examining authority, then, for the purposes of this Section, the combined capital and surplus of such corporation shall be deemed to be its combined capital and surplus as set forth in its most recent report of condition so published. If at any time the Trustee shall cease to be eligible in accordance with the provisions of this Section, it shall resign immediately in the manner and with the effect hereinafter specified in this Article. Neither the Company nor any Person directly or indirectly controlling, controlled by or under common control with the Company shall serve as Trustee for the Securities of any series issued hereunder. SECTION 6.10. Resignation and Removal; Appointment of Successor. (a) No resignation or removal of the Trustee and no appointment of a successor Trustee pursuant to this Article shall become effective until the acceptance of appointment by the successor Trustee under Section 6.11. (b) The Trustee may resign at any time with respect to the Securities of one or more series by giving written notice thereof to the Company. If an instrument of acceptance by a successor Trustee shall not have been delivered to the Trustee within 30 days after the giving of such notice of resignation, the resigning Trustee may petition any court of competent jurisdiction for the appointment of a successor Trustee with respect to the Securities of such series. (c) The Trustee may be removed at any time with respect to the Securities of any series by Act of the Holders of a majority in principal amount of the Outstanding Securities of such series, delivered to the Trustee and to the Company. (d) If at any time: (1) the Trustee shall fail to comply with Section 6.8 after written request therefor by the Company or by any Holder who has been a bona fide Holder of a Security for at least six months, or (2) the Trustee shall cease to be eligible under Section 6.9 and shall fail to resign after written request therefor by the Company or by any such Holder, or (3) the Trustee shall become incapable of acting or shall be adjudged a bankrupt or insolvent or a receiver of the Trustee or of its property shall be appointed or any public officer shall take charge or control of the Trustee or of its property or affairs for the purpose of rehabilitation, conservation or liquidation, then, in any such case, (i) the Company, acting pursuant to the authority of a Board Resolution, may remove the Trustee with respect to all Securities, or (ii) subject to Section 5.14, any Holder who has been a bona fide Holder of a Security for at least six months may, on behalf of himself and all others similarly situated, petition any court of competent jurisdiction for the removal of the Trustee with respect to all Securities and the appointment of a successor Trustee or Trustees.
47 (e) If the Trustee shall resign, be removed or become incapable of acting, or if a vacancy shall occur in the office of Trustee for any cause with respect to the Securities of one or more series, the Company, by a Board Resolution, shall promptly appoint a successor Trustee with respect to the Securities of that or those series. If, within one year after such resignation, removal or incapability, or the occurrence of such vacancy, a successor Trustee with respect to the Securities of any series shall be appointed by Act of the Holders of a majority in principal amount of the Outstanding Securities of such series delivered to the Company and the retiring Trustee, the successor Trustee so appointed shall, forthwith upon its acceptance of such appointment, become the successor Trustee with respect to the Securities of such series and supersede the successor Trustee appointed by the Company. If no successor Trustee with respect to the Securities of any series shall have been so appointed by the Company or the Holders and accepted appointment in the manner hereinafter provided, any Holder who has been a bona fide Holder of a Security for at least six months may, subject to Section 5.14, on behalf of himself and all others similarly situated, petition any court of competent jurisdiction for the appointment of a successor Trustee with respect to the Securities of such series. (f) The Company shall give notice of each resignation and each removal of the Trustee with respect to the Securities of any series and each appointment of a successor Trustee with respect to the Securities of any series by mailing written notice of such event by first-class mail, postage prepaid, to the Holders of Securities of such series as their names and addresses appear in the Securities Register. Each notice shall include the name of the successor Trustee with respect to the Securities of such series and the address of its Corporate Trust Office. SECTION 6.11. Acceptance of Appointment by Successor. (a) In case of the appointment hereunder of a successor Trustee with respect to all Securities, every such successor Trustee so appointed shall execute, acknowledge and deliver to the Company and to the retiring Trustee an instrument accepting such appointment, and thereupon the resignation or removal of the retiring Trustee shall become effective and such successor Trustee, without any further act, deed or conveyance, shall become vested with all the rights, powers, trusts and duties of the retiring Trustee; but, on the request of the Company or the successor Trustee, such retiring Trustee shall, upon payment of its charges, execute and deliver an instrument transferring to such successor Trustee all the rights, powers and trusts of the retiring Trustee and shall duly assign, transfer and deliver to such successor Trustee all property and money held by such retiring Trustee hereunder. (b) In case of the appointment hereunder of a successor Trustee with respect to the Securities of one or more (but not all) series, the Company, the retiring Trustee and each successor Trustee with respect to the Securities of one or more series shall execute and deliver an indenture supplemental hereto wherein each successor Trustee shall accept such appointment and which (1) shall contain such provisions as shall be necessary or desirable to transfer and confirm to, and to vest in, each successor Trustee all the rights, powers, trusts and duties of the retiring Trustee with respect to the Securities of that or those series to which the appointment of such successor Trustee relates, (2) if the retiring Trustee is not retiring with respect to all Securities, shall contain such provisions as shall be deemed necessary or desirable to confirm that all the rights, powers, trusts and duties of the retiring Trustee with respect to the Securities of
48 that or those series as to which the retiring Trustee is not retiring shall continue to be vested in the retiring Trustee, and (3) shall add to or change any of the provisions of this Indenture as shall be necessary to provide for or facilitate the administration of the trusts hereunder by more than one Trustee, it being understood that nothing herein or in such supplemental indenture shall constitute such Trustees co-trustees of the same trust and that each such Trustee shall be trustee of a trust or trusts hereunder separate and apart from any trust or trusts hereunder administered by any other such Trustee; and upon the execution and delivery of such supplemental indenture the resignation or removal of the retiring Trustee shall become effective to the extent provided therein and each such successor Trustee, without any further act, deed or conveyance, shall become vested with all the rights, powers, trusts, and duties of the retiring Trustee with respect to the Securities of that or those series to which the appointment of such successor Trustee relates; but, on request of the Company or any successor Trustee, such retiring Trustee shall duly assign, transfer and deliver to such successor Trustee all property and money held by such retiring Trustee hereunder with respect to the Securities of that or those series to which the appointment of such successor Trustee relates. (c) Upon request of any such successor Trustee, the Company shall execute any and all instruments for more fully and certainly vesting in and confirming to such successor Trustee all rights, powers and trusts referred to in paragraph (a) or (b) of this Section, as the case may be. (d) No successor Trustee shall accept its appointment unless at the time of such acceptance such successor Trustee shall be qualified and eligible under this Article. SECTION 6.12. Merger, Conversion, Consolidation or Succession to Business. Any corporation into which the Trustee may be merged or converted or with which it may be consolidated, or any corporation resulting from any merger, conversion or consolidation to which the Trustee shall be a party, or any corporation succeeding to all or substantially all of the corporate trust business of the Trustee, shall be the successor of the Trustee hereunder, provided such corporation shall be otherwise qualified and eligible under this Article, without the execution or filing of any paper or any further act on the part of any of the parties hereto. In case any Securities shall have been authenticated, but not delivered, by the Trustee then in office, any successor by merger, conversion or consolidation to such authenticating Trustee may adopt such authentication and deliver the Securities so authenticated, and in case any Securities shall not have been authenticated, any successor to the Trustee may authenticate such Securities either in the name of any predecessor Trustee or in the name of such successor Trustee, and in all cases the certificate of authentication shall have the full force which it is provided anywhere in the Securities or in this Indenture that the certificate of the Trustee shall have. SECTION 6.13. Preferential Collection of Claims Against Company. If and when the Trustee shall be or become a creditor of the Company (or any other obligor upon the Securities), the Trustee shall be subject to the provisions of the Trust Indenture Act regarding the collection of claims against the Company (or any such other obligor).
49 SECTION 6.14. Appointment of Authenticating Agent. The Trustee may appoint an Authenticating Agent or Agents with respect to one or more series of Securities which shall be authorized to act on behalf of the Trustee to authenticate Securities of such series issued upon original issue and upon exchange, registration of transfer or partial redemption thereof or pursuant to Section 3.6, and Securities so authenticated shall be entitled to the benefits of this Indenture and shall be valid and obligatory for all purposes as if authenticated by the Trustee hereunder. Wherever reference is made in this Indenture to the authentication and delivery of Securities by the Trustee or the Trustee's certificate of authentication, such reference shall be deemed to include authentication and delivery on behalf of the Trustee by an Authenticating Agent. Each Authenticating Agent shall be acceptable to the Company and shall at all times be a corporation organized and doing business under the laws of the United States of America, or of any State or Territory or the District of Columbia, authorized under such laws to act as Authenticating Agent, having a combined capital and surplus of not less than $50,000,000 and subject to supervision or examination by Federal or State authority. If such Authenticating Agent publishes reports of condition at least annually, pursuant to law or to the requirements of said supervising or examining authority, then for the purposes of this Section the combined capital and surplus of such Authenticating Agent shall be deemed to be its combined capital and surplus as set forth in its most recent report of condition so published. If at any time an Authenticating Agent shall cease to be eligible in accordance with the provisions of this Section, such Authenticating Agent shall resign immediately in the manner and with the effect specified in this Section. Any corporation into which an Authenticating Agent may be merged or converted or with which it may be consolidated, or any corporation resulting from any merger, conversion or consolidation to which such Authenticating Agent shall be a party, or any corporation succeeding to all or substantially all of the corporate trust business of an Authenticating Agent shall be the successor Authenticating Agent hereunder, provided such corporation shall be otherwise eligible under this Section, without the execution or filing of any paper or any further act on the part of the Trustee or the Authenticating Agent. An Authenticating Agent may resign at any time by giving written notice thereof to the Trustee and to the Company. The Trustee may at any time terminate the agency of an Authenticating Agent by giving written notice thereof to such Authenticating Agent and to the Company. Upon receiving such a notice of resignation or upon such a termination, or in case at any time such Authenticating Agent shall cease to be eligible in accordance with the provisions of this Section, the Trustee may appoint a successor Authenticating Agent which shall be acceptable to the Company and shall give notice of such appointment in the manner provided in Section 1.6 to all Holders of Securities of the series with respect to which such Authenticating Agent will serve. Any successor Authenticating Agent upon acceptance of its appointment hereunder shall become vested with all the rights, powers and duties of its predecessor hereunder, with like effect as if originally named as an Authenticating Agent. No successor Authenticating Agent shall be appointed unless eligible under the provision of this Section.
50 The Trustee agrees to pay to each Authenticating Agent from time to time reasonable compensation for its services under this Section, and the Trustee shall be entitled to be reimbursed for such payments, subject to the provisions of Section 6.7. If an appointment with respect to one or more series is made pursuant to this Section, the Securities of such series may have endorsed thereon, in addition to the Trustee's certificate of authentication, an alternative certificate of authentication in the following form: This is one of the Securities referred to in the within mentioned Indenture. Dated: ------------------------------------ As Trustee By:--------------------------------- As Authenticating Agent By:--------------------------------- Authorized Officer ARTICLE VII HOLDER'S LISTS AND REPORTS BY TRUSTEE AND COMPANY SECTION 7.1. Company to Furnish Trustee Names and Addresses of Holders. The Company will furnish or cause to be furnished to the Trustee: (a) semi-annually, not more than 15 days after and in each year, a list, in such form as the Trustee may reasonably require, of the names and addresses of the Holders as of such and , and (b) at such other times as the Trustee may request in writing, within 30 days after the receipt by the Company of any such request, a list of similar form and content as of a date not more than 15 days prior to the time such list is furnished, excluding from any such list names and addresses received by the Trustee in its capacity as Securities Registrar.
51 SECTION 7.2. Preservation of Information, Communications to Holders. (a) The Trustee shall preserve, in as current a form as is reasonably practicable, the names and addresses of Holders contained in the most recent list furnished to the Trustee as provided in Section 7.1 and the names and addresses of Holders received by the Trustee in its capacity as Securities Registrar. The Trustee may destroy any list furnished to it as provided in Section 7.1 upon receipt of a new list so furnished. (b) The rights of Holders to communicate with other Holders with respect to their rights under this Indenture or under the Securities, and the corresponding rights and privileges of the Trustee, shall be as provided in the Trust Indenture Act. (c) Every Holder of Securities, by receiving and holding the same, agrees with the Company and the Trustee that neither the Company nor the Trustee nor any agent of either of them shall be held accountable by reason of the disclosure of information as to the names and addresses of the Holders made pursuant to the Trust Indenture Act. SECTION 7.3. Reports by Trustee. (a) The Trustee shall transmit to Holders such reports concerning the Trustee and its actions under this Indenture as may be required pursuant to the Trust Indenture Act, at the times and in the manner provided pursuant thereto. (b) Reports so required to be transmitted at stated intervals of not more than 12 months shall be transmitted no later than in each calendar year, commencing with the first after the first issuance of Securities under this Indenture. (c) A copy of each such report shall, at the time of such transmission to Holders, be filed by the Trustee with each stock exchange upon which any Securities are listed and also with the Commission. The Company will notify the Trustee when any Securities are listed on any stock exchange. SECTION 7.4. Reports by Company. The Company shall file with the Trustee and with the Commission, and transmit to Holders, such information, documents and other reports, and such summaries thereof, as may be required pursuant to the Trust Indenture Act at the times and in the manner provided in the Trust Indenture Act; provided that any such information, documents or reports required to be filed with the Commission pursuant to Section 13 or Section 15(d) of the Exchange Act shall be filed with the Trustee within 15 days after the same is required to be filed with the Commission. Notwithstanding that the Company may not be required to remain subject to the reporting requirements of Section 13 or 15(d) of the Exchange Act, the Company shall continue to file with the Commission and provide the Trustee with the annual reports and the information, documents and other reports which are specified in Sections 13 and 15(d) of the Exchange Act. The Company also shall comply with the other provisions of Trust Indenture Act Section 314(a).
52 ARTICLE VIII CONSOLIDATION, MERGER, CONVEYANCE, TRANSFER OR LEASE SECTION 8.1. Company May Consolidate, Etc., Only on Certain Terms. The Company shall not consolidate with or merge into any other Person or convey, transfer or lease its properties and assets substantially as an entirety to any Person, and no Person shall consolidate with or merge into the Company or convey, transfer or lease its properties and assets substantially as an entirety to the Company, unless: (1) in case the Company shall consolidate with or merge into another Person or convey, transfer or lease its properties and assets substantially as an entirety to any Person, the corporation formed by such consolidation or into which the Company is merged or the Person which acquires by conveyance or transfer, or which leases, the properties and assets of the Company substantially as an entirety shall be a corporation, partnership or trust organized and existing under the laws of the United States of America or any State or the District of Columbia and shall expressly assume, by an indenture supplemental hereto, executed and delivered to the Trustee, in form satisfactory to the Trustee, the due and punctual payment of the principal of (and premium, if any) and interest (including any Additional Interest) on all the Securities and the performance of every covenant of this Indenture on the part of the Company to be performed or observed; (2) immediately after giving effect to such transaction, no Event of Default, and no event which, after notice or lapse of time, or both, would become an Event of Default, shall have happened and be continuing; (3) in the case of the Securities of a series issued to a Trust, such consolidation, merger, conveyance, transfer or lease is permitted under the related Trust Agreement and Guarantee and does not give rise to any breach or violation of the related Trust Agreement or Guarantee; and (4) the Company has delivered to the Trustee an Officers' Certificate and an Opinion of Counsel, each stating that such consolidation, merger, conveyance, transfer or lease and any such supplemental indenture comply with this Article and that all conditions precedent herein provided for relating to such transaction have been complied with; and the Trustee, subject to Section 6.1, may rely upon such Officers' Certificate and Opinion of Counsel as conclusive evidence that such transaction complies with this Section 8.1.
53 SECTION 8.2. Successor Corporation Substituted. Upon any consolidation or merger by the Company with or into any other Person, or any conveyance, transfer or lease by the Company of its properties and assets substantially as an entirety to any Person in accordance with Section 8.1, the successor corporation formed by such consolidation or into which the Company is merged or to which such conveyance, transfer or lease is made shall succeed to, and be substituted for, and may exercise every right and power of, the Company under this Indenture with the same effect as if such successor Person had been named as the Company herein; and in the event of any such conveyance, transfer or lease the Company shall be discharged from all obligations and covenants under the Indenture and the Securities and may be dissolved and liquidated. Such successor Person may cause to be signed, and may issue either in its own name or in the name of the Company, any or all of the Securities issuable hereunder which theretofore shall not have been signed by the Company and delivered to the Trustee; and, upon the order of such successor Person instead of the Company and subject to all the terms, conditions and limitations in this Indenture prescribed, the Trustee shall authenticate and shall deliver any Securities which previously shall have been signed and delivered by the officers of the Company to the Trustee for authentication pursuant to such provisions and any Securities which such successor Person thereafter shall cause to be signed and delivered to the Trustee on its behalf for the purpose pursuant to such provisions. All the Securities so issued shall in all respects have the same legal rank and benefit under this Indenture as the Securities theretofore or thereafter issued in accordance with the terms of this Indenture as though all of such Securities had been issued at the date of the execution hereof. In case of any such consolidation, merger, sale, conveyance or lease, such changes in phraseology and form may be made in the Securities thereafter to be issued as may be appropriate. ARTICLE IX SUPPLEMENTAL INDENTURES SECTION 9.1. Supplemental Indentures without Consent of Holders. Without the consent of any Holders, the Company, when authorized by a Board Resolution, and the Trustee, at any time and from time to time, may enter into one or more indentures supplemental hereto, in form satisfactory to the Trustee, for any of the following purposes: (1) to evidence the succession of another Person to the Company, and the assumption by any such successor of the covenants of the Company herein and in the Securities contained; or (2) to convey, transfer, assign, mortgage or pledge any property to or with the Trustee or to surrender any right or power herein conferred upon the Company; or
54 (3) to establish the form or terms of Securities of any series as permitted by Sections 2.1 or 3.1; or (4) to add to the covenants of the Company for the benefit of the Holders of all or any series of Securities (and if such covenants are to be for the benefit of less than all series of Securities, stating that such covenants are expressly being included solely for the benefit of such series) or to surrender any right or power herein conferred upon the Company; or (5) to add any additional Events of Default for the benefit of the Holders of all or any series of Securities (and if such additional Events of Default are to be for the benefit of less than all series of Securities, stating that such additional Events of Default are expressly being included solely for the benefit of such series); or (6) to change or eliminate any of the provisions of this Indenture, provided that any such change or elimination shall become effective only when there is no Security Outstanding of any series created prior to the execution of such supplemental indenture which is entitled to the benefit of such provision; or (7) to cure any ambiguity, to correct or supplement any provision herein which may be defective or inconsistent with any other provision herein, or to make any other provisions with respect to matters or questions arising under this Indenture, provided that such action pursuant to this clause (7) shall not adversely affect the interest of the Holders of Securities of any series in any material respect or, in the case of the Securities of a series issued to a Trust and for so long as any of the corresponding series of Preferred Securities issued by such Trust shall remain outstanding, the holders of such Preferred Securities; or (8) to evidence and provide for the acceptance of appointment hereunder by a successor Trustee with respect to the Securities of one or more series and to add to or change any of the provisions of this Indenture as shall be necessary to provide for or facilitate the administration of the trusts hereunder by more than one Trustee, pursuant to the requirements of Section 6.11(b); or (9) to comply with the requirements of the Commission in order to effect or maintain the qualification of this Indenture under the Trust Indenture Act. SECTION 9.2. Supplemental Indentures with Consent of Holders. With the consent of the Holders of not less than a majority in principal amount of the Outstanding Securities of each series affected by such supplemental indenture, by Act of said Holders delivered to the Company and the Trustee, the Company, when authorized by a Board Resolution, and the Trustee may enter into an indenture or indentures supplemental hereto for the purpose of adding any provisions to or changing in any manner or eliminating any of the provisions of this Indenture or of modifying in any manner the rights of the Holders of Securities of such series under this Indenture; provided, however, that no such supplemental indenture shall, without the consent of the Holder of each Outstanding Security affected thereby,
55 (1) except to the extent permitted by Section 3.11 or as otherwise specified as contemplated by Section 2.1 or Section 3.1 with respect to the deferral of the payment of interest on the Securities of any series, change the Stated Maturity of the principal of, or any installment of interest (including any Additional Interest) on, any Security, or reduce the principal amount thereof or the rate of interest thereon or reduce any premium payable upon the redemption thereof, or reduce the amount of principal of a Discount Security that would be due and payable upon a declaration of acceleration of the Maturity thereof pursuant to Section 5.2, or change the place of payment where, or the coin or currency in which, any Security or interest thereon is payable, or impair the right to institute suit for the enforcement of any such payment on or after the Stated Maturity thereof (or, in the case of redemption, on or after the Redemption Date), or (2) reduce the percentage in principal amount of the Outstanding Securities of any series, the consent of whose Holders is required for any such supplemental indenture, or the consent of whose Holders is required for any waiver (of compliance with certain provisions of this Indenture or certain defaults hereunder and their consequences) provided for in this Indenture, or (3) modify any of the provisions of this Section, Section 5.13 or Section 10.5, except to increase any such percentage or to provide that certain other provisions of this Indenture cannot be modified or waived without the consent of the Holder of each Security affected thereby; or (4) modify the provisions in Article XIII of this Indenture with respect to the subordination of Outstanding Securities of any series in a manner adverse to the Holders thereof; provided, further, that, in the case of the Securities of a series issued to a Trust, so long as any of the corresponding series of Preferred Securities issued by such Trust remains outstanding, (i) no such amendment shall be made that adversely affects the holders of such Preferred Securities in any material respect, and no termination of this Indenture shall occur, and no waiver of any Event of Default or compliance with any covenant under this Indenture shall be effective, without the prior consent of the holders of at least a majority of the aggregate liquidation preference of such Preferred Securities then outstanding unless and until the principal (and premium, if any) of the Securities of such series and all accrued and, subject to Section 3.7, unpaid interest (including any Additional Interest) thereon have been paid in full and (ii) no amendment shall be made to Section 5.8 of this Indenture that would impair the rights of the holders of Preferred Securities provided therein without the prior consent of the holders of each Preferred Security then outstanding unless and until the principal (and premium, if any) of the Securities of such series and all accrued and (subject to Section 3.7) unpaid interest (including any Additional Interest) thereon have been paid in full. A supplemental indenture that changes or eliminates any covenant or other provision of this Indenture that has expressly been included solely for the benefit of one or more particular series of Securities or Preferred Securities, or which modifies the rights of the Holders of Securities or holders of Preferred Securities of such series with respect to such covenant or other provision, shall be deemed not to affect the rights under this Indenture of the Holders of Securities or holders of Preferred Securities of any other series.
56 It shall not be necessary for any Act of Holders under this Section to approve the particular form of any proposed supplemental indenture, but it shall be sufficient if such Act shall approve the substance thereof. SECTION 9.3. Execution of Supplemental Indentures. In executing or accepting the additional trusts created by any supplemental indenture permitted by this Article or the modifications thereby of the trusts created by this Indenture, the Trustee shall be entitled to receive, and (subject to Section 6.1) shall be fully protected in relying upon, an Officers' Certificate and an Opinion of Counsel stating that the execution of such supplemental indenture is authorized or permitted by this Indenture, and that all conditions precedent have been complied with. The Trustee may, but shall not be obligated to, enter into any such supplemental indenture which affects the Trustee's own rights, duties or immunities under this Indenture or otherwise. SECTION 9.4. Effect of Supplemental Indentures. Upon the execution of any supplemental indenture under this Article, this Indenture shall be modified in accordance therewith, and such supplemental indenture shall form a part of this Indenture for all purposes; and every Holder of Securities theretofore or thereafter authenticated and delivered hereunder shall be bound thereby. SECTION 9.5. Conformity with Trust Indenture Act. Every supplemental indenture executed pursuant to this Article shall conform to the requirements of the Trust Indenture Act as then in effect. SECTION 9.6. Reference in Securities to Supplemental Indentures. Securities authenticated and delivered after the execution of any supplemental indenture pursuant to this Article may, and shall if required by the Company, bear a notation in form approved by the Company as to any matter provided for in such supplemental indenture. If the Company shall so determine, new Securities of any series so modified as to conform, in the opinion of the Company, to any such supplemental indenture may be prepared and executed by the Company and authenticated and delivered by the Trustee in exchange for Outstanding Securities of such series. ARTICLE X COVENANTS SECTION 10.1. Payment of Principal, Premium and Interest. The Company covenants and agrees for the benefit of each series of securities that it will duly and punctually pay the principal of (and premium, if any) and interest on the Securities of
57 that series in accordance with the terms of such Securities and this Indenture. SECTION 10.2. Maintenance of Office or Agency. The Company will maintain in each Place of Payment for any series of Securities, an office or agency where Securities of that series may be presented or surrendered for payment and an office or agency where Securities of that series may be surrendered for transfer or exchange and where notices and demands to or upon the Company in respect of the Securities of that series and this Indenture may be served. The Company initially appoints the Trustee, acting through its Corporate Trust Office, as its agent for said purposes. The Company will give prompt written notice to the Trustee of any change in the location of any such office or agency. If at any time the Company shall fail to maintain such office or agency or shall fail to furnish the Trustee with the address thereof, such presentations, surrenders, notices and demands may be made or served at the Corporate Trust Office of the Trustee, and the Company hereby appoints the Trustee as its agent to receive all such presentations, surrenders, notices and demands. The Company may also from time to time designate one or more other offices or agencies where the Securities may be presented or surrendered for any or all of such purposes, and may from time to time rescind such designations; provided, however, that no such designation or rescission shall in any manner relieve the Company of its obligation to maintain an office or agency in each Place of Payment for Securities of any series for such purposes. The Company will give prompt written notice to the Trustee of any such designation and any change in the location of any such office or agency. SECTION 10.3. Money for Security Payments to be Held in Trust. If the Company shall at any time act as its own Paying Agent with respect to any series of Securities, it will, on or before each due date of the principal of (and premium, if any) or interest on any of the Securities of such series, segregate and hold in trust for the benefit of the Persons entitled thereto a sum sufficient to pay the principal (and premium, if any) or interest so becoming due until such sums shall be paid to such Persons or otherwise disposed of as herein provided, and will promptly notify the Trustee of its failure so to act. Whenever the Company shall have one or more Paying Agents, it will, prior to 10:00 a.m. New York City time on each due date of the principal of or interest on any Securities, deposit with a Paying Agent a sum sufficient to pay the principal (and premium, if any) or interest so becoming due, such sum to be held in trust for the benefit of the Persons entitled to such principal and premium (if any) or interest, and (unless such Paying Agent is the Trustee) the Company will promptly notify the Trustee of its failure so to act. The Company will cause each Paying Agent other than the Trustee to execute and deliver to the Trustee an instrument in which such Paying Agent shall agree with the Trustee, subject to the provisions of this Section, that such Paying Agent will:
58 (1) hold all sums held by it for the payment of the principal of (and premium, if any) or interest on Securities in trust for the benefit of the Persons entitled thereto until such sums shall be paid to such Persons or otherwise disposed of as herein provided; (2) give the Trustee notice of any default by the Company (or any other obligor upon the Securities) in the making of any payment of principal (and premium, if any) or interest; (3) at any time during the continuance of any such default, upon the written request of the Trustee, forthwith pay to the Trustee all sums so held in trust by such Paying Agent; and (4) comply with the provisions of the Trust Indenture Act applicable to it as a Paying Agent. The Company may at any time, for the purpose of obtaining the satisfaction and discharge of this Indenture or for any other purpose, pay, or by Company Order direct any Paying Agent to pay, to the Trustee all sums held in trust by the Company or such Paying Agent, such sums to be held by the Trustee upon the same trusts as those upon which such sums were held by the Company or such Paying Agent; and, upon such payment by any Paying Agent to the Trustee, such Paying Agent shall be released from all further liability with respect to such money. Any money deposited with the Trustee or any Paying Agent, or then held by the Company, in trust for the payment of the principal of (and premium, if any) or interest on any Security and remaining unclaimed for two years after such principal (and premium, if any) or interest has become due and payable shall (unless otherwise required by mandatory provision of applicable escheat or abandoned or unclaimed property law) be paid on Company Request to the Company, or (if then held by the Company) shall (unless otherwise required by mandatory provision of applicable escheat or abandoned or unclaimed property law) be discharged from such trust; and the Holder of such Security shall thereafter, as an unsecured general creditor, look only to the Company for payment thereof, and all liability of the Trustee or such Paying Agent with respect to such trust money, and all liability of the Company as trustee thereof, shall thereupon cease; provided, however, that the Trustee or such Paying Agent, before being required to make any such repayment, may at the expense of the Company cause to be published once, in a newspaper published in the English language, customarily published on each Business Day and of general circulation in the Borough of Manhattan, The City of New York, notice that such money remains unclaimed and that, after a date specified therein, which shall not be less than 30 days from the date of such publication, any unclaimed balance of such money then remaining will be repaid to the Company.
59 SECTION 10.4. Statement as to Compliance. The Company shall deliver to the Trustee, within 120 days after the end of each calendar year of the Company ending after the date hereof, an Officers' Certificate covering the preceding calendar year, stating whether or not to the best knowledge of the signers thereof the Company is in default in the performance, observance or fulfillment of or compliance with any of the terms, provisions, covenants and conditions of this Indenture, and if the Company shall be in default, specifying all such defaults and the nature and status thereof of which they may have knowledge. For the purpose of this Section 10.4, compliance shall be determined without regard to any grace period or requirement of notice provided pursuant to the terms of this Indenture. SECTION 10.5. Waiver of Certain Covenants. The Company may omit in any particular instance to comply with any covenant or condition provided pursuant to Section 3.1, 9.1(3) or 9.1(4) with respect to the Securities of any series, if before or after the time for such compliance the Holders of at least a majority in principal amount of the Outstanding Securities of such series shall, by Act of such Holders, either waive such compliance in such instance or generally waive compliance with such covenant or condition, but no such waiver shall extend to or affect such covenant or condition except to the extent so expressly waived, and, until such waiver shall become effective, the obligations of the Company in respect of any such covenant or condition shall remain in full force and effect. SECTION 10.6. Additional Sums. In the case of the Securities of a series issued to a Trust, so long as no Event of Default has occurred and is continuing and except as otherwise specified as contemplated by Section 2.1 or Section 3.1, in the event that (i) a Trust is the Holder of all of the Outstanding Securities of such series, (ii) a Tax Event in respect of such Trust shall have occurred and be continuing and (iii) the Company shall not have (A) redeemed the Securities of such series pursuant to Section 11.7(b) or (B) terminated such Trust pursuant to Section 9.2(b) of the related Trust Agreement, the Company shall pay to such Trust (and its permitted successors or assigns under the related Trust Agreement) for so long as such Trust (or its permitted successor or assignee) is the registered holder of any Securities of such series, such additional amounts as may be necessary in order that the amount of Distributions (including any Additional Amounts (as defined in such Trust Agreement)) then due and payable by such Trust on the related Preferred Securities and Common Securities that at any time remain outstanding in accordance with the terms thereof shall not be reduced as a result of any Additional Taxes (the "Additional Sums"). Whenever in this Indenture or the Securities there is a reference in any context to the payment of principal of or interest on the Securities, such mention shall be deemed to include mention of the payments of the Additional Sums provided for in this paragraph to the extent that, in such context, Additional Sums are, were or would be payable in respect thereof pursuant to the provisions of this paragraph and express mention of the payment of Additional Sums (if applicable) in any provisions hereof shall not be construed as excluding Additional Sums in those provisions hereof where such express mention is not made; provided, however, that the deferral of the payment of interest pursuant to Section 3.11 or the Securities shall not defer the payment of any Additional Sums that may be due and payable.
60 SECTION 10.7. Additional Covenants. The Company covenants and agrees with each Holder of Securities of each series that it shall not, and it shall not permit any Subsidiary of the Company to, (a) declare or pay any dividends or distributions on, or redeem purchase, acquire or make a liquidation payment with respect to, any shares of the Company's capital stock, or (b) make any payment of principal of or interest or premium, if any, on or repay, repurchase or redeem any debt securities of the Company that rank pari passu with or junior in interest to the Securities of such series or make any guarantee payments with respect to any guarantee by the Company of debt securities of any subsidiary of the Company if such guarantee ranks pari passu with or junior in interest to the Securities (other than (a) dividends or distributions in Common Stock, (b) any declaration of a dividend in connection with the implementation of a Rights Plan, the issuance of any rights, of any Common Stock or any class or series of preferred stock of the Company or of any other property under any Rights Plan or the repurchase of any rights distributed pursuant to a Rights Plan, (c) payments under any Guarantee, and (d) purchases of Common Stock related to the issuance of Common Stock under any of the Company's benefit plans for its directors, officers or employees) if at such time (i) there shall have occurred any event of which the Company has actual knowledge that (A) with the giving of notice or the lapse of time or both, would constitute an Event of Default with respect to the Securities of such series and (B) in respect of which the Company shall not have taken reasonable steps to cure, (ii) if the Securities of such series are held by a Trust, the Company shall be in default with respect to its payment of any obligations under the Guarantee relating to the Preferred Securities issued by such Trust or (iii) the Company shall have given notice of its election to begin an Extension Period with respect to the Securities of such series as provided herein and shall not have rescinded such notice, or such Extension Period, or any extension thereof, shall be continuing. The Company also covenants with each Holder of Securities of a series issued to a Trust (i) to maintain directly or indirectly 100% ownership of the Common Securities of such Trust; provided, however, that any permitted successor of the Company hereunder may succeed to the Company's ownership of such Common Securities, (ii) not to voluntarily terminate, wind-up or liquidate such Trust, except (a) in connection with a distribution of the Securities of such series to the holders of Preferred Securities in liquidation of such Trust or (b) in connection with certain mergers, consolidations or amalgamations permitted by the related Trust Agreement and (iii) to use its reasonable efforts, consistent with the terms and provisions of such Trust Agreement, to cause such Trust to remain classified as a grantor trust and not an association taxable as a corporation for United States federal income tax purposes.
61 ARTICLE XI REDEMPTION OF SECURITIES SECTION 11.1. Applicability of This Article. Redemption of Securities of any series (whether by operation of a sinking fund or otherwise) as permitted or required by any form of Security issued pursuant to this Indenture shall be made in accordance with such form of Security and this Article; provided, however, that if any provision of any such form of Security shall conflict with any provision of this Article, the provision of such form of Security shall govern. Except as otherwise set forth in the form of Security for such series, each Security of such series shall be subject to partial redemption only in the amount of $25 or, in the case of the Securities of a series issued to a Trust, $25, or integral multiples thereof. SECTION 11.2. Election to Redeem; Notice to Trustee. The election of the Company to redeem any Securities shall be evidenced by or pursuant to a Board Resolution. In case of any redemption at the election of the Company of less than all of the Securities of any particular series and having the same terms, the Company shall, not less than 30 nor more than 60 days prior to the Redemption Date (unless a shorter notice shall be satisfactory to the Trustee), notify the Trustee of such date and of the principal amount of Securities of that series to be redeemed. In the case of any redemption of Securities prior to the expiration of any restriction on such redemption provided in the terms of such Securities, the Company shall furnish the Trustee with an Officers' Certificate and an Opinion of Counsel evidencing compliance with such restriction. SECTION 11.3. Selection of Securities to be Redeemed. If less than all the Securities of any series are to be redeemed (unless all the Securities of such series and of a specified tenor are to be redeemed or unless such redemption affects only a single Security), the particular Securities to be redeemed shall be selected not more than 60 days prior to the Redemption Date by the Trustee, from the Outstanding Securities of such series not previously called for redemption, by such method as the Trustee shall deem fair and appropriate and which may provide for the selection for redemption of a portion of the principal amount of any Security of such series, provided that the unredeemed portion of the principal amount of any Security shall be in an authorized denomination (which shall not be less than the minimum authorized denomination) for such Security. If less than all the Securities of such series and of a specified tenor are to be redeemed (unless such redemption affects only a single Security), the particular Securities to be redeemed shall be selected not more than 60 days prior to the Redemption Date by the Trustee, from the Outstanding Securities of such series and specified tenor not previously called for redemption in accordance with the preceding sentence. The Trustee shall promptly notify the Company in writing of the Securities selected for partial redemption and the principal amount thereof to be redeemed. For all purposes of this Indenture, unless the context otherwise requires, all provisions relating to the redemption of
62 Securities shall relate, in the case of any Security redeemed or to be redeemed only in part, to the portion of the principal amount of such Security which has been or is to be redeemed. If the Company shall so direct, Securities registered in the name of the Company, any Affiliate or any Subsidiary thereof shall not be included in the Securities selected for redemption. SECTION 11.4. Notice of Redemption. Notice of redemption shall be given by first-class mail, postage prepaid, mailed not later than the thirtieth day, and not earlier than the sixtieth day, prior to the Redemption Date, to each Holder of Securities to be redeemed, at the address of such Holder as it appears in the Securities Register. With respect to Securities of each series to be redeemed, each notice of redemption shall state: (a) the Redemption Date; (b) the Redemption Price; (c) if less than all Outstanding Securities of such particular series and having the same terms are to be redeemed, the identification (and, in the case of partial redemption, the respective principal amounts) of the particular Securities to be redeemed; (d) that on the Redemption Date, the Redemption Price will become due and payable upon each such Security or portion thereof, and that interest thereon, if any, shall cease to accrue on and after said date; (e) the place or places where such Securities are to be surrendered for payment of the Redemption Price; and (f) that the redemption is for a sinking fund, if such is the case. Notice of redemption of Securities to be redeemed at the election of the Company shall be given by the Company or, at the Company's request, by the Trustee in the name and at the expense of the Company and shall not be irrevocable. The notice if mailed in the manner herein provided shall be conclusively presumed to have been duly given, whether or not the Holder receives such notice. In any case, a failure to give such notice by mail or any defect in the notice to the Holder of any Security designated for redemption as a whole or in part shall not affect the validity of the proceedings for the redemption of any other Security.
63 SECTION 11.5. Deposit of Redemption Price. Prior to 10:00 a.m. New York City time on the Redemption Date specified in the notice of redemption given as provided in Section 11.4, the Company will deposit with the Trustee or with one or more Paying Agents (or if the Company is acting as its own Paying Agent, the Company will segregate and hold in trust as provided in Section 10.3) an amount of money sufficient to pay the Redemption Price of, and any accrued interest (including Additional Interest) on, all the Securities which are to be redeemed on that date. SECTION 11.6. Payment of Securities Called for Redemption. If any notice of redemption has been given as provided in Section 11.4, the Securities or portion of Securities with respect to which such notice has been given shall become due and payable on the date and at the place or places stated in such notice at the applicable Redemption Price. On presentation and surrender of such Securities at a Place of Payment in said notice specified, the said securities or the specified portions thereof shall be paid and redeemed by the Company at the applicable Redemption Price, together with accrued interest (including any Additional Interest) to the Redemption Date; provided, however, that, unless otherwise specified as contemplated by Section 3.1, installments of interest whose Stated Maturity is on or prior to the Redemption Date will be payable to the Holders of such Securities, or one or more Predecessor Securities, registered as such at the close of business on the relevant Record Dates according to their terms and the provisions of Section 3.7. Upon presentation of any Security redeemed in part only, the Company shall execute and the Trustee shall authenticate and deliver to the Holder thereof, at the expense of the Company, a new Security or Securities of the same series, of authorized denominations, in aggregate principal amount equal to the unredeemed portion of the Security so presented and having the same Original Issue Date, Stated Maturity and terms. If a Global Security is so surrendered, such new Security will also be a new Global Security. If any Security called for redemption shall not be so paid upon surrender thereof for redemption, the principal of and premium, if any, on such Security shall, until paid, bear interest from the Redemption Date at the rate prescribed therefor in the Security. SECTION 11.7. Right of Redemption of Securities Initially Issued to a Trust. In the case of the Securities of a series initially issued to a Trust, except as otherwise specified as contemplated by Section 3.1, the Company, at its option, may redeem such Securities (i) on or after the date five years after the Original Issue Date of such Securities, in whole at any time or in part from time to time, or (ii) upon the occurrence and during the continuation of a Tax Event, at any time within 90 days following the occurrence of such Tax Event in respect of such Trust, in whole (but not in part), in each case at a Redemption Price equal to 100% of the principal amount thereof. ARTICLE XII
64 SINKING FUNDS SECTION 12.1. Applicability of Article. The provisions of this Article shall be applicable to any sinking fund for the retirement of Securities of any series except as otherwise specified as contemplated by Section 3.1 for such Securities. The minimum amount of any sinking fund payment provided for by the terms of any Securities of any series is herein referred to as a "mandatory sinking fund payment", and any sinking fund payment in excess of such minimum amount which is permitted to be made by the terms of such Securities of any series is herein referred to as an "optional sinking fund payment". If provided for by the terms of any Securities of any series, the cash amount of any sinking fund payment may be subject to reduction as provided in Section 12.2. Each sinking fund payment shall be applied to the redemption of Securities of any series as provided for by the terms of such Securities. SECTION 12.2. Satisfaction of Sinking Fund Payments with Securities. In lieu of making all or any part of a mandatory sinking fund payment with respect to any Securities of a series in cash, the Company may at its option, at any time no more than 16 months and no less than 30 days prior to the date on which such sinking fund payment is due, deliver to the Trustee Securities of such series (together with the unmatured coupons, if any, appertaining thereto) theretofore purchased or otherwise acquired by the Company, except Securities of such series that have been redeemed through the application of mandatory or optional sinking fund payments pursuant to the terms of the Securities of such series, accompanied by a Company Order instructing the Trustee to credit such obligations and stating that the Securities of such series were originally issued by the Company by way of bona fide sale or other negotiation for value; provided that the Securities to be so credited have not been previously so credited. The Securities to be so credited shall be received and credited for such purpose by the Trustee at the redemption price for such Securities, as specified in the Securities so to be redeemed, for redemption through operation of the sinking fund and the amount of such sinking fund payment shall be reduced accordingly. SECTION 12.3. Redemption of Securities for Sinking Fund. Not less than 60 days prior to each sinking fund payment date for any series of Securities, the Company will deliver to the Trustee an Officers' Certificate specifying the amount of the next ensuing sinking fund payment for such Securities pursuant to the terms of such Securities, the portion thereof, if any, which is to be satisfied by payment of cash in the currency in which the Securities of such series are payable (except as provided pursuant to Section 3.1) and the portion thereof, if any, which is to be satisfied by delivering and crediting Securities pursuant to Section 12.2 and will also deliver to the Trustee any Securities to be so delivered. Such Officers' Certificate shall be irrevocable and upon its delivery the Company shall be obligated to make the cash payment or payments therein referred to, if any, on or before the succeeding sinking fund payment date. In the case of the failure of the Company to deliver such Officers' Certificate (or,
65 as required by this Indenture, the Securities and coupons, if any, specified in such Officers' Certificate), the sinking fund payment due on the succeeding sinking fund payment date for such series shall be paid entirely in cash and shall be sufficient to redeem the principal amount of the Securities of such series subject to a mandatory sinking fund payment without the right to deliver or credit securities as provided in Section 12.2 and without the right to make the optional sinking fund payment with respect to such series at such time. Any sinking fund payment or payments (mandatory or optional) made in cash plus any unused balance of any preceding sinking fund payments made with respect to the Securities of any particular series shall be applied by the Trustee (or by the Company if the Company is acting as its own Paying Agent) on the sinking fund payment date on which such payment is made (or, if such payment is made before a sinking fund payment date, on the sinking fund payment date immediately following the date of such payment) to the redemption of Securities of such series at the Redemption Price specified in such Securities with respect to the sinking fund. Any sinking fund moneys not so applied or allocated by the Trustee (or, if the Company is acting as its own Paying Agent, segregated and held in trust by the Company as provided in Section 10.3) for such series and together with such payment (or such amount so segregated) shall be applied in accordance with the provisions of this Section 12.3. Any and all sinking fund moneys with respect to the Securities of any particular series held by the Trustee (or if the Company is acting as its own Paying Agent, segregated and held in trust as provided in Section 10.3) on the last sinking fund payment date with respect to Securities of such series and not held for the payment or redemption of particular Securities of such series shall be applied by the Trustee (or by the Company if the Company is acting as its own Paying Agent), together with other moneys, if necessary, to be deposited (or segregated) sufficient for the purpose, to the payment of the principal of the Securities of such series at Maturity. The Trustee shall select the Securities to be redeemed upon such sinking fund payment date in the manner specified in Section 11.3 and cause notice of the redemption thereof to be given in the name of and at the expense of the Company in the manner provided in Section 11.4. Such notice having been duly given, the redemption of such Securities shall be made upon the terms and in the manner stated in Section 11.6. On or before each sinking fund payment date, the Company shall pay to the Trustee (or, if the Company is acting as its own Paying Agent, the Company shall segregate and hold in trust as provided in Section 10.3) in cash a sum in the currency in which Securities of such series are payable (except as provided pursuant to Section 3.1) equal to the principal and any interest accrued to the Redemption Date for Securities or portions thereof to be redeemed on such sinking fund payment date pursuant to this Section 12.3. Neither the Trustee nor the Company shall redeem any Securities of a series with sinking fund moneys or mail any notice of redemption of Securities of such series by operation of the sinking fund for such series during the continuance of a default in payment of interest, if any, on any Securities of such series or of any Event of Default (other than an Event of Default occurring as a consequence of this paragraph) with respect to the Securities of such series, except that if the notice of redemption shall have been provided in accordance with the provisions hereof, the Trustee (or the Company, if the Company is then acting as its own Paying Agent) shall redeem such Securities if cash sufficient for that purpose shall be deposited with the Trustee (or segregated by the Company) for that purpose in accordance with the terms of this Article XII. Except as aforesaid, any moneys in the sinking fund for such series at the time when any such
66 default or Event of Default shall occur and any moneys thereafter paid into such sinking fund shall, during the continuance of such default or Event of Default, be held as security for the payment of the Securities and coupons, if any, of such series; provided, however, that in case such default or Event of Default shall have been cured or waived herein, such moneys shall thereafter be applied on the next sinking fund payment date for the Securities of such series on which such moneys may be applied pursuant to the provisions of this Section 12.3. ARTICLE XIII SUBORDINATION OF SECURITIES SECTION 13.1. Securities Subordinate to Senior Debt. The Company covenants and agrees, and each Holder of a Security, by its acceptance thereof, likewise covenants and agrees, that, to the extent and in the manner hereinafter set forth in this Article, the payment of the principal of (and premium, if any) and interest (including any Additional Interest) on each and all of the Securities are hereby expressly made subordinate and subject in right of payment to the prior payment in full of all Senior Debt. SECTION 13.2. Payment Over of Proceeds Upon Dissolution, Etc. In case of the pendency of any receivership, insolvency, liquidation, bankruptcy, reorganization, arrangement, adjustment, composition or other judicial proceeding relative to the Company (each such event, if any, herein sometimes referred to as a "Proceeding"), then the holders of Senior Debt shall be entitled to receive payment in full of all Allocable Amounts of such Senior Debt, or provision shall be made for such payment in cash or cash equivalents or otherwise in a manner satisfactory to the holders of Senior Debt, before the Holders of the Securities are entitled to receive or retain any payment or distribution of any kind or character, whether in cash, property or securities (including any payment or distribution which may be payable or deliverable by reason of the payment of any other Debt of the Company (including any series of the Securities) subordinated to the payment of the Securities, such payment or distribution being hereinafter referred to as a "Junior Subordinated Payment"), on account of principal of (or premium, if any) or interest (including any Additional Interest) on the Securities or on account of the purchase or other acquisition of Securities by the Company or any Subsidiary and to that end the holders of Senior Debt shall be entitled to receive, for application to the payment thereof, any payment or distribution of any kind or character, whether in cash, property or securities, including any Junior Subordinated Payment, which may be payable or deliverable in respect of the Securities in any such Proceeding. In the event that, notwithstanding the foregoing provisions of this Section, the Trustee or the Holder of any Security shall have received any payment or distribution of assets of the Company of any kind or character, whether in cash, property or securities, including any Junior Subordinated Payment, before all Allocable Amounts of all Senior Debt are paid in full or payment thereof is provided for in cash or cash equivalents or otherwise in a manner satisfactory to the holders of Senior Debt, and if such fact shall, at or prior to the time of such payment or
67 distribution, have been made known to the Trustee or, as the case may be, such Holder, then and in such event such payment or distribution shall be paid over or delivered forthwith to the trustee in bankruptcy, receiver, liquidating trustee, custodian, assignee, agent or other Person making payment or distribution of assets of the Company for application to the payment of all Allocable Amounts of all Senior Debt remaining unpaid, to the extent necessary to pay all Allocable Amounts of all Senior Debt in full, after giving effect to any concurrent payment or distribution to or for the holders of Senior Debt. For purposes of this Article only, the words "any payment or distribution of any kind or character, whether in cash, property or securities" shall not be deemed to include shares of stock of the Company as reorganized or readjusted, or securities of the Company or any other corporation provided for by a plan of reorganization or readjustment which securities are subordinated in right of payment to all then outstanding Senior Debt to substantially the same extent as the Securities are so subordinated as provided in this Article. The consolidation of the Company with, or the merger of the Company into, another Person or the liquidation or dissolution of the Company following the sale of all or substantially all of its properties and assets as an entirety to another Person upon the terms and conditions set forth in Article VIII shall not be deemed a Proceeding for the purposes of this Section if the Person formed by such consolidation or into which the Company is merged or the Person which acquires by sale such properties and assets as an entirety, as the case may be, shall, as a part of such consolidation, merger, or sale comply with the conditions set forth in Article VIII. SECTION 13.3. Prior Payment to Senior Debt Upon Acceleration of Securities. In the event that any Securities are declared due and payable before their Stated Maturity, then and in such event the holders of the Senior Debt outstanding at the time such Securities so become due and payable shall be entitled to receive payment in full of all Allocable Amounts due on or in respect of such Senior Debt (including any amounts due upon acceleration), or provision shall be made for such payment in cash or cash equivalents or otherwise in a manner satisfactory to the holders of Senior Debt, before the Holders of the Securities are entitled to receive any payment or distribution of any kind or character, whether in cash, properties or securities (including any Junior Subordinated Payment) by the Company on account of the principal of (or premium, if any) or interest (including any Additional Interest) on the Securities or on account of the purchase or other acquisition of Securities by the Company or any Subsidiary; provided, however, that nothing in this Section shall prevent the satisfaction of any sinking fund payment in accordance with this Indenture or as otherwise specified as contemplated by Section 3.1 for the Securities of any series by delivering and crediting pursuant to Section 12.2 or as otherwise specified as contemplated by Section 3.1 for the Securities of any series Securities which have been acquired (upon redemption or otherwise) prior to such declaration of acceleration. In the event that, notwithstanding the foregoing, the Company shall make any payment to the Trustee or the Holder of any Security prohibited by the foregoing provisions of this Section, and if such fact shall, at or prior to the time of such payment, have been made known to the Trustee or, as the case may be, such Holder, then and in such event such payment shall be paid over and delivered forthwith to the Company.
68 The provisions of this Section shall not apply to any payment with respect to which Section 13.2 would be applicable. SECTION 13.4. No Payment When Senior Debt in Default. (a) In the event and during the continuation of any default in the payment of principal of (or premium, if any) or interest on any Senior Debt, or in the event that any event of default with respect to any Senior Debt shall have occurred and be continuing and shall have resulted in such Senior Debt becoming or being declared due and payable prior to the date on which it would otherwise have become due and payable, unless and until such event of default shall have been cured or waived or shall have ceased to exist and such acceleration shall have been rescinded or annulled, or (b) in the event any judicial proceeding shall be pending with respect to any such default in payment or such event or default, then no payment or distribution of any kind or character, whether in cash, properties or securities (including any Junior Subordinated Payment) shall be made by the Company on account of principal of (or premium, if any) or interest (including any Additional Interest), if any, on the Securities or on account of the purchase or other acquisition of Securities by the Company or any Subsidiary, in each case unless and until all Allocable Amounts of such Senior Debt are paid in full; provided, however, that nothing in this Section shall prevent the satisfaction of any sinking fund payment in accordance with this Indenture or as otherwise specified as contemplated by Section 3.1 for the Securities of any series by delivering and crediting pursuant to Section 12.2 or as otherwise specified as contemplated by Section 3.1 for the Securities of any series Securities which have been acquired (upon redemption or otherwise) prior to such default in payment or event of default. In the event that, notwithstanding the foregoing, the Company shall make any payment to the Trustee or the Holder of any Security prohibited by the foregoing provisions of this Section, and if such fact shall, at or prior to the time of such payment, have been made known to the Trustee or, as the case may be, such Holder, then and in such event such payment shall be paid over and delivered forthwith to the Company. The provisions of this Section shall not apply to any payment with respect to which Section 13.2 would be applicable. SECTION 13.5. Payment Permitted If No Default. Nothing contained in this Article or elsewhere in this Indenture or in any of the Securities shall prevent (a) the Company, at any time except during the pendency of any Proceeding referred to in Section 13.2 or under the conditions described in Sections 13.3 and 13.4, from making payments at any time of principal of (and premium, if any) or interest (including Additional Interest) on the Securities, or (b) the application by the Trustee of any money deposited with it hereunder to the payment of or on account of the principal of (and premium, if any) or interest (including any Additional Interest) on the Securities or the retention of such payment by the Holders, if, at the time of such application by the Trustee, it did not have knowledge that such payment would have been prohibited by the provisions of this Article.
69 SECTION 13.6. Subrogation to Rights of Holders of Senior Debt. Subject to the payment in full of all amounts due or to become due on all Senior Debt, or the provision for such payment in cash or cash equivalents or otherwise in a manner satisfactory to the holders of Senior Debt, the Holders of the Securities shall be subrogated to the extent of the payments or distributions made to the holders of such Senior Debt pursuant to the provisions of this Article (equally and ratably with the holders of all indebtedness of the Company which by its express terms is subordinated to Senior Debt of the Company to substantially the same extent as the Securities are subordinated to the Senior Debt and is entitled to like rights of subrogation by reason of any payments or distributions made to holders of such Senior Debt) to the rights of the holders of such Senior Debt to receive payments and distributions of cash, property and securities applicable to the Senior Debt until the principal of (and premium, if any) and interest on the Securities shall be paid in full. For purposes of such subrogation, no payments or distributions to the holders of the Senior Debt of any cash, property or securities to which the Holders of the Securities or the Trustee would be entitled except for the provisions of this Article, and no payments over pursuant to the provisions of this Article to the holders of Senior Debt by Holders of the Securities or the Trustee, shall, as among the Company, its creditors other than holders of Senior Debt, and the Holders of the Securities, be deemed to be a payment or distribution by the Company to or on account of the Senior Debt. SECTION 13.7. Provisions Solely to Define Relative Rights. The provisions of this Article are and are intended solely for the purpose of defining the relative rights of the Holders of the Securities on the one hand and the holders of Senior Debt on the other hand. Nothing contained in this Article or elsewhere in this Indenture or in the Securities is intended to or shall (a) impair, as between the Company and the Holders of the Securities, the obligations of the Company, which are absolute and unconditional, to pay to the Holders of the Securities the principal of (and premium, if any) and interest (including any Additional Interest) on the Securities as and when the same shall become due and payable in accordance with their terms; or (b) affect the relative rights against the Company of the Holders of the Securities and creditors of the Company other than their rights in relation to the holders of Senior Debt; or (c) prevent the Trustee or the Holder of any Security from exercising all remedies otherwise permitted by applicable law upon default under this Indenture including, without limitation, filing and voting claims in any Proceeding, subject to the rights, if any, under this Article of the holders of Senior Debt to receive cash, property and securities otherwise payable or deliverable to the Trustee or such Holder. SECTION 13.8. Trustee to Effectuate Subordination. Each Holder of a Security by his or her acceptance thereof authorizes and directs the Trustee on his or her behalf to take such action as may be necessary or appropriate to acknowledge or effectuate the subordination provided in this Article and appoints the Trustee his or her attorney-in-fact for any and all such purposes.
70 SECTION 13.9. No Waiver of Subordination Provisions. No right of any present or future holder of any Senior Debt to enforce subordination as herein provided shall at any time in any way be prejudiced or impaired by any act or failure to act on the part of the Company or by any act or failure to act, in good faith, by any such holder, or by any noncompliance by the Company with the terms, provisions and covenants of this Indenture, regardless of any knowledge thereof that any such holder may have or be otherwise charged with. Without in any way limiting the generality of the immediately preceding paragraph, the holders of Senior Debt may, at any time and from to time, without the consent of or notice to the Trustee or the Holders of the Securities, without incurring responsibility to the Holders of the Securities and without impairing or releasing the subordination provided in this Article or the obligations hereunder of the Holders of the Securities to the holders of Senior Debt, do any one or more of the following: (i) change the manner, place or terms of payment or extend the time of payment of, or renew or alter, Senior Debt, or otherwise amend or supplement in any manner Senior Debt or any instrument evidencing the same or any agreement under which Senior Debt is outstanding; (ii) sell, exchange, release or otherwise deal with any property pledged, mortgaged or otherwise securing Senior Debt; (iii) release any Person liable in any manner for the collection of Senior Debt; and (iv) exercise or refrain from exercising any rights against the Company and any other Person. SECTION 13.10. Notice to Trustee. The Company shall give prompt written notice to the Trustee of any fact known to the Company which would prohibit the making of any payment to or by the Trustee in respect of the Securities. Notwithstanding the provisions of this Article or any other provision of this Indenture, the Trustee shall not be charged with knowledge of the existence of any facts which would prohibit the making of any payment to or by the Trustee in respect of the Securities, unless and until the Trustee shall have received written notice thereof from the Company or a holder of Senior Debt or from any trustee, agent or representative therefor; provided, however, that if the Trustee shall not have received the notice provided for in this Section at least two Business Days prior to the date upon which by the terms hereof any monies may become payable for any purpose (including, without limitation, the payment of the principal of (and premium, if any) or interest (including any Additional Interest) on any Security), then, anything herein contained to the contrary notwithstanding, the Trustee shall have full power and authority to receive such monies and to apply the same to the purpose for which they were received and shall not be affected by any notice to the contrary which may be received by it within two Business Days prior to such date. Subject to the provisions of Section 6.1, the Trustee shall be entitled to rely on the delivery to it of a written notice by a Person representing himself to be a holder of Senior Debt (or a trustee therefor) to establish that such notice has been given by a holder of Senior Debt (or a trustee therefor). In the event that the Trustee determines in good faith that further evidence is required with respect to the right of any Person as a holder of Senior Debt to participate in any payment or distribution pursuant to this Article, the Trustee may request such Person to furnish
71 evidence to the reasonable satisfaction of the Trustee as to the amount of Senior Debt held by such Person, the extent to which such Person is entitled to participate in such payment or distribution and any other facts pertinent to the rights of such Person under this Article, and if such evidence is not furnished, the Trustee may defer any payment to such Person pending judicial determination as to the right of such Person to receive such payment. SECTION 13.11. Reliance on Judicial Order or Certificate of Liquidating Agent. Upon any payment or distribution of assets of the Company referred to in this Article, the Trustee, subject to the provisions of Section 6.1, and the Holders of the Securities shall be entitled to rely upon any order or decree entered by any court of competent jurisdiction in which such Proceeding is pending, or a certificate of the trustee in bankruptcy, receiver, liquidating trustee, custodian, assignee for the benefit of creditors, agent or other Person making such payment or distribution, delivered to the Trustee or to the Holders of Securities, for the purpose of ascertaining the Persons entitled to participate in such payment or distribution, the holders of the Senior Debt and other indebtedness of the Company, the amount thereof or payable thereon, the amount or amounts paid or distributed thereon and all other facts pertinent thereto or to this Article. SECTION 13.12. Trustee Not Fiduciary for Holders of Senior Debt. The Trustee, in its capacity as trustee under this Indenture, shall not be deemed to owe any fiduciary duty to the holders of Senior Debt and shall not be liable to any such holders if it shall in good faith mistakenly pay over or distribute to Holders of Securities or to the Company or to any other Person cash, property or securities to which any holders of Senior Debt shall be entitled by virtue of this Article or otherwise. SECTION 13.13. Rights of Trustee as Holder of Senior Debt; Preservation of Trustee's Rights. The Trustee in its individual capacity shall be entitled to all the rights set forth in this Article with respect to any Senior Debt which may at any time be held by it, to the same extent as any other holder of Senior Debt, and nothing in this Indenture shall deprive the Trustee of any of its rights as such holder. SECTION 13.14. Article Applicable to Paying Agents. In case at any time any Paying Agent other than the Trustee shall have been appointed by the Company and be then acting hereunder, the term "Trustee" as used in this Article shall in such case (unless the context otherwise requires) be construed as extending to and including such Paying Agent within its meaning as fully for all intents and purposes as if such Paying Agent were named in this Article in addition to or in place of the Trustee.
72 SECTION 13.15. Certain Conversions or Exchanges Deemed Payment. For the purposes of this Article only, (a) the issuance and delivery of junior securities upon conversion or exchange of Securities shall not be deemed to constitute a payment or distribution on account of the principal of (or premium, if any) or interest (including any Additional Interest) on Securities or on account of the purchase or other acquisition of Securities, and (b) the payment, issuance or delivery of cash, property or securities (other than junior securities) upon conversion or exchange of a Security shall be deemed to constitute payment on account of the principal of such security. For the purposes of this Section, the term "junior securities" means (i) shares of any stock of any class of the Company and (ii) securities of the Company which are subordinated in right of payment to all Senior Debt which may be outstanding at the time of issuance or delivery of such securities to substantially the same extent as, or to a greater extent than, the Securities are so subordinated as provided in this Article. * * * * This instrument may be executed in any number of counterparts, each of which so executed shall be deemed to be an original, but all such counterparts shall together constitute but one and the same instrument. IN WITNESS WHEREOF, the parties hereto have caused this Indenture to be duly executed, and their respective corporate seals to be hereunto affixed and attested, all as of the day and year first above written. THE CHASE MANHATTAN CORPORATION By:----------------------------- Attest: THE BANK OF NEW YORK as Trustee By:-----------------------------
Exhibit 4.8(b) GUARANTEE AGREEMENT BETWEEN THE CHASE MANHATTAN CORPORATION (AS GUARANTOR) AND THE BANK OF NEW YORK (AS TRUSTEE) DATED AS OF JANUARY 24, 1997
CROSS-REFERENCE TABLE* Section of Trust Indenture Act Section of of 1939, as amended Guarantee Agreement - ------------------- ------------------- 310(a).................................................................4.1(a) 310(b).................................................................4.1(c), 2.8 310(c).................................................................Inapplicable 311(a).................................................................2.2(b) 311(b).................................................................2.2(b) 311(c).................................................................Inapplicable 312(a).................................................................2.2(a) 312(b).................................................................2.2(b) 313....................................................................2.3 314(a).................................................................2.4 314(b).................................................................Inapplicable 314(c).................................................................2.5 314(d).................................................................Inapplicable 314(e).................................................................1.1, 2.5, 3.2 314(f).................................................................2.1, 3.2 315(a).................................................................3.1(d) 315(b).................................................................2.7 315(c).................................................................3.1 315(d).................................................................3.1(d) 316(a).................................................................1.1, 2.6, 5.4 316(b).................................................................5.3 316(c).................................................................8.2 317(a).................................................................Inapplicable 317(b).................................................................Inapplicable 318(a).................................................................2.1(b) 318(b).................................................................2.1 318(c).................................................................2.1(a) - ---------- * This Cross-Reference Table does not constitute part of the Guarantee Agreement and shall not affect the interpretation of any of its terms or provisions.
TABLE OF CONTENTS Page ARTICLE I. DEFINITIONS .......................................................................... 1 Section 1.1. Definitions.................................................................. 1 ARTICLE II. TRUST INDENTURE ACT .................................................................. 3 Section 2.1. Trust Indenture Act; Application............................................. 3 Section 2.2. List of Holders.............................................................. 4 Section 2.3. Reports by the Guarantee Trustee............................................. 4 Section 2.4. Periodic Reports to the Guarantee Trustee.................................... 4 Section 2.5. Evidence of Compliance with Conditions Precedent............................. 4 Section 2.6. Events of Default; Waiver.................................................... 4 Section 2.7. Event of Default; Notice..................................................... 5 Section 2.8. Conflicting Interests........................................................ 5 ARTICLE III. POWERS, DUTIES AND RIGHTS OF THE GUARANTEE TRUSTEE........................... 5 Section 3.1. Powers and Duties of the Guarantee Trustee................................... 5 Section 3.2. Certain Rights of Guarantee Trustee.......................................... 6 Section 3.3. Indemnity.................................................................... 8 ARTICLE IV. GUARANTEE TRUSTEE............................................................ 8 Section 4.1. Guarantee Trustee: Eligibility............................................... 8 Section 4.2. Appointment, Removal and Resignation of the Guarantee Trustee................ 9 ARTICLE V. GUARANTEE............................................................................. 9 Section 5.1. Guarantee.................................................................... 9 Section 5.2. Waiver of Notice and Demand.................................................. 9 Section 5.3. Obligations Not Affected..................................................... 10 Section 5.4. Rights of Holders............................................................ 10 Section 5.5. Guarantee of Payment......................................................... 11 Section 5.6. Subrogation.................................................................. 11 Section 5.7. Independent Obligations...................................................... 11 ARTICLE VI. COVENANTS AND SUBORDINATION.................................................. 11 Section 6.1. Subordination................................................................ 11 Section 6.2. Pari Passu Guarantees........................................................ 11
Page ARTICLE VII. TERMINATION.................................................................. 12 Section 7.1. Termination.................................................................. 12 ARTICLE VIII. MISCELLANEOUS................................................................ 12 Section 8.1. Successors and Assigns....................................................... 12 Section 8.2. Amendments................................................................... 12 Section 8.3. Notices...................................................................... 12 Section 8.4. Benefit...................................................................... 13 Section 8.5. Interpretation............................................................... 13 Section 8.6. Governing Law................................................................ 14
GUARANTEE AGREEMENT This GUARANTEE AGREEMENT, dated as of January 24, 1997, is executed and delivered by THE CHASE MANHATTAN CORPORATION, a Delaware corporation (the "Guarantor") having its principal office at 270 Park Avenue, New York, New York 10017, and THE BANK OF NEW YORK, a New York banking corporation, as trustee (the "Guarantee Trustee"), for the benefit of the Holders (as defined herein) from time to time of the Capital Securities and Common Securities (each as defined herein and together, the "Securities") of Chase Capital II, a Delaware statutory business trust (the "Issuer"). WHEREAS, pursuant to an Amended and Restated Trust Agreement, dated as of January 24, 1997 (the "Trust Agreement"), among the Guarantor, as Depositor, the Property Trustee and the Delaware Trustee named therein, the Administrative Trustees named therein and the Holders from time to time of undivided beneficial interests in the assets of the Issuer, the Issuer is issuing $500,000,000 aggregate Liquidation Amount (as defined in the Trust Agreement) of its Global Floating Rate Capital Securities, Series B, Liquidation Amount $1,000 per preferred security) (the "Capital Securities") representing preferred undivided beneficial interests in the assets of the Issuer and having the terms set forth in the Trust Agreement; WHEREAS, the Capital Securities will be issued by the Issuer and the proceeds thereof, together with the proceeds from the issuance of the Issuer's Common Securities (as defined herein), will be used to purchase the Debentures (as defined in the Trust Agreement) of the Guarantor which will be deposited with The Bank of New York, as Property Trustee under the Trust Agreement, as trust assets; and WHEREAS, as incentive for the Holders to purchase Securities the Guarantor desires irrevocably and unconditionally to agree, to the extent set forth herein, to pay to the Holders of the Securities the Guarantee Payments (as defined herein) and to make certain other payments on the terms and conditions set forth herein. NOW, THEREFORE, in consideration of the purchase by each Holder of Securities, which purchase the Guarantor hereby agrees shall benefit the Guarantor, the Guarantor executes and delivers this Guarantee Agreement for the benefit of the Holders from time to time of the Securities. ARTICLE I. DEFINITIONS SECTION 1.1. Definitions. As used in this Guarantee Agreement, the terms set forth below shall, unless the context otherwise requires, have the following meanings. Capitalized or otherwise defined terms used but not otherwise defined herein shall have the meanings assigned to such terms in the Trust Agreement as in effect on the date hereof.
2 "Affiliate" of any specified Person means any other Person directly or indirectly controlling or controlled by or under direct or indirect common control with such specified Person; provided, however, that an Affiliate of the Guarantor shall not be deemed to be an Affiliate of the Issuer. For the purposes of this definition, "control" when used with respect to any specified Person means the power to direct the management and policies of such Person, directly or indirectly, whether through the ownership of voting securities, by contract or otherwise; and the terms "controlling" and "controlled" have meanings correlative to the foregoing. "Board of Directors" means either the board of directors of the Guarantor or any committee of that board duly authorized to act hereunder or any directors or officers of the Guarantor to whom such board of directors or such committee shall have duly delegated its authority. "Common Securities" means the securities representing common undivided beneficial interests in the assets of the Issuer. "Event of Default" means a default by the Guarantor on any of its payment or other obligations under this Guarantee Agreement; provided, however, that, except with respect to a default in payment of any Guarantee Payments, the Guarantor shall have received notice of default and shall not have cured such default within 90 days after receipt of such notice. "Guarantee Payments" means the following payments or distributions, without duplication, with respect to the Securities, to the extent not paid or made by or on behalf of the Issuer: (i) any accumulated and unpaid Distributions (as defined in the Trust Agreement) required to be paid on the Securities, to the extent the Issuer shall have funds on hand available therefor at such time, (ii) the redemption price, including all accrued and unpaid Distributions to the date of redemption (the"Redemption Price"), with respect to any Securities called for redemption by the Issuer, to the extent the Issuer shall have funds on hand available therefor at such time, and (iii) upon a voluntary or involuntary termination, winding up or liquidation of the Issuer, unless Debentures are distributed to the Holders, the lesser of (a) the aggregate of the Liquidation Amount plus accrued and unpaid Distributions to the date of payment and (b) the amount of assets of the Issuer remaining available for distribution to Holders in liquidation of the Issuer after satisfaction of liabilities to creditors of the Issuer as required by applicable law (in either case, the "Liquidation Distribution"). "Guarantee Trustee" means The Bank of New York, until a Successor Guarantee Trustee has been appointed and has accepted such appointment pursuant to the terms of this Guarantee Agreement, and thereafter means each such Successor Guarantee Trustee. "Holder" means any holder, as registered on the books and records of the Issuer, of any Securities; provided, however, that in determining whether the holders of the requisite percentage of Securities have given any request, notice, consent or waiver hereunder, "Holder" shall not include the Guarantor, the Guarantee Trustee, or any Affiliate of the Guarantor or the Guarantee Trustee. "Indenture" means the Junior Subordinated Indenture dated as of December 1, 1996, as supplemented and amended between the Guarantor and The Bank of New York, as trustee. "List of Holders" has the meaning specified in Section 2.2(a).
3 "Majority in aggregate Liquidation Amount of the Securities" means, except as provided by the Trust Indenture Act, a vote by the Holder(s), voting separately as a class, of more than 50% of the aggregate Liquidation Amount of all then outstanding Securities issued by the Issuer. "Officers' Certificate" means, with respect to any Person, a certificate signed by the Chairman or a Vice Chairman of the Board of Directors of such Person or the President or a Vice President of such Person, and by the Treasurer, an Assistant Treasurer, the Secretary or an Assistant Secretary of such Person, and delivered to the Guarantee Trustee. Any Officers' Certificate delivered with respect to compliance with a condition or covenant provided for in this Guarantee Agreement shall include: (a) a statement that each officer signing the Officers' Certificate has read the covenant or condition and the definitions relating thereto; (b) a brief statement of the nature and scope of the examination or investigation undertaken by each officer in rendering the Officers' Certificate; (c) a statement that each officer has made such examination or investigation as, in such officer's opinion, is necessary to enable such officer to express an informed opinion as to whether or not such covenant or condition has been complied with; and (d) a statement as to whether, in the opinion of each officer, such condition or covenant has been complied with. "Person" means a legal person, including any individual, corporation, estate, partnership, joint venture, association, joint stock company, limited liability company, trust, unincorporated association, or government or any agency or political subdivision thereof, or any other entity of whatever nature. "Responsible Officer" when used with respect to the Guarantee Trustee means any officer of the Guarantee Trustee assigned by the Guarantee Trustee from time to time to administer its corporate trust matters. "Successor Guarantee Trustee" means a successor Guarantee Trustee possessing the qualifications to act as Guarantee Trustee under Section 4.1. "Trust Indenture Act" means the Trust Indenture Act of 1939, as amended. ARTICLE II. TRUST INDENTURE ACT SECTION 2.1. Trust Indenture Act; Application. (a) This Guarantee Agreement is subject to the provisions of the Trust Indenture Act that are required to be part of this Guarantee Agreement and shall, to the extent applicable, be governed by such provisions. (b) If and to the extent that any provision of this Guarantee Agreement limits, qualifies or conflicts with the duties imposed by Sections 310 to 317, inclusive, of the Trust Indenture Act, such imposed duties shall control.
4 SECTION 2.2. List of Holders. (a) The Guarantor will furnish or cause to be furnished to the Guarantee Trustee: (i) semi-annually, not more than 15 days after January 15 and July 15 in each year, a list, in such form as the Guarantee Trustee may reasonably require, of the names and addresses of the Holders as of such January 1 and July 1, and (ii) at such other times as the Guarantee Trustee may request in writing, within 30 days after the receipt by the Guarantor of any such request, a list of similar form and content as of a date not more than 15 days prior to the time such list is furnished, excluding from any such list names and addresses received by the Guarantee Trustee in its capacity as Securities Registrar. (b) The Guarantee Trustee shall comply with its obligations under Section 311(a), Section 311(b) and Section 312(b) of the Trust Indenture Act. SECTION 2.3. Reports by the Guarantee Trustee. The Guarantee Trustee shall transmit to Holders such reports concerning the Guarantee Trustee and its actions under this Guarantee Agreement as may be required pursuant to the Trust Indenture Act at the times and in the manner provided pursuant thereto. If required by Section 313(a) of the Trust Indenture Act, the Guarantee Trustee shall, within sixty days after each May 15 following the date of this Guarantee Agreement deliver to Holders a brief report, dated as of such May 15, which complies with the provisions of such Section 313(a). SECTION 2.4. Periodic Reports to the Guarantee Trustee. The Guarantor shall provide to the Guarantee Trustee, the Securities and Exchange Commission and the Holders such documents, reports and information, if any, as required by Section 314 of the Trust Indenture Act and the compliance certificate required by Section 314 of the Trust Indenture Act, in the form, in the manner and at the times required by Section 314 of the Trust Indenture Act. Delivery of such reports, information and documents to the Guarantee Trustee is for informational purposes only and the Guarantee Trustee's receipt of such shall not constitute constructive notice of any information contained therein, including the Guarantor's compliance with any of its covenants hereunder (as to which the Guarantee Trustee is entitled to rely exclusively on Officers' Certificates). SECTION 2.5. Evidence of Compliance with Conditions Precedent. The Guarantor shall provide to the Guarantee Trustee such evidence of compliance with such conditions precedent, if any, provided for in this Guarantee Agreement that relate to any of the matters set forth in Section 314(c) of the Trust Indenture Act. Any certificate or opinion required to be given by an officer pursuant to Section 314(c)(1) may be given in the form of an Officers' Certificate. SECTION 2.6. Events of Default; Waiver.
5 The Holders of a Majority in aggregate Liquidation Amount of the Securities may, by vote, on behalf of the Holders, waive any past Event of Default and its consequences. Upon such waiver, any such Event of Default shall cease to exist, and any Event of Default arising therefrom shall be deemed to have been cured, for every purpose of this Guarantee Agreement, but no such waiver shall extend to any subsequent or other default or Event of Default or impair any right consequent therefrom. SECTION 2.7. Event of Default; Notice. (a) The Guarantee Trustee shall, within 90 days after the occurrence of an Event of Default, transmit by mail, first class postage prepaid, to the Holders, notices of all Events of Default actually known to the Guarantee Trustee, unless such defaults have been cured before the giving of such notice, provided, that, except in the case of a default in the payment of a Guarantee Payment, the Guarantee Trustee shall be protected in withholding such notice if and so long as the Board of Directors, the executive committee or a trust committee of directors and/or Responsible Officers of the Guarantee Trustee in good faith determines that the withholding of such notice is in the interests of the Holders. (b) The Guarantee Trustee shall not be deemed to have knowledge of any Event of Default unless the Guarantee Trustee shall have received written notice, or a Responsible Officer charged with the administration of this Guarantee Agreement shall have obtained written notice, of such Event of Default. SECTION 2.8. Conflicting Interests. The Trust Agreement shall be deemed to be specifically described in this Guarantee Agreement for the purposes of clause (i) of the first proviso contained in Section 310(b) of the Trust Indenture Act. ARTICLE III. POWERS, DUTIES AND RIGHTS OF THE GUARANTEE TRUSTEE SECTION 3.1. Powers and Duties of the Guarantee Trustee. (a) This Guarantee Agreement shall be held by the Guarantee Trustee for the benefit of the Holders, and the Guarantee Trustee shall not transfer this Guarantee Agreement to any Person except a Holder exercising his or her rights pursuant to Section 5.4(iv) or to a Successor Guarantee Trustee on acceptance by such Successor Guarantee Trustee of its appointment to act as Successor Guarantee Trustee. The right, title and interest of the Guarantee Trustee shall automatically vest in any Successor Guarantee Trustee, upon acceptance by such Successor Guarantee Trustee of its appointment hereunder, and such vesting and cessation of title shall be effective whether or not conveyancing documents have been executed and delivered pursuant to the appointment of such Successor Guarantee Trustee. (b) If an Event of Default has occurred and is continuing, the Guarantee Trustee shall enforce this Guarantee Agreement for the benefit of the Holders. (c) The Guarantee Trustee, before the occurrence of any Event of Default and after the curing of all Events of Default that may have occurred, shall undertake to perform only such duties as are
6 specifically set forth in this Guarantee Agreement, and no implied covenants shall be read into this Guarantee Agreement against the Guarantee Trustee. In case an Event of Default has occurred (that has not been cured or waived pursuant to Section 2.6), the Guarantee Trustee shall exercise such of the rights and powers vested in it by this Guarantee Agreement, and use the same degree of care and skill in its exercise thereof, as a prudent person would exercise or use under the circumstances in the conduct of his or her own affairs. (d) No provision of this Guarantee Agreement shall be construed to relieve the Guarantee Trustee from liability for its own negligent action, its own negligent failure to act or its own willful misconduct, except that: (i) prior to the occurrence of any Event of Default and after the curing or waiving of all such Events of Default that may have occurred: (A) the duties and obligations of the Guarantee Trustee shall be determined solely by the express provisions of this Guarantee Agreement, and the Guarantee Trustee shall not be liable except for the performance of such duties and obligations as are specifically set forth in this Guarantee Agreement; and (B) in the absence of bad faith on the part of the Guarantee Trustee, the Guarantee Trustee may conclusively rely, as to the truth of the statements and the correctness of the opinions expressed therein, upon any certificates or opinions furnished to the Guarantee Trustee and conforming to the requirements of this Guarantee Agreement; but in the case of any such certificates or opinions that by any provision hereof or of the Trust Indenture Act are specifically required to be furnished to the Guarantee Trustee, the Guarantee Trustee shall be under a duty to examine the same to determine whether or not they conform to the requirements of this Guarantee Agreement; (ii) the Guarantee Trustee shall not be liable for any error of judgment made in good faith by a Responsible Officer of the Guarantee Trustee, unless it shall be proved that the Guarantee Trustee was negligent in ascertaining the pertinent facts upon which such judgment was made; (iii) the Guarantee Trustee shall not be liable with respect to any action taken or omitted to be taken by it in good faith in accordance with the direction of the Holders of not less than a Majority in aggregate Liquidation Amount of the Securities relating to the time, method and place of conducting any proceeding for any remedy available to the Guarantee Trustee, or exercising any trust or power conferred upon the Guarantee Trustee under this Guarantee Agreement; and (iv) no provision of this Guarantee Agreement shall require the Guarantee Trustee to expend or risk its own funds or otherwise incur personal financial liability in the performance of any of its duties or in the exercise of any of its rights or powers, if the Guarantee Trustee shall have reasonable grounds for believing that the repayment of such funds or liability is not reasonably assured to it under the terms of this Guarantee Agreement or adequate indemnity against such risk or liability is not reasonably assured to it. SECTION 3.2. Certain Rights of Guarantee Trustee.
7 (a) Subject to the provisions of Section 3.1: (i) The Guarantee Trustee may rely and shall be fully protected in acting or refraining from acting upon any resolution, certificate, statement, instrument, opinion, report, notice, request, direction, consent, order, bond, debenture, note, other evidence of indebtedness or other paper or document reasonably believed by it to be genuine and to have been signed, sent or presented by the proper party or parties. (ii) Any direction or act of the Guarantor contemplated by this Guarantee Agreement shall be sufficiently evidenced by an Officers' Certificate unless otherwise prescribed herein. (iii) Whenever, in the administration of this Guarantee Agreement, the Guarantee Trustee shall deem it desirable that a matter be proved or established before taking, suffering or omitting to take any action hereunder, the Guarantee Trustee (unless other evidence is herein specifically prescribed) may, in the absence of bad faith on its part, request and rely upon an Officers' Certificate which, upon receipt of such request from the Guarantee Trustee, shall be promptly delivered by the Guarantor. (iv) The Guarantee Trustee may consult with legal counsel of its selection, and the advice or opinion of such legal counsel with respect to legal matters shall be full and complete authorization and protection in respect of any action taken, suffered or omitted to be taken by it hereunder in good faith and in accordance with such advice or opinion. Such legal counsel may be legal counsel to the Guarantor or any of its Affiliates and may be one of its employees. The Guarantee Trustee shall have the right at any time to seek instructions concerning the administration of this Guarantee Agreement from any court of competent jurisdiction. (v) The Guarantee Trustee shall be under no obligation to exercise any of the rights or powers vested in it by this Guarantee Agreement at the request or direction of any Holder, unless such Holder shall have provided to the Guarantee Trustee such adequate security and indemnity as would satisfy a reasonable person in the position of the Guarantee Trustee, against the costs, expenses (including attorneys' fees and expenses) and liabilities that might be incurred by it in complying with such request or direction, including such reasonable advances as may be requested by the Guarantee Trustee; provided that, nothing contained in this Section 3.2(a)(v) shall be taken to relieve the Guarantee Trustee, upon the occurrence of an Event of Default, of its obligation to exercise the rights and powers vested in it by this Guarantee Agreement. (vi) The Guarantee Trustee shall not be bound to make any investigation into the facts or matters stated in any resolution, certificate, statement, instrument, opinion, report, notice, request, direction, consent, order, bond, debenture, note, other evidence of indebtedness or other paper or document, but the Guarantee Trustee, in its discretion, may make such further inquiry or investigation into such facts or matters as it may see fit. (vii) The Guarantee Trustee may execute any of the trusts or powers hereunder or perform any duties hereunder either directly or by or through its agents or attorneys, and the Guarantee Trustee shall not be responsible for any misconduct or negligence on the part of any such agent or attorney appointed with due care by it hereunder.
8 (viii) Whenever in the administration of this Guarantee Agreement the Guarantee Trustee shall deem it desirable to receive written instructions with respect to enforcing any remedy or right or taking any other action hereunder, the Guarantee Trustee (A) may request instructions from the Holders, (B) may refrain from enforcing such remedy or right or taking such other action until such written instructions are received, and (C) shall be protected in acting in accordance with such written instructions. (ix) The Guarantee Trustee shall not be liable for any action taken, suffered, or omitted to be taken by it in good faith and reasonably believed by it to be authorized or within the discretion or rights or powers conferred upon it by this Guarantee Agreement. (b) No provision of this Guarantee Agreement shall be deemed to impose any duty or obligation on the Guarantee Trustee to perform any act or acts or exercise any right, power, duty or obligation conferred or imposed on it in any jurisdiction in which it shall be illegal, or in which the Guarantee Trustee shall be unqualified or incompetent in accordance with applicable law, to perform any such act or acts or to exercise any such right, power, duty or obligation. No permissive power or authority available to the Guarantee Trustee shall be construed to be a duty to act in accordance with such power and authority. SECTION 3.3. Indemnity. The Guarantor agrees to indemnify the Guarantee Trustee for, and to hold it harmless against, any loss, liability or expense incurred without negligence or bad faith on the part of the Guarantee Trustee, arising out of or in connection with the acceptance or administration of this Guarantee Agreement, including the costs and expenses of defending itself against any claim or liability in connection with the exercise or performance of any of its powers or duties hereunder. ARTICLE IV. GUARANTEE TRUSTEE SECTION 4.1. Guarantee Trustee: Eligibility. (a) There shall at all times be a Guarantee Trustee which shall: (i) not be an Affiliate of the Guarantor; and (ii) be a Person that is eligible pursuant to the Trust Indenture Act to act as such and has a combined capital and surplus of at least $50,000,000, and shall be a corporation meeting the requirements of Section 310(a) of the Trust Indenture Act. If such corporation publishes reports of condition at least annually, pursuant to law or to the requirements of the supervising or examining authority, then, for the purposes of this Section and to the extent permitted by the Trust Indenture Act, the combined capital and surplus of such corporation shall be deemed to be its combined capital and surplus as set forth in its most recent report of condition so published. (b) If at any time the Guarantee Trustee shall cease to be eligible to so act under Section 4.1(a), the Guarantee Trustee shall immediately resign in the manner and with the effect set out in Section 4.2(c).
9 (c) If the Guarantee Trustee has or shall acquire any "conflicting interest" within the meaning of Section 310(b) of the Trust Indenture Act, the Guarantee Trustee and Guarantor shall in all respects comply with the provisions of Section 310(b) of the Trust Indenture Act. SECTION 4.2. Appointment, Removal and Resignation of the Guarantee Trustee. (a) Subject to Section 4.2(b), the Guarantee Trustee may be appointed or removed without cause at any time by the Guarantor. (b) The Guarantee Trustee shall not be removed until a Successor Guarantee Trustee has been appointed and has accepted such appointment by written instrument executed by such Successor Guarantee Trustee and delivered to the Guarantor. If an instrument of acceptance by a Successor Guarantee Trustee shall not have been delivered to the Guarantee Trustee within 30 days after such removal, the Guarantee Trustee being removed may petition any court of competent jurisdiction for the appointment of a Successor Guarantee Trustee. (c) The Guarantee Trustee appointed hereunder shall hold office until a Successor Guarantee Trustee shall have been appointed or until its removal or resignation. The Guarantee Trustee may resign from office (without need for prior or subsequent accounting) by an instrument in writing executed by the Guarantee Trustee and delivered to the Guarantor, which resignation shall not take effect until a Successor Guarantee Trustee has been appointed and has accepted such appointment by instrument in writing executed by such Successor Guarantee Trustee and delivered to the Guarantor and the resigning Guarantee Trustee. (d) If no Successor Guarantee Trustee shall have been appointed and accepted appointment as provided in this Section 4.2 within 60 days after delivery to the Guarantor of an instrument of resignation, the resigning Guarantee Trustee may petition, at the expense of the Guarantor, any court of competent jurisdiction for appointment of a Successor Guarantee Trustee. Such court may thereupon, after prescribing such notice, if any, as it may deem proper, appoint a Successor Guarantee Trustee. ARTICLE V. GUARANTEE SECTION 5.1. Guarantee. The Guarantor irrevocably and unconditionally agrees to pay in full to the Holders the Guarantee Payments (without duplication of amounts theretofore paid by or on behalf of the Issuer), as and when due, regardless of any defense, right of set-off or counterclaim which the Issuer may have or assert. The Guarantor's obligation to make a Guarantee Payment may be satisfied by direct payment of the required amounts by the Guarantor to the Holders or by causing the Issuer to pay such amounts to the Holders. SECTION 5.2. Waiver of Notice and Demand. The Guarantor hereby waives notice of acceptance of the Guarantee Agreement and of any liability to which it applies or may apply, presentment, demand for payment, any right to require a
10 proceeding first against the Guarantee Trustee, Issuer or any other Person before proceeding against the Guarantor, protest, notice of nonpayment, notice of dishonor, notice of redemption and all other notices and demands. SECTION 5.3. Obligations Not Affected. The obligations, covenants, agreements and duties of the Guarantor under this Guarantee Agreement shall in no way be affected or impaired by reason of the happening from time to time of any of the following: (a) the release or waiver, by operation of law or otherwise, of the performance or observance by the Issuer of any express or implied agreement, covenant, term or condition relating to the Securities to be performed or observed by the Issuer; (b) the extension of time for the payment by the Issuer of all or any portion of the Distributions (other than an extension of time for payment of Distributions that results from the extension of any interest payment period on the Debentures as provided in the Indenture), Redemption Price, Liquidation Distribution or any other sums payable under the terms of the Securities or the extension of time for the performance of any other obligation under, arising out of, or in connection with, the Securities; (c) any failure, omission, delay or lack of diligence on the part of the Holders to enforce, assert or exercise any right, privilege, power or remedy conferred on the Holders pursuant to the terms of the Securities, or any action on the part of the Issuer granting indulgence or extension of any kind; (d) the voluntary or involuntary liquidation, dissolution, sale of any collateral, receivership, insolvency, bankruptcy, assignment for the benefit of creditors, reorganization, arrangement, composition or readjustment of debt of, or other similar proceedings affecting, the Issuer or any of the assets of the Issuer; (e) any invalidity of, or defect or deficiency in, the Securities; (f) the settlement or compromise of any obligation guaranteed hereby or hereby incurred; or (g) any other circumstance whatsoever that might otherwise constitute a legal or equitable discharge or defense of a guarantor, it being the intent of this Section 5.3 that the obligations of the Guarantor hereunder shall be absolute and unconditional under any and all circumstances. There shall be no obligation of the Holders to give notice to, or obtain the consent of, the Guarantor with respect to the happening of any of the foregoing. SECTION 5.4. Rights of Holders. The Guarantor expressly acknowledges that: (i) this Guarantee Agreement will be deposited with the Guarantee Trustee to be held for the benefit of the Holders; (ii) the Guarantee Trustee has the right to enforce this Guarantee Agreement on behalf of the Holders; (iii) the Holders of a Majority in liquidation preference of the Securities have the right to direct the time, method and place of conducting any proceeding for any remedy available to the Guarantee Trustee in respect of this
11 Guarantee Agreement or exercising any trust or power conferred upon the Guarantee Trustee under this Guarantee Agreement; and (iv) any Holder may institute a legal proceeding directly against the Guarantor to enforce its rights under this Guarantee Agreement, without first instituting a legal proceeding against the Guarantee Trustee, the Issuer or any other Person. SECTION 5.5. Guarantee of Payment. This Guarantee Agreement creates a guarantee of payment and not of collection. This Guarantee Agreement will not be discharged except by payment of the Guarantee Payments in full (without duplication of amounts theretofore paid by the Issuer) or upon distribution of Debentures to Holders as provided in the Trust Agreement. SECTION 5.6. Subrogation. The Guarantor shall be subrogated to all (if any) rights of the Holders against the Issuer in respect of any amounts paid to the Holders by the Guarantor under this Guarantee Agreement and shall have the right to waive payment by the Issuer pursuant to Section 5.1; provided, however, that the Guarantor shall not (except to the extent required by mandatory provisions of law) be entitled to enforce or exercise any rights which it may acquire by way of subrogation or any indemnity, reimbursement or other agreement, in all cases as a result of payment under this Guarantee Agreement, if, at the time of any such payment, any amounts are due and unpaid under this Guarantee Agreement. If any amount shall be paid to the Guarantor in violation of the preceding sentence, the Guarantor agrees to hold such amount in trust for the Holders and to pay over such amount to the Holders. SECTION 5.7. Independent Obligations. The Guarantor acknowledges that its obligations hereunder are independent of the obligations of the Issuer with respect to the Securities and that the Guarantor shall be liable as principal and as debtor hereunder to make Guarantee Payments pursuant to the terms of this Guarantee Agreement notwithstanding the occurrence of any event referred to in subsections (a) through (g), inclusive, of Section 5.3 hereof. ARTICLE VI. COVENANTS AND SUBORDINATION SECTION 6.1. Subordination. The obligations of the Guarantor under this Guarantee Agreement will constitute unsecured obligations of the Guarantor and will rank subordinate and junior in right of payment to all Senior Debt (as defined in the Indenture) of the Guarantor, except those made pari passu or subordinate to such obligations expressly by their terms. in the same manner as set forth in Article XIII of the Indenture. SECTION 6.2. Pari Passu Guarantees. The obligations of the Guarantor under this Guarantee Agreement shall rank pari passu with the obligations of the Guarantor under any similar Guarantee Agreements issued by the Guarantor on behalf of the holders of preferred securities issued by any Trust (as defined in the Indenture).
12 * ARTICLE VII. TERMINATION SECTION 7.1. Termination. This Guarantee Agreement shall terminate and be of no further force and effect upon (i) full payment of the Redemption Price of all Securities, (ii) the distribution of Debentures to the Holders in exchange for all of the Securities or (iii) full payment of the amounts payable in accordance with the Trust Agreement upon liquidation of the Issuer. Notwithstanding the foregoing, this Guarantee Agreement will continue to be effective or will be reinstated, as the case may be, if at any time any Holder must restore payment of any sums paid with respect to Securities or this Guarantee Agreement. ARTICLE VIII. MISCELLANEOUS SECTION 8.1. Successors and Assigns. All guarantees and agreements contained in this Guarantee Agreement shall bind the successors, assigns, receivers, trustees and representatives of the Guarantor and shall inure to the benefit of the Holders of the Securities then outstanding. Except in connection with a consolidation, merger or sale involving the Guarantor that is permitted under Article VIII of the Indenture and pursuant to which the successor or assignee agrees in writing to perform the Guarantor's obligations hereunder, the Guarantor shall not assign its obligations hereunder. SECTION 8.2. Amendments. Except with respect to any changes which do not adversely affect the rights of the Holders or the Guarantee Trustee in any material respect (in which case no consent of the Holders or the Guarantee Trustee, as the case may be, will be required), this Guarantee Agreement may only be amended with the prior approval of the Holders of not less than a Majority in Liquidation Amount of all the outstanding Securities and of the Guarantee Trustee. The provisions of Article VI of the Trust Agreement concerning meetings of the Holders shall apply to the giving of such approval. SECTION 8.3. Notices. Any notice, request or other communication required or permitted to be given hereunder shall be in writing, duly signed by the party giving such notice, and delivered, telecopied or mailed by first class mail as follows: (a) if given to the Guarantor, to the address set forth below or such other address, facsimile number or to the attention of such other Person as the Guarantor may give notice to the Holders:
13 The Chase Manhattan Corporation 270 Park Avenue New York, New York 10017 Facsimile No.: 212-270-1604 Attention: Treasurer (b) if given to the Issuer, in care of the Guarantee Trustee, at the Issuer's (and the Guarantee Trustee's) address set forth below or such other address as the Guarantee Trustee on behalf of the Issuer may give notice to the Holders: Chase Capital II c/o The Chase Manhattan Corporation 270 Park Avenue New York, New York 10017 Facsimile No.: 212-270-1604 Attention: Treasurer with a copy to: The Bank of New York 101 Barclay Street, Floor 21 West New York, New York 10286 Facsimile No.: 212-815-5915 Attention: Corporate Trust Administration (c) if given to any Holder, at the address set forth on the books and records of the Issuer. All notices hereunder shall be deemed to have been given when received in person, telecopied with receipt confirmed, or mailed by first class mail, postage prepaid, except that if a notice or other document is refused delivery or cannot be delivered because of a changed address of which no notice was given, such notice or other document shall be deemed to have been delivered on the date of such refusal or inability to deliver. SECTION 8.4. Benefit. This Guarantee Agreement is solely for the benefit of the Holders and is not separately transferable from the Securities. SECTION 8.5. Interpretation. In this Guarantee Agreement, unless the context otherwise requires: (a) capitalized terms used in this Guarantee Agreement but not defined in the preamble hereto have the respective meanings assigned to them in Section 1.1;
14 (b) a term defined anywhere in this Guarantee Agreement has the same meaning throughout; (c) all references to "the Guarantee Agreement" or "this Guarantee Agreement" are to this Guarantee Agreement as modified, supplemented or amended from time to time; (d) all references in this Guarantee Agreement to Articles and Sections are to Articles and Sections of this Guarantee Agreement unless otherwise specified; (e) a term defined in the Trust Indenture Act has the same meaning when used in this Guarantee Agreement unless otherwise defined in this Guarantee Agreement or unless the context otherwise requires; (f) a reference to the singular includes the plural and vice versa; and (g) the masculine, feminine or neuter genders used herein shall include the masculine, feminine and neuter genders. SECTION 8.6. Governing Law. THIS GUARANTEE AGREEMENT SHALL BE GOVERNED BY AND CONSTRUED AND INTERPRETED IN ACCORDANCE WITH THE LAWS OF THE STATE OF NEW YORK WITHOUT REGARD TO THE CONFLICT OF LAW PRINCIPLES THEREOF.
15 This instrument may be executed in any number of counterparts, each of which so executed shall be deemed to be an original, but all such counterparts shall together constitute but one and the same instrument. THIS GUARANTEE AGREEMENT is executed as of the day and year first above written. THE CHASE MANHATTAN CORPORATION By: /s/ Deborah L. Duncan ------------------------------ Name: Deborah L. Duncan Title: Treasurer THE BANK OF NEW YORK as Guarantee Trustee By: /s/ Paul J. Schmalzel ------------------------------ Name: Paul J. Schmalzel Title: Assistant Treasurer
Exhibit 4.8(c) AMENDED AND RESTATED TRUST AGREEMENT among THE CHASE MANHATTAN CORPORATION, as Depositor, THE BANK OF NEW YORK, as Property Trustee, THE BANK OF NEW YORK (DELAWARE), as Delaware Trustee, THE ADMINISTRATIVE TRUSTEES NAMED HEREIN, and THE SEVERAL HOLDERS (AS DEFINED HEREIN) Dated as of January 24, 1997 CHASE CAPITAL II
CHASE CAPITAL II Certain Sections of this Trust Agreement relating to Sections 310 through 318 of the Trust Indenture Act of 1939: Trust Indenture Trust Agreement Act Section Section - --------------- --------------- (Section) 310 (a)(1)......................................... 8.7 (a)(2)......................................... 8.7 (a)(3)......................................... 8.9 (a)(4)......................................... 2.7(a)(ii) (b)............................................ 8.8 (Section) 311 (a)............................................ 8.13 (b)............................................ 8.13 (Section) 312 (a)............................................ 5.7 (b)............................................ 5.7 (c)............................................ 5.7 (Section) 313 (a)............................................ 8.14(a) (a)(4)......................................... 8.14(b) (b)............................................ 8.14(b) (c)............................................ 10.9 (d)............................................ 8.14(c) (Section) 314 (a)............................................ 8.15 (b)............................................ Not Applicable (c)(1)......................................... 8.16 (c)(2)......................................... 8.16 (c)(3)......................................... Not Applicable (d)............................................ Not Applicable (e)............................................ 1.1, 8.16 (Section) 315 (a)............................................ 8.1(a), 8.3(a) (b)............................................ 8.2, 10.9 (c)............................................ 8.1(a) (d)............................................ 8.1, 8.3 (e)............................................ Not Applicable (Section) 316 (a)............................................ Not Applicable (a)(1)(A)...................................... Not Applicable (a)(1)(B)...................................... Not Applicable (a)(2)......................................... Not Applicable (b)............................................ 5.14 (c)............................................ 6.7 (Section) 317 (a)(1)......................................... Not Applicable (a)(2)......................................... Not Applicable (b)............................................ 5.9 (Section) 318 (a)............................................ 10.11
Trust Indenture Trust Agreement Act Section Section - --------------- --------------- Note: This reconciliation and tie sheet shall not, for any purpose, be deemed to be a part of the Trust Agreement.
TABLE OF CONTENTS ARTICLE I DEFINED TERMS............................. 1 SECTION 1.1 Definitions. ............................................. 1 ARTICLE II CONTINUATION OF THE TRUST....................... 10 SECTION 2.1 Name. .................................................... 10 SECTION 2.2 Office of the Delaware Trustee; Principal Place of Business. ...................................................... 10 SECTION 2.3 Initial Contribution of Trust Property; Organizational Expenses. ...................................................... 10 SECTION 2.4 Issuance of the Capital Securities. ...................... 10 SECTION 2.5 Issuance of the Common Securities; Subscription and Purchase of Debentures. ........................................ 10 SECTION 2.6 Declaration of Trust. .................................... 11 SECTION 2.7 Authorization to Enter into Certain Transactions. ........ 11 SECTION 2.8 Assets of Trust. ......................................... 14 SECTION 2.9 Title to Trust Property. ................................. 14 ARTICLE III PAYMENT ACCOUNT............................ 15 SECTION 3.1 Payment Account. ......................................... 15 ARTICLE IV DISTRIBUTIONS; REDEMPTION....................... 15 SECTION 4.1 Distributions. ........................................... 16 SECTION 4.2 Redemption. .............................................. 17 SECTION 4.3 Subordination of Common Securities. ...................... 18 SECTION 4.4 Payment Procedures. ...................................... 19 SECTION 4.5 Tax Returns and Reports. ................................. 19 SECTION 4.6 Payment of Expenses of the Trust. ........................ 19 SECTION 4.7 Payments under Indenture or Pursuant to Direct Actions. .. 19 ARTICLE V TRUST SECURITIES CERTIFICATES..................... 19 SECTION 5.1 Initial Ownership. ....................................... 19 SECTION 5.2 The Trust Securities Certificates. ....................... 19 SECTION 5.3 Execution and Delivery of Trust Securities Certificates. . 20 SECTION 5.4 Registration of Transfer and Exchange of Capital Securities Certificates. ....................................... 20 SECTION 5.5 Mutilated, Destroyed, Lost or Stolen Trust Securities Certificates. .................................................. 21 SECTION 5.6 Persons Deemed Securityholders. .......................... 21 SECTION 5.7 Access to List of Securityholders' Names and Addresses. .. 22 i
PAGE SECTION 5.8 Maintenance of Office or Agency. ......................... 22 SECTION 5.9 Appointment of Paying Agent. ............................. 22 SECTION 5.10 Ownership of Common Securities by Depositor. ............ 23 SECTION 5.11 Book-Entry Capital Securities Certificates; Common Securities Certificate. ........................................ 23 SECTION 5.12 Notices to Clearing Agency. ............................. 24 SECTION 5.13 Definitive Capital Securities Certificates. ............. 24 SECTION 5.14 Rights of Securityholders. .............................. 24 SECTION 5.15 CUSIP Numbers. .......................................... 26 ARTICLE VI ACTS OF SECURITYHOLDERS; MEETINGS; VOTING............... 27 SECTION 6.1 Limitations on Voting Rights. ............................ 27 SECTION 6.2 Notice of Meetings. ...................................... 27 SECTION 6.3 Meetings of Capital Securityholders. ..................... 28 SECTION 6.4 Voting Rights. ........................................... 28 SECTION 6.5 Proxies, etc. ............................................ 28 SECTION 6.6 Securityholder Action by Written Consent. ................ 29 SECTION 6.7 Record Date for Voting and Other Purposes. ............... 29 SECTION 6.8 Acts of Securityholders. ................................. 29 SECTION 6.9 Inspection of Records. ................................... 30 ARTICLE VII REPRESENTATIONS AND WARRANTIES..................... 30 SECTION 7.1 Representations and Warranties of the Property Trustee and the Delaware. .............................................. 30 SECTION 7.2 Representations and Warranties of Depositor. ............. 31 ARTICLE VIII THE TRUSTEES............................. 32 SECTION 8.1 Certain Duties and Responsibilities. ..................... 32 SECTION 8.2 Certain Notices. ......................................... 33 SECTION 8.3 Certain Rights of Property Trustee. ...................... 33 SECTION 8.4 Not Responsible for Recitals or Issuance of Securities. .. 35 SECTION 8.5 May Hold Securities. ..................................... 35 SECTION 8.6 Compensation; Indemnity; Fees. ........................... 36 SECTION 8.7 Corporate Property Trustee Required; Eligibility of Trustees. ...................................................... 37 SECTION 8.8 Conflicting Interests. ................................... 37 SECTION 8.9 Co-Trustees and Separate Trustee. ........................ 37 SECTION 8.10 Resignation and Removal; Appointment of Successor. ...... 39 SECTION 8.11 Acceptance of Appointment by Successor. ................. 40 SECTION 8.12 Merger, Conversion, Consolidation or Succession to Business. ...................................................... 40 SECTION 8.13 Preferential Collection of Claims Against Depositor or Trust. ...................................................... 41 SECTION 8.14 Reports by Property Trustee. ............................ 41 SECTION 8.15 Reports to the Property Trustee. ........................ 42 SECTION 8.16 Evidence of Compliance with Conditions Precedent. ....... 42
PAGE SECTION 8.17 Number of Trustees. ..................................... 42 SECTION 8.18 Delegation of Power. .................................... 42 ARTICLE IX TERMINATION, LIQUIDATION AND MERGER.................. 43 SECTION 9.1 Termination Upon Expiration Date. ........................ 43 SECTION 9.2 Early Termination. ....................................... 43 SECTION 9.3 Termination. ............................................. 43 SECTION 9.4 Liquidation. ............................................. 44 SECTION 9.5 Mergers, Consolidations, Amalgamations or Replacements of the Trust. .................................................. 45 ARTICLE X MISCELLANEOUS PROVISIONS........................ 46 SECTION 10.1 Limitation of Rights of Securityholders. ................ 46 SECTION 10.2 Liability of the Common Securityholder. ................. 46 SECTION 10.3 Amendment. .............................................. 46 SECTION 10.4 Separability. ........................................... 47 SECTION 10.6 Payments Due on Non-Business Day. ....................... 48 SECTION 10.7 Successors. ............................................. 48 SECTION 10.8 Headings. ............................................... 48 SECTION 10.9 Reports, Notices and Demands. ........................... 48 SECTION 10.10 Agreement Not to Petition. ............................. 49 SECTION 10.11 Trust Indenture Act; Conflict with Trust Indenture Act.. 49 SECTION 10.12 Acceptance of Terms of Trust Agreement, Guarantee and Indenture. ..................................................... 50 SECTION 10.13 Holders are Parties. ................................... 50 SECTION 10.14 Counterparts. .......................................... 51
AMENDED AND RESTATED TRUST AGREEMENT, dated as of January 24, 1997, among (i) The Chase Manhattan Corporation, a Delaware corporation (including any successors or assigns, the "Depositor"), (ii) The Bank of New York, a New York banking corporation, as property trustee (in each such capacity, the "Property Trustee" and, in its separate corporate capacity and not in its capacity as Property Trustee, the "Bank"), (iii) The Bank of New York (Delaware), a banking corporation organized under the laws of the State of Delaware, as Delaware trustee (the "Delaware Trustee"), (iv) Peter J. Tobin, an individual, and Deborah L. Duncan, an individual, each of whose address is c/o The Chase Manhattan Corporation, 270 Park Avenue, New York, NY 10017 (each an "Administrative Trustee" and collectively the "Administrative Trustees") (the Property Trustee, the Delaware Trustee and the Administrative Trustees referred to collectively as the "Trustees") and (v) the several Holders, as hereinafter defined. WITNESSETH WHEREAS, the Depositor and the Delaware Trustee have heretofore duly declared and established a business trust pursuant to the Delaware Business Trust Act by the entering into that certain Trust Agreement, dated as of October 24, 1996 (the "Original Trust Agreement"), and by the execution and filing with the Secretary of State of the State of Delaware of the Certificate of Trust, filed on October 28, 1996, and the Restated Certificate of Trust, filed on November 12, 1996, both attached as parts of Exhibit A (together the "Certificate of Trust"); and WHEREAS, the Depositor and the Trustees desire to amend and restate the Original Trust Agreement in its entirety as set forth herein to provide for, among other things, (i) the issuance of the Common Securities by the Trust to the Depositor, (ii) the issuance and sale of the Capital Securities by the Trust pursuant to the Underwriting Agreement and (iii) the acquisition by the Trust from the Depositor of all of the right, title and interest in the Debentures; NOW THEREFORE, in consideration of the agreements and obligations set forth herein and for other good and valuable consideration, the sufficiency of which is hereby acknowledged, each party, for the benefit of the other parties and for the benefit of the Securityholders, hereby amends and restates the Original Trust Agreement in its entirety and agrees as follows: ARTICLE I DEFINED TERMS SECTION 1.1 Definitions. For all purposes of this Trust Agreement, except as otherwise expressly provided or unless the context otherwise requires: (a) the terms defined in this Article have the meanings assigned to them in this Article and include the plural as well as the singular;
2 (b) all other terms used herein that are defined in the Trust Indenture Act, either directly or by reference therein, have the meanings assigned to them therein; (c) unless the context otherwise requires, any reference to an "Article" or a "Section" refers to an Article or a Section, as the case may be, of this Trust Agreement; and (d) the words "herein", "hereof" and "hereunder" and other words of similar import refer to this Trust Agreement as a whole and not to any particular Article, Section or other subdivision. "Act" has the meaning specified in Section 6.8. "Additional Amount" means, with respect to Trust Securities of a given Liquidation Amount and/or a given period, the amount of Additional Interest (as defined in the Indenture) paid by the Depositor on a Like Amount of Debentures for such period. "Administrative Trustee" means each of the individuals identified as an "Administrative Trustee" in the preamble to this Trust Agreement solely in such individual's capacity as Administrative Trustee of the Trust formed and continued hereunder and not in such individual's individual capacity, or such Administrative Trustee's successor in interest in such capacity, or any successor trustee appointed as herein provided. "Affiliate" of any specified Person means any other Person directly or indirectly controlling or controlled by or under direct or indirect common control with such specified Person. For the purposes of this definition, "control" when used with respect to any specified Person means the power to direct the management and policies of such Person, directly or indirectly, whether through the ownership of voting securities, by contract or otherwise; and the terms "controlling" and "controlled" have meanings correlative to the foregoing. "Bank" has the meaning specified in the preamble to this Trust Agreement. "Bankruptcy Event" means, with respect to any Person: (a) the entry of a decree or order by a court having jurisdiction in the premises judging such Person a bankrupt or insolvent, or approving as properly filed a petition seeking reorganization, arrangement, adjudication or composition of or in respect of such Person under any applicable federal or state bankruptcy, insolvency, reorganization or other similar law, or appointing a receiver, liquidator, assignee, trustee, sequestrator (or other similar official) of such Person or of any substantial part of its property or ordering the winding up or liquidation of its affairs, and the continuance of any such decree or order unstayed and in effect for a period of 60 consecutive days; or (b) the institution by such Person of proceedings to be adjudicated a bankrupt or insolvent, or the consent by it to the institution of bankruptcy or insolvency proceedings against it, or the filing by it of a petition or answer or consent seeking reorganization or relief under any applicable federal or state bankruptcy, insolvency, reorganization or other similar law, or the consent by it to the filing of any such petition or to the appointment of a receiver, liquidator, assignee, trustee, sequestrator (or similar official) of such Person or of any substantial part of its property, or the making by it of an assignment for the benefit of creditors, or the admission by it in writing of its
3 inability to pay its debts generally as they become due and its willingness to be adjudicated a bankrupt, or the taking of corporate action by such Person in furtherance of any such action. "Bankruptcy Laws" has the meaning specified in Section 10.10. "Board Resolution" means a copy of a resolution certified by the Secretary or an Assistant Secretary of the Depositor to have been duly adopted by the Depositor's Board of Directors, or such committee of the Board of Directors or officers of the Depositor to which authority to act on behalf of the Board of Directors has been delegated, and to be in full force and effect on the date of such certification, and delivered to the Trustees. "Book-Entry Capital Securities Certificates" means a beneficial interest in the Capital Securities Certificates, ownership and transfers of which shall be made through book entries by a Clearing Agency as described in Section 5.11. "Business Day" means a day other than (a) a Saturday or Sunday, (b) a day on which banking institutions in The City of New York are authorized or required by law or executive order to remain closed, or (c) a day on which the Property Trustee's Corporate Trust Office or the Corporate Trust Office of the Debenture Trustee is closed for business. "Capital Security" means an undivided beneficial interest in the assets of the Trust, having a Liquidation Amount of $1,000 and having the rights provided therefor in this Trust Agreement, including the right to receive Distributions and a Liquidation Distribution as provided herein. "Capital Securities Certificate" means a certificate evidencing ownership of Capital Securities, substantially in the form attached as Exhibit D. "Capital Treatment Event" means the reasonable determination by the Depositor that, as a result of any amendment to, or change (including any proposed change) in, the laws (or any regulations thereunder) of the United States or any political subdivision thereof or therein, or as a result of any official or administrative pronouncement or action or judicial decision interpreting or applying such laws or regulations, which amendment or change is effective or such proposed change, pronouncement, action or decision is announced on or after the date of issuance of the Capital Securities hereunder, there is more than an insubstantial risk that the Depositor will not be entitled to treat an amount equal to the Liquidation Amount of the Capital Securities as "Tier 1 Capital" (or the then equivalent thereof) for purposes of the capital adequacy guidelines of the Federal Reserve, as then in effect and applicable to the Depositor. "Certificate Depository Agreement" means the agreement among the Trust, the Depositor and The Depository Trust Company, as the initial Clearing Agency, dated as of the Closing Date, relating to the Trust Securities Certificates, substantially in the form attached as Exhibit B, as the same may be amended and supplemented from time to time. "Certificate of Trust" has the meaning specified in the recitals hereof, as amended from time to time.
4 "Clearing Agency" means an organization registered as a "clearing agency" pursuant to Section 17A of the Securities Exchange Act of 1934, as amended. The Depository Trust Company will be the initial Clearing Agency. "Clearing Agency Participant" means a broker, dealer, bank, other financial institution or other Person for whom from time to time a Clearing Agency effects book-entry transfers and pledges of securities deposited with the Clearing Agency. "Closing Date" means the date of execution and delivery of this Trust Agreement. "Code" means the Internal Revenue Code of 1986, as amended. "Commission" means the Securities and Exchange Commission, as from time to time constituted, created under the Securities Exchange Act of 1934, as amended, or, if at any time after the execution of this instrument such Commission is not existing and performing the duties now assigned to it under the Trust Indenture Act, then the body performing such duties at such time. "Common Securities Certificate" means a certificate evidencing ownership of Common Securities, substantially in the form attached as Exhibit C. "Common Security" means an undivided beneficial interest in the assets of the Trust, having a Liquidation Amount of $1,000 and having the rights provided therefor in this Trust Agreement, including the right to receive Distributions and a Liquidation Distribution as provided herein. "Corporate Trust Office" means (i) when used with respect to the Property Trustee, the principal office of the Property Trustee located in New York, New York, and (ii) when used with respect to the Debenture Trustee, the principal office of the Debenture Trustee located in New York, New York. "Debenture Event of Default" means an "Event of Default" as defined in the Indenture. "Debenture Maturity Date" means the date specified pursuant to the terms of the Debentures as the date on which the principal of the Debentures is due and payable, as such date may be shortened pursuant to the terms of the Debentures. "Debenture Redemption Date" means, with respect to any Debentures to be redeemed under the Indenture, the date fixed for redemption under the Indenture. "Debenture Tax Event" means a "Tax Event" as defined in the Indenture. "Debenture Trustee" means The Bank of New York, a New York banking corporation, as trustee under the Indenture, and any successor trustee appointed as provided therein. "Debentures" means the $515,464,000 aggregate principal amount of the Depositor's Global Floating Rate Junior Subordinated Deferrable Interest Debentures, Series B, issued pursuant to the Indenture.
5 "Definitive Capital Securities Certificates" means either or both (as the context requires) of (a) Capital Securities Certificates issued as Book-Entry Capital Securities Certificates as provided in Section 5.11(a) and (b) Capital Securities Certificates issued in certificated, fully registered form as provided in Section 5.13. "Delaware Business Trust Act" means Chapter 38 of Title 12 of the Delaware Code, 12 Del. C. 3801, et seq., as it may be amended from time to time. "Delaware Trustee" means the Person identified as the "Delaware Trustee" in the preamble to this Trust Agreement solely in its capacity as Delaware Trustee of the Trust formed and continued hereunder and not in its individual capacity, or its successor in interest in such capacity, or any successor trustee appointed as herein provided. "Depositor" has the meaning specified in the preamble to this Trust Agreement. "Distribution Date" has the meaning specified in Section 4.1(a). "Distributions" means amounts payable in respect of the Trust Securities as provided in Section 4.1. "Early Termination Event" has the meaning specified in Section 9.2. "Event of Default" means any one of the following events (whatever the reason for such Event of Default and whether it shall be voluntary or involuntary or be effected by operation of law or pursuant to any judgment, decree or order of any court or any order, rule or regulation of any administrative or governmental body): (a) the occurrence of a Debenture Event of Default; or (b) default by the Property Trustee in the payment of any Distribution when it becomes due and payable, and continuation of such default for a period of 30 days; or (c) default by the Property Trustee in the payment of any Redemption Price of any Trust Security when it becomes due and payable; or (d) default in the performance, or breach, in any material respect, of any covenant or warranty of the Trustees in this Trust Agreement (other than a covenant or warranty a default in the performance or breach of which is dealt with in clause (b) or (c) above) and continuation of such default or breach for a period of 90 days after there has been given, by registered or certified mail, to the defaulting Trustee or Trustees by the Holders of at least 25% in aggregate Liquidation Amount of the Outstanding Capital Securities, a written notice specifying such default or breach and requiring it to be remedied and stating that such notice is a "Notice of Default" hereunder; or (e) the occurrence of a Bankruptcy Event with respect to the Property Trustee and the failure by the Depositor to appoint a successor Property Trustee within 90 days thereof.
6 "Expiration Date" has the meaning specified in Section 9.1. "Federal Reserve" means the Board of Governors of the Federal Reserve System, as from time to time constituted, or if at any time after the execution of this Trust Agreement the Federal Reserve is not existing and performing the duties now assigned to it, then the body performing such duties at such time. "Guarantee" means the Guarantee Agreement executed and delivered by the Depositor and The Bank of New York, as trustee, contemporaneously with the execution and delivery of this Trust Agreement, for the benefit of the Holders of the Trust Securities, as amended from time to time. "Indenture" means the Junior Subordinated Indenture, dated as of December 1, 1996, between the Depositor and the Debenture Trustee, as trustee, as amended or supplemented from time to time. "Lien" means any lien, pledge, charge, encumbrance, mortgage, deed of trust, adverse ownership interest, hypothecation, assignment, security interest or preference, priority or other security agreement or preferential arrangement of any kind or nature whatsoever. "Like Amount" means (a) with respect to a redemption of Trust Securities, Trust Securities having a Liquidation Amount equal to the principal amount of Debentures to be contemporaneously redeemed in accordance with the Indenture the proceeds of which will be used to pay the Redemption Price of such Trust Securities, and (b) with respect to a distribution of Debentures to Holders of Trust Securities in connection with a dissolution or liquidation of the Trust, Debentures having a principal amount equal to the Liquidation Amount of the Trust Securities of the Holder to whom such Debentures are distributed. "Liquidation Amount" means the stated amount of $1,000 per Trust Security. "Liquidation Date" means the date on which Debentures are to be distributed to Holders of Trust Securities in connection with a termination and liquidation of the Trust pursuant to Section 9.4(a). "Liquidation Distribution" has the meaning specified in Section 9.4(d). "1940 Act" means the Investment Company Act of 1940, as amended. "Officers' Certificate" means a certificate signed by the Chairman and Chief Executive Officer, President or a Vice President, and by the Treasurer, an Associate Treasurer, an Assistant Treasurer, the Controller, the Secretary or an Assistant Secretary, of the Depositor, and delivered to the appropriate Trustee. One of the officers signing an Officers' Certificate given pursuant to Section 8.16 shall be the principal executive, financial or accounting officer of the Depositor. Any Officers' Certificate delivered with respect to compliance with a condition or covenant provided for in this Trust Agreement shall include: (a) a statement that each officer signing the Officers' Certificate has read the covenant or condition and the definitions relating thereto;
7 (b) a brief statement of the nature and scope of the examination or investigation undertaken by each officer in rendering the Officers' Certificate; (c) a statement that each such officer has made such examination or investigation as, in such officer's opinion, is necessary to enable such officer to express an informed opinion as to whether or not such covenant or condition has been complied with; and (d) a statement as to whether, in the opinion of each such officer, such condition or covenant has been complied with. "Opinion of Counsel" means a written opinion of counsel, who may be counsel for the Trust, the Property Trustee or the Depositor, and who shall be reasonably acceptable to the Property Trustee. "Original Trust Agreement" has the meaning specified in the recitals to this Trust Agreement. "Outstanding", when used with respect to Trust Securities, means, as of the date of determination, all Trust Securities theretofore executed and delivered under this Trust Agreement, except: (a) Trust Securities theretofore cancelled by the Securities Registrar or delivered to the Securities Registrar for cancellation; (b) Trust Securities for whose payment or redemption money in the necessary amount has been theretofore deposited with the Property Trustee or any Paying Agent for the Holders of such Trust Securities; provided that, if such Trust Securities are to be redeemed, notice of such redemption has been duly given pursuant to this Trust Agreement; and (c) Trust Securities which have been paid or in exchange for or in lieu of which other Capital Securities have been executed and delivered pursuant to this Trust Agreement, including pursuant to Sections 5.4, 5.5, 5.11 and 5.13; provided, however, that in determining whether the Holders of the requisite Liquidation Amount of the Outstanding Capital Securities have given any request, demand, authorization, direction, notice, consent or waiver hereunder, Capital Securities owned by the Depositor, any Trustee or any Affiliate of the Depositor or any Trustee shall be disregarded and deemed not to be Outstanding, except that (a) in determining whether any Trustee shall be protected in relying upon any such request, demand, authorization, direction, notice, consent or waiver, only Capital Securities that such Trustee actually knows to be so owned shall be so disregarded and (b) the foregoing shall not apply at any time when all of the outstanding Capital Securities are owned by the Depositor, one or more of the Trustees and/or any such Affiliate. Capital Securities so owned which have been pledged in good faith may be regarded as Outstanding if the pledgee establishes to the satisfaction of the Administrative Trustees the pledgee's right so to act with respect to such Capital Securities and that the pledgee is not the Depositor or any Affiliate of the Depositor.
8 "Owner" means each Person who is the beneficial owner of a Book-Entry Capital Securities Certificate as reflected in the records of the Clearing Agency or, if a Clearing Agency Participant is not the beneficial owner, then as reflected in the records of a Person maintaining an account with such Clearing Agency (directly or indirectly, in accordance with the rules of such Clearing Agency). "Paying Agent" means any paying agent or co-paying agent appointed pursuant to Section 5.9 and shall initially be the Bank. "Payment Account" means a segregated non-interest-bearing corporate trust account maintained by the Property Trustee with the Bank in its corporate trust department for the benefit of the Securityholders in which all amounts paid in respect of the Debentures will be held and from which the Property Trustee, through the Paying Agent, shall make payments to the Securityholders in accordance with Sections 4.1 and 4.2. "Person" means any individual, corporation, partnership, joint venture, trust, limited liability company or corporation, unincorporated organization or government or any agency or political subdivision thereof. "Property Trustee" means the Person identified as the "Property Trustee" in the preamble to this Trust Agreement solely in its capacity as Property Trustee of the Trust heretofore created and continued hereunder and not in its individual capacity, or its successor in interest in such capacity, or any successor property trustee appointed as herein provided. "Redemption Date" means, with respect to any Trust Security to be redeemed, the date fixed for such redemption by or pursuant to this Trust Agreement; provided that each Debenture Redemption Date and the Debenture Maturity Date shall be a Redemption Date for a Like Amount of Trust Securities. "Redemption Price" means, with respect to any Trust Security, the Liquidation Amount of such Trust Security, plus accumulated and unpaid Distributions to the Redemption Date, paid by the Depositor upon the concurrent redemption of a Like Amount of Debentures, allocated on a pro rata basis (based on Liquidation Amounts) among the Trust Securities. "Relevant Trustee" shall have the meaning specified in Section 8.10. "Securities Register" and "Securities Registrar" have the respective meanings specified in Section 5.4. "Securityholder" or "Holder" means a Person in whose name a Trust Security or Trust Securities is registered in the Securities Register; any such Person shall be a beneficial owner within the meaning of the Delaware Business Trust Act; provided, however, that in determining whether the Holders of the requisite amount of Capital Securities have voted on any matter provided for in this Trust Agreement, then for the purpose of any such determination, so long as Definitive Capital Securities Certificates have not been issued, the term Securityholders or Holders as used herein shall refer to the Owners.
9 "Tax Event" means the receipt by the Trust of an Opinion of Counsel experienced in such matters to the effect that, as a result of any amendment to, or change (including any announced proposed change) in, the laws (or any regulations thereunder) of the United States or any political subdivision or taxing authority thereof or therein, or as a result of any official administrative pronouncement or judicial decision interpreting or applying such laws or regulations, which amendment or change is effective or which proposed change, pronouncement or decision is announced on or after the date of issuance of the Capital Securities under this Trust Agreement, there is more than an insubstantial risk that (i) the Trust is, or will be within 90 days after the date of such Opinion of Counsel, subject to United States federal income tax with respect to income received or accrued on the Debentures, (ii) interest payable by the Depositor on the Debentures is not, or within 90 days after the date of such Opinion of Counsel, will not be, deductible by the Depositor, in whole or in part, for United States federal income tax purposes or (iii) the Trust is, or will be within 90 days after the date of such Opinion of Counsel, subject to more than a de minimis amount of other taxes, duties or other governmental charges. "Trust" means the Delaware business trust created and continued hereby and identified on the cover page to this Trust Agreement. "Trust Agreement" means this Amended and Restated Trust Agreement, as the same may be modified, amended or supplemented in accordance with the applicable provisions hereof, including (i) all exhibits hereto and (ii) for all purposes of this Trust Agreement and any such modification, amendment or supplement, the provisions of the Trust Indenture Act that are deemed to be a part of and govern this Trust Agreement and any such modification, amendment or supplement, respectively. "Trust Indenture Act" means the Trust Indenture Act of 1939 as in force at the date as of which this instrument was executed; provided, however, that in the event the Trust Indenture Act of 1939 is amended after such date, "Trust Indenture Act" means, to the extent required by any such amendment, the Trust Indenture Act of 1939 as so amended. "Trust Property" means (a) the Debentures, (b) any cash on deposit in, or owing to, the Payment Account and (c) all proceeds and rights in respect of the foregoing. "Trust Securities Certificate" means any one of the Common Securities Certificates or the Capital Securities Certificates. "Trust Security" means any one of the Common Securities or the Capital Securities. "Trustees" means, collectively, the Property Trustee, the Delaware Trustee and the Administrative Trustees. "Underwriting Agreement" means the Pricing Agreement, dated as of January 16, 1997, among the Trust, the Depositor and Goldman, Sachs & Co.; Chase Securities Inc.; Merrill Lynch, Pierce, Fenner & Smith Incorporated; Bear, Stearns & Co. Inc.; Credit Suisse First Boston Corporation; Lehman Brothers Inc.; Morgan Stanley & Co. Incorporated; Salomon Brothers Inc; Smith Barney Inc. and UBS Securities LLC, the underwriters named therein, incorporating the Standard Provisions dated January 16, 1997.
10 ARTICLE II CONTINUATION OF THE TRUST SECTION 2.1 Name. The Trust continued hereby shall be known as "Chase Capital II," as such name may be modified from time to time by the Administrative Trustees following written notice to the Holders of Trust Securities and the other Trustees, in which name the Trustees engage in the transactions contemplated hereby, make and execute contracts and other instruments on behalf of the Trust and sue and be sued. SECTION 2.2 Office of the Delaware Trustee; Principal Place of Business. The address of the Delaware Trustee in the State of Delaware is c/o The Bank of New York (Delaware), White Clay Center, Route 273, Newark, Delaware 19711, Attention: Corporate Trust Department, or such other address in the State of Delaware as the Delaware Trustee may designate by written notice to the Securityholders and the Depositor. The principal executive office of the Trust is c/o The Chase Manhattan Corporation, 270 Park Avenue, New York, NY 10017. SECTION 2.3 Initial Contribution of Trust Property; Organizational Expenses. The Property Trustee acknowledges receipt in trust from the Depositor in connection with the Original Trust Agreement of the sum of $10, which constituted the initial Trust Property. The Depositor shall pay organizational expenses of the Trust as they arise or shall, upon request of any Trustee, promptly reimburse such Trustee for any such expenses paid by such Trustee. The Depositor shall make no claim upon the Trust Property for the payment of such expenses. SECTION 2.4 Issuance of the Capital Securities. As of January 16, 1997, the Depositor, on behalf of the Trust and pursuant to the Original Trust Agreement, executed and delivered the Underwriting Agreement. Contemporaneously with the execution and delivery of this Trust Agreement, an Administrative Trustee, on behalf of the Trust, shall execute in accordance with Section 5.2 and deliver to the Underwriters named in the Underwriting Agreement Capital Securities Certificates, registered in the name of the nominee of the initial Clearing Agency, in an aggregate amount of 500,000 Capital Securities having an aggregate Liquidation Amount of $500,000,000, against receipt of an aggregate purchase price plus accrued distributions from January 24, 1997, if any, of such Capital Securities of $494,140,000 which amount such Administrative Trustee shall promptly deliver to the Property Trustee. SECTION 2.5 Issuance of the Common Securities; Subscription and Purchase of Debentures. Contemporaneously with the execution and delivery of this Trust Agreement, an Administrative Trustee, on behalf of the Trust, shall execute in accordance with Section 5.2 and deliver to the Depositor Common Securities Certificates, registered in the name of the Depositor,
11 in an aggregate amount of 15,464 Common Securities having an aggregate Liquidation Amount of $15,464,000 against payment by the Depositor of an aggregate purchase price therefor of $15,282,762, which amount such Administrative Trustee shall promptly deliver to the Property Trustee. Contemporaneously therewith, an Administrative Trustee, on behalf of the Trust, shall subscribe to and purchase from the Depositor Debentures, registered in the name of the Trust and having an aggregate principal amount equal to $515,464,000, and, in satisfaction of the purchase price plus accrued interest from January 24, 1997, if any, for such Debentures, the Property Trustee, on behalf of the Trust, shall deliver to the Depositor the sum of $509,422,762 (being the sum of the amounts delivered to the Property Trustee pursuant to (i) the second sentence of Section 2.4 and (ii) the first sentence of this Section 2.5). SECTION 2.6 Declaration of Trust. The exclusive purposes and functions of the Trust are (a) to issue and sell Trust Securities, (b) to use the proceeds from such sale to acquire the Debentures and (c) to engage in those activities necessary or incidental thereto. The Depositor hereby appoints the Trustees as trustees of the Trust, to have all the rights, powers and duties to the extent set forth herein, and the Trustees hereby accept such appointment. The Property Trustee hereby declares that it will hold the Trust Property in trust upon and subject to the conditions set forth herein for the benefit of the Trust and the Securityholders. The Administrative Trustees shall have all rights, powers and duties set forth herein and in accordance with applicable law with respect to accomplishing the purposes of the Trust. The Delaware Trustee shall not be entitled to exercise any powers, nor shall the Delaware Trustee have any of the duties and responsibilities, of the Property Trustee or the Administrative Trustees set forth herein. The Delaware Trustee shall be one of the Trustees of the Trust for the sole and limited purpose of fulfilling the requirements of Section 3807 of the Delaware Business Trust Act. SECTION 2.7 Authorization to Enter into Certain Transactions. (a) The Trustees shall conduct the affairs of the Trust in accordance with the terms of this Trust Agreement. Subject to the limitations set forth in paragraph (b) of this Section and Article VIII and in accordance with the following provisions (i) and (ii), the Trustees shall have the authority to enter into all transactions and agreements determined by the Trustees to be appropriate in exercising the authority, express or implied, otherwise granted to the Trustees under this Trust Agreement, and to perform all acts in furtherance thereof, including without limitation, the following: (i) As among the Trustees, each Administrative Trustee shall have the power and authority to act on behalf of the Trust with respect to the following matters: (A) the issuance and sale of the Trust Securities; (B) to cause the Trust to enter into, and to execute, deliver and perform on behalf of the Trust, the Certificate Depository Agreement and such other agreements as may be necessary or desirable in connection with the purposes and function of the Trust; (C) assisting in the registration of the Capital Securities under the Securities Act of 1933, as amended, and under state securities or blue sky laws,
12 and the qualification of this Trust Agreement as a trust indenture under the Trust Indenture Act; (D) assisting in the listing, if any, of the Capital Securities upon such national securities exchange or exchanges or automated quotation system or systems as shall be determined by the Depositor and the registration of the Capital Securities under the Securities Exchange Act of 1934, as amended, and the preparation and filing of all periodic and other reports and other documents pursuant to the foregoing; (E) the sending of notices (other than notices of default) and other information regarding the Trust Securities and the Debentures to the Securityholders in accordance with this Trust Agreement; (F) the appointment of a Paying Agent and Securities Registrar in accordance with this Trust Agreement; (G) registering transfer of the Trust Securities in accordance with this Trust Agreement; (H) to the extent provided in this Trust Agreement, the winding up of the affairs of and liquidation of the Trust and the execution and filing of the certificate of cancellation with the Secretary of State of the State of Delaware; (I) unless otherwise determined by the Depositor, the Property Trustee or the Administrative Trustees, or as otherwise required by the Delaware Business Trust Act or the Trust Indenture Act, to execute on behalf of the Trust (either acting alone or together with any or all of the Administrative Trustees) any documents that the Administrative Trustees have the power to execute pursuant to this Trust Agreement; and (J) the taking of any action incidental to the foregoing as the Trustees may from time to time determine is necessary or advisable to give effect to the terms of this Trust Agreement for the benefit of the Securityholders (without consideration of the effect of any such action on any particular Securityholder). (ii) As among the Trustees, the Property Trustee shall have the power, duty and authority to act on behalf of the Trust with respect to the following matters: (A) the establishment of the Payment Account; (B) the receipt of the Debentures; (C) the collection of interest, principal and any other payments made in respect of the Debentures in the Payment Account; (D) the distribution through the Paying Agent of amounts owed to the Securityholders in respect of the Trust Securities;
13 (E) the exercise of all of the rights, powers and privileges of a holder of the Debentures; (F) the sending of notices of default and other information regarding the Trust Securities and the Debentures to the Securityholders in accordance with this Trust Agreement; (G) the distribution of the Trust Property in accordance with the terms of this Trust Agreement; (H) to the extent provided in this Trust Agreement, the winding up of the affairs of and liquidation of the Trust and the execution and filing of the certificate of cancellation with the Secretary of State of the State of Delaware; and (I) except as otherwise provided in this Section 2.7(a)(ii), the Property Trustee shall have none of the duties, liabilities, powers or the authority of the Administrative Trustees set forth in Section 2.7(a)(i). (b) So long as this Trust Agreement remains in effect, the Trust (or the Trustees acting on behalf of the Trust) shall not undertake any business, activities or transaction except as expressly provided herein or contemplated hereby. In particular, the Trustees shall not (i) acquire any investments or engage in any activities not authorized by this Trust Agreement, (ii) sell, assign, transfer, exchange, mortgage, pledge, set-off or otherwise dispose of any of the Trust Property or interests therein, including to Securityholders, except as expressly provided herein, (iii) take any action that would cause the Trust to fail or cease to qualify as a "grantor trust" for United States federal income tax purposes, (iv) incur any indebtedness for borrowed money or issue any other debt, (v) take or consent to any action that would result in the placement of a Lien on any of the Trust Property, (vi) invest any proceeds received by the Trust from holding the Debentures, but shall distribute all such proceeds to Holders of Trust Securities pursuant to the terms of this Trust Agreement and of the Securities; (vii) acquire any assets other than the Trust Property, (viii) possess any power or otherwise act in such a way as to vary the Trust Property, (ix) possess any power or otherwise act in such a way as to vary the terms of the Securities in any way whatsoever (except to the extent expressly authorized in this Trust Agreement or by the terms of the Trust Securities) or (x) issue any securities or other evidences of beneficial ownership of, or beneficial interest in, the Trust other than the Trust Securities. The Administrative Trustees shall defend all claims and demands of all Persons at any time claiming any Lien on any of the Trust Property adverse to the interest of the Trust or the Securityholders in their capacity as Securityholders. (c) In connection with the issue and sale of the Capital Securities, the Depositor shall have the right and responsibility to assist the Trust with respect to, or effect on behalf of the Trust, the following (and any actions taken by the Depositor in furtherance of the following prior to the date of this Trust Agreement are hereby ratified and confirmed in all respects): (i) the preparation and filing by the Trust with the Commission and the execution on behalf of the Trust of one or more registration statements on the appropriate form in relation to the Capital Securities, including any amendments thereto;
14 (ii) the determination of the states in which to take appropriate action to qualify or register for sale all or part of the Capital Securities and the determination of any and all such acts, other than actions which must be taken by or on behalf of the Trust, and the advice to the Trustees of actions they must take on behalf of the Trust, and the preparation for execution and filing of any documents to be executed and filed by the Trust or on behalf of the Trust, as the Depositor deems necessary or advisable in order to comply with the applicable laws of any such states; (iii) the preparation for filing by the Trust and execution on behalf of the Trust of an application to the New York Stock Exchange or any other national stock exchange or the Nasdaq National Market or any other automated quotation system for listing upon notice of issuance of any Capital Securities and filing with such exchange or self-regulatory organization such notifications and documents as may be necessary from time to time to maintain such listing; (iv) the negotiation of the terms of, and the execution and delivery of, the Underwriting Agreement providing for the sale of the Capital Securities; and (v) the taking of any other actions necessary or desirable to carry out any of the foregoing activities. (d) Notwithstanding anything herein to the contrary, the Administrative Trustees are authorized and directed to conduct the affairs of the Trust and to operate the Trust so that the Trust will not be deemed to be an "investment company" required to be registered under the 1940 Act, or fail to be classified as a grantor trust for United States federal income tax purposes and so that the Debentures will be treated as indebtedness of the Depositor for United States federal income tax purposes. In this connection, the Depositor and the Administrative Trustees are authorized to take any action, not inconsistent with applicable law, the Certificate of Trust or this Trust Agreement, that each of the Depositor and any Administrative Trustee determines in its discretion to be necessary or desirable for such purposes, as long as such action does not adversely affect in any material respect the interests of the Holders of the Capital Securities. SECTION 2.8 Assets of Trust. The assets of the Trust shall consist solely of the Trust Property. SECTION 2.9 Title to Trust Property. Legal title to all Trust Property shall be vested at all times in the Property Trustee (in its capacity as such) and shall be held and administered by the Property Trustee for the benefit of the Trust and the Securityholders in accordance with this Trust Agreement.
15 ARTICLE III PAYMENT ACCOUNT SECTION 3.1 Payment Account. (a) On or prior to the Closing Date, the Property Trustee shall establish the Payment Account. The Property Trustee and any agent of the Property Trustee shall have exclusive control and sole right of withdrawal with respect to the Payment Account for the purpose of making deposits in and withdrawals from the Payment Account in accordance with this Trust Agreement. All monies and other property deposited or held from time to time in the Payment Account shall be held by the Property Trustee in the Payment Account for the exclusive benefit of the Securityholders and for distribution as herein provided, including (and subject to) any priority of payments provided for herein. (b) The Property Trustee shall deposit in the Payment Account, promptly upon receipt, all payments of principal of or interest or premium on, and any other payments or proceeds with respect to, the Debentures. Amounts held in the Payment Account shall not be invested by the Property Trustee. ARTICLE IV DISTRIBUTIONS; REDEMPTION SECTION 4.1 Distributions. (a) The Trust Securities represent undivided beneficial ownership interests in the Trust Property, and Distributions (including of Additional Amounts) will be made on the Trust Securities at the rate and on the dates that payments of interest (including of Additional Interest, as defined in the Indenture) are made on the Debentures. Accordingly: (i) Distributions on the Trust Securities shall be cumulative, and will accumulate whether or not there are funds of the Trust available for the payment of Distributions. Distributions shall accrue from January 24, 1997, and, except in the event (and to the extent) that the Depositor exercises its right to defer the payment of interest on the Debentures pursuant to the Indenture, shall be payable quarterly in arrears on February 1, May 1, August 1 and November 1 of each year, commencing on May 1, 1997. If any date on which a Distribution is otherwise payable on the Trust Securities is not a Business Day, then the payment of such Distribution shall be made on the next succeeding day that is a Business Day (and without any interest or other payment in respect of any such delay) except that, if such Business Day is in the next succeeding calendar year, payment of such Distribution shall be made on the immediately preceding Business Day, in each case with the same force and effect as if made on such date (each date on which Distributions are payable in accordance with this Section 4.1(a), a "Distribution Date"). (ii) Assuming payments of interest on the Debentures are made when due (and before giving effect to Additional Amounts, if applicable), Distributions on the Trust
16 Securities shall be payable at the rate per annum provided for in the Debentures. The amount of Distributions payable for any period shall be computed on the basis of the actual number of days in the period (which number of actual days shall include the first day but exclude the last day of such period) divided by 360. The amount of Distributions payable for any period shall include the Additional Amounts, if any. (iii) Distributions on the Trust Securities shall be made by the Property Trustee from the Payment Account and shall be payable on each Distribution Date only to the extent that the Trust has funds then on hand and available in the Payment Account for the payment of such Distributions. (b) Distributions on the Trust Securities with respect to a Distribution Date shall be payable to the Holders thereof as they appear on the Securities Register for the Trust Securities on the relevant record date, which shall be one Business Day prior to such Distribution Date; provided, however, that in the event that the Capital Securities do not remain in book-entry-only form, the relevant record date shall be the 15th day of the month prior to the relevant Distribution Date (whether or not such record date is a Business Day). SECTION 4.2 Redemption. (a) On each Debenture Redemption Date and on the Debenture Maturity Date (which shall include the Stated Maturity in the case of a Maturity Advancement (as defined in the Debentures)), the Trust will be required to redeem a Like Amount of Trust Securities at the Redemption Price. (b) Notice of redemption shall be given by the Property Trustee by first-class mail, postage prepaid, mailed not less than 30 nor more than 60 days prior to the Redemption Date to each Holder of Trust Securities to be redeemed, at such Holder's address appearing in the Security Register. All notices of redemption shall state: (i) the Redemption Date; (ii) the Redemption Price; (iii) the CUSIP number; (iv) if less than all the Outstanding Trust Securities are to be redeemed, the identification and the total Liquidation Amount of the particular Trust Securities to be redeemed; (v) that on the Redemption Date the Redemption Price will become due and payable upon each such Trust Security to be redeemed and that Distributions thereon will cease to accrue on and after said date; and (vi) if the Capital Securities are no longer in book-entry-only form, the place and address where the Holders shall surrender their Capital Securities Certificates.
17 (c) The Trust Securities redeemed on each Redemption Date shall be redeemed at the Redemption Price with the proceeds from the contemporaneous redemption or payment at Debenture Maturity Date. Redemptions of the Trust Securities shall be made and the Redemption Price shall be payable on each Redemption Date only to the extent that the Trust has funds then on hand and available in the Payment Account for the payment of such Redemption Price. (d) If the Property Trustee gives a notice of redemption in respect of any Capital Securities, then, by 12:00 noon, New York City time, on the Redemption Date, subject to Section 4.2(c), the Property Trustee will, so long as the Capital Securities are in book-entry-only form, irrevocably deposit with the Clearing Agency for the Capital Securities funds sufficient to pay the applicable Redemption Price and will give such Clearing Agency irrevocable instructions and authority to pay the Redemption Price to the Holders thereof. If the Capital Securities are no longer in book-entry-only form, the Property Trustee, subject to Section 4.2(c), will irrevocably deposit with the Paying Agent funds sufficient to pay the applicable Redemption Price and will give the Paying Agent irrevocable instructions and authority to pay the Redemption Price to the Holders thereof upon surrender of their Capital Securities Certificates. Notwithstanding the foregoing, Distributions payable on or prior to the Redemption Date for any Trust Securities called for redemption shall be payable to the Holders of such Trust Securities as they appear on the Securities Register for the Trust Securities on the relevant record dates for the related Distribution Dates. If notice of redemption shall have been given and funds deposited as required, then upon the date of such deposit, all rights of Securityholders holding Trust Securities so called for redemption will cease, except the right of such Securityholders to receive the Redemption Price and any Distribution payable on or prior to the Redemption Date, but without interest thereon, and such Trust Securities will cease to be Outstanding. In the event that any date on which any Redemption Price is payable is not a Business Day, then payment of the Redemption Price payable on such date will be made on the next succeeding day that is a Business Day (and without any interest or other payment in respect of any such delay), except that, if such Business Day falls in the next calendar year, such payment will be made on the immediately preceding Business Day, in each case, with the same force and effect as if made on such date. In the event that payment of the Redemption Price in respect of any Trust Securities called for redemption is improperly withheld or refused and not paid either by the Trust or by the Depositor pursuant to the Guarantee, Distributions on such Trust Securities will continue to accrue, at the then applicable rate, from the Redemption Date originally established by the Trust for such Trust Securities to the date such Redemption Price is actually paid, in which case the actual payment date will be the date fixed for redemption for purposes of calculating the Redemption Price. (e) Payment of the Redemption Price on the Trust Securities shall be made to the recordholders thereof as they appear on the Securities Register for the Trust Securities on the relevant record date, which shall be one Business Day prior to the relevant Redemption Date; provided, however, that in the event that the Capital Securities do not remain in book-entry-only form, the relevant record date shall be the date fifteen days prior to the relevant Redemption Date. (f) Subject to Section 4.3(a), if less than all the Outstanding Trust Securities are to be redeemed on a Redemption Date, then the aggregate Liquidation Amount of Trust Securities to be redeemed shall be allocated on a pro rata basis (based on Liquidation Amounts) among the Common Securities and the Capital Securities. The particular Capital Securities to be redeemed shall be selected on a pro rata basis (based upon Liquidation Amounts) not more than 60 days
18 prior to the Redemption Date by the Property Trustee from the Outstanding Capital Securities not previously called for redemption, by such method (including, without limitation, by lot) as the Property Trustee shall deem fair and appropriate and which may provide for the selection for redemption of portions (equal to $1,000 or an integral multiple of $1,000 in excess thereof) of the Liquidation Amount of Capital Securities of a denomination larger than $1,000. The Property Trustee shall promptly notify the Security Registrar in writing of the Capital Securities selected for redemption and, in the case of any Capital Securities selected for partial redemption, the Liquidation Amount thereof to be redeemed. For all purposes of this Trust Agreement, unless the context otherwise requires, all provisions relating to the redemption of Capital Securities shall relate, in the case of any Capital Securities redeemed or to be redeemed only in part, to the portion of the Liquidation Amount of Capital Securities that has been or is to be redeemed. SECTION 4.3 Subordination of Common Securities. (a) Payment of Distributions (including Additional Amounts, if applicable) on, and the Redemption Price of, the Trust Securities, as applicable, shall be made, subject to Section 4.2(f), pro rata among the Common Securities and the Capital Securities based on the Liquidation Amount of the Trust Securities; provided, however, that if on any Distribution Date or Redemption Date any Event of Default resulting from a Debenture Event of Default shall have occurred and be continuing, no payment of any Distribution (including Additional Amounts, if applicable) on, or Redemption Price of, any Common Security, and no other payment on account of the redemption, liquidation or other acquisition of Common Securities, shall be made unless payment in full in cash of all accumulated and unpaid Distributions (including Additional Amounts, if applicable) on all Outstanding Capital Securities for all Distribution periods terminating on or prior thereto, or in the case of payment of the Redemption Price the full amount of such Redemption Price on all Outstanding Capital Securities then called for redemption, shall have been made or provided for, and all funds immediately available to the Property Trustee shall first be applied to the payment in full in cash of all Distributions (including Additional Amounts, if applicable) on, or the Redemption Price of, Capital Securities then due and payable. (b) In the case of the occurrence of any Event of Default resulting from any Debenture Event of Default, the Holder of Common Securities will be deemed to have waived any right to act with respect to any such Event of Default under this Trust Agreement until the effect of all such Events of Default with respect to the Capital Securities have been cured, waived or otherwise eliminated. Until any such Event of Default under this Trust Agreement with respect to the Capital Securities has been so cured, waived or otherwise eliminated, the Property Trustee shall act solely on behalf of the Holders of the Capital Securities and not the Holder of the Common Securities, and only the Holders of the Capital Securities will have the right to direct the Property Trustee to act on their behalf. SECTION 4.4 Payment Procedures. Payments of Distributions (including Additional Amounts, if applicable) in respect of the Capital Securities shall be made by check mailed to the address of the Person entitled thereto as such address shall appear on the Securities Register or, if the Capital Securities are held by a Clearing Agency, such Distributions shall be made to the Clearing Agency in immediately available funds, which shall credit the relevant Persons' accounts at such Clearing Agency on the applicable Distribution Dates. Payments in respect of the Common Securities shall be made in
19 such manner as shall be mutually agreed in writing between the Property Trustee and the Common Securityholder. SECTION 4.5 Tax Returns and Reports. The Administrative Trustees shall prepare (or cause to be prepared), at the Depositor's expense, and file all United States federal, state and local tax and information returns and reports required to be filed by or in respect of the Trust. In this regard, the Administrative Trustees shall (a) prepare and file (or cause to be prepared and filed) the appropriate Internal Revenue Service Form required to be filed in respect of the Trust in each taxable year of the Trust and (b) prepare and furnish (or cause to be prepared and furnished) to each Securityholder the appropriate Internal Revenue Service form and the information required to be provided on such form. The Administrative Trustees shall provide the Depositor and the Property Trustee with a copy of all such returns and reports promptly after such filing or furnishing. The Trustees shall comply with United States federal withholding and backup withholding tax laws and information reporting requirements with respect to any payments to Securityholders under the Trust Securities. SECTION 4.6 Payment of Expenses of the Trust. Pursuant to Section 10.6 of the Indenture, the Depositor, as borrower, has agreed to pay to the Trust, and reimburse the Trust for, the full amount of any costs, expenses or liabilities of the Trust (other than obligations of the Trust to pay the Holders of any Capital Securities or other similar interests in the Trust the amounts due such Holders pursuant to the terms of the Capital Securities or such other similar interests, as the case may be), including, without limitation, any taxes, duties or other governmental charges of whatever nature (other than withholding taxes) imposed on the Trust by the United States or any other taxing authority. Such payment obligation includes any such costs, expenses or liabilities of the Trust that are required by applicable law to be satisfied in connection with a termination of the Trust. SECTION 4.7 Payments under Indenture or Pursuant to Direct Actions. Any amount payable hereunder to any Holder of Capital Securities shall be reduced by the amount of any corresponding payment such Holder (or an Owner with respect to the Holder's Capital Securities) has directly received pursuant to Section 5.8 of the Indenture or Section 5.14 of this Trust Agreement. ARTICLE V TRUST SECURITIES CERTIFICATES SECTION 5.1 Initial Ownership. Upon the creation of the Trust and the contribution by the Depositor pursuant to Section 2.3 and until the issuance of the Trust Securities, and at any time during which no Trust Securities are outstanding, the Depositor shall be the sole beneficial owner of the Trust. SECTION 5.2 The Trust Securities Certificates.
20 The Capital Securities Certificates shall be issued in minimum denominations of $1,000 Liquidation Amount and integral multiples of $1,000 in excess thereof, and the Common Securities Certificates shall be issued in denominations of $1,000 Liquidation Amount and integral multiples thereof. The Trust Securities Certificates shall be executed on behalf of the Trust by manual or facsimile signature of at least one Administrative Trustee and, if executed on behalf of the Trust by facsimile, countersigned by a transfer agent or its agent. The Capital Securities Certificates shall be authenticated by the Property Trustee by manual or facsimile signature of an authorized signatory thereof and, if executed by such authorized signatory of the Property Trustee by facsimile, countersigned by a transfer agent or its agent. Trust Securities Certificates bearing the manual signatures of individuals who were, at the time when such signatures shall have been affixed, authorized to sign on behalf of the Trust or the Property Trustee or, if executed on behalf of the Trust or the Property Trustee by facsimile, countersigned by a transfer agent or its agent, shall be validly issued and entitled to the benefits of this Trust Agreement, notwithstanding that such individuals or any of them shall have ceased to be so authorized prior to the delivery of such Trust Securities Certificates or did not hold such offices at the date of delivery of such Trust Securities Certificates. A transferee of a Trust Securities Certificate shall become a Securityholder, and shall be entitled to the rights and subject to the obligations of a Securityholder hereunder, upon due registration of such Trust Securities Certificate in such transferee's name pursuant to Sections 5.4, 5.11 and 5.13. SECTION 5.3 Execution and Delivery of Trust Securities Certificates. On the Closing Date, the Administrative Trustees shall cause Trust Securities Certificates, in an aggregate Liquidation Amount as provided in Sections 2.4 and 2.5, to be executed on behalf of the Trust and delivered to or upon the written order of the Depositor, signed by its chairman of the board, its president, any executive vice president or any vice president, treasurer or assistant treasurer or controller without further corporate action by the Depositor, in authorized denominations. SECTION 5.4 Registration of Transfer and Exchange of Capital Securities Certificates. The Depositor shall keep or cause to be kept, at the office or agency maintained pursuant to Section 5.8, a register or registers for the purpose of registering Trust Securities Certificates and transfers and exchanges of Capital Securities Certificates (the "Securities Register") in which the transfer agent and registrar designated by the Depositor (the "Securities Registrar"), subject to such reasonable regulations as it may prescribe, shall provide for the registration of Capital Securities Certificates and Common Securities Certificates (subject to Section 5.10 in the case of the Common Securities Certificates) and registration of transfers and exchanges of Capital Securities Certificates as herein provided. The Bank shall be the initial Securities Registrar. Upon surrender for registration of transfer of any Capital Securities Certificate at the office or agency maintained pursuant to Section 5.8, the Administrative Trustees or any one of them shall execute on behalf of the Trust (and if executed on behalf of the Trust by a facsimile signature, such certificate shall be countersigned by a transfer agent or its agent) and deliver, in the name of the designated transferee or transferees, one or more new Capital Securities Certificates in authorized denominations of a like aggregate Liquidation Amount dated the date of execution by such Administrative Trustee or Trustees. The Securities Registrar shall not be
21 required to register the transfer of any Capital Securities that have been called for redemption during a period beginning at the opening of business 15 days before the day of selection for such redemption. At the option of a Holder, Capital Securities Certificates may be exchanged for other Capital Securities Certificates in authorized denominations of the same class and of a like aggregate Liquidation Amount upon surrender of the Capital Securities Certificates to be exchanged at the office or agency maintained pursuant to Section 5.8. Every Capital Securities Certificate presented or surrendered for registration of transfer or exchange shall be accompanied by a written instrument of transfer in form satisfactory to an Administrative Trustee and the Securities Registrar duly executed by the Holder or his attorney duly authorized in writing. Each Capital Securities Certificate surrendered for registration of transfer or exchange shall be cancelled and subsequently disposed of by an Administrative Trustee or the Securities Registrar in accordance with such Person's customary practice. No service charge shall be made for any registration of transfer or exchange of Capital Securities Certificates, but the Securities Registrar may require payment of a sum sufficient to cover any tax or governmental charge that may be imposed in connection with any transfer or exchange of Capital Securities Certificates. SECTION 5.5 Mutilated, Destroyed, Lost or Stolen Trust Securities Certificates. If (a) any mutilated Trust Securities Certificate shall be surrendered to the Securities Registrar, or if the Securities Registrar shall receive evidence to its satisfaction of the destruction, loss or theft of any Trust Securities Certificate and (b) there shall be delivered to the Securities Registrar and the Administrative Trustees such security or indemnity as may be required by them to save each of them harmless, then in the absence of notice that such Trust Securities Certificate shall have been acquired by a bona fide purchaser, the Administrative Trustees, or any one of them, on behalf of the Trust shall execute by manual or facsimile signature and, if executed on behalf of the Trust by facsimile signature, such certificate shall be countersigned by a transfer agent, and make available for delivery, in exchange for or in lieu of any such mutilated, destroyed, lost or stolen Trust Securities Certificate, a new Trust Securities Certificate of like class, tenor and denomination. In connection with the issuance of any new Trust Securities Certificate under this Section, the Administrative Trustees or the Securities Registrar may require the payment of a sum sufficient to cover any tax or other governmental charge that may be imposed in connection therewith. Any duplicate Trust Securities Certificate issued pursuant to this Section shall constitute conclusive evidence of an undivided beneficial interest in the Trust Property, as if originally issued, whether or not the lost, stolen or destroyed Trust Securities Certificate shall be found at any time. SECTION 5.6 Persons Deemed Securityholders. The Trustees or the Securities Registrar shall treat the Person in whose name any Trust Securities Certificate shall be registered in the Securities Register as the owner of such Trust Securities Certificate for the purpose of receiving Distributions and for all other purposes whatsoever, and neither the Trustees nor the Securities Registrar shall be bound by any notice to the contrary.
22 SECTION 5.7 Access to List of Securityholders' Names and Addresses. Each Holder and each Owner shall be deemed to have agreed not to hold the Depositor, the Property Trustee or the Administrative Trustees accountable by reason of the disclosure of its name and address, regardless of the source from which such information was derived. SECTION 5.8 Maintenance of Office or Agency. The Administrative Trustees shall maintain an office or offices or agency or agencies where Capital Securities Certificates may be surrendered for registration of transfer or exchange and where notices and demands to or upon the Trustees in respect of the Trust Securities Certificates may be served. The Administrative Trustees initially designate The Bank of New York, 101 Barclay Street, Floor 21 West, New York, New York 10286, Attn: Corporate Trust Department, as its principal corporate trust office for such purposes. The Administrative Trustees shall give prompt written notice to the Depositor, the Property Trustee and to the Securityholders of any change in the location of the Securities Register or any such office or agency. SECTION 5.9 Appointment of Paying Agent. The Paying Agent shall make Distributions to Securityholders from the Payment Account and shall report the amounts of such Distributions to the Property Trustee and the Administrative Trustees. Any Paying Agent shall have the revocable power to withdraw funds from the Payment Account for the purpose of making the Distributions referred to above. The Administrative Trustees may revoke such power and remove the Paying Agent if such Trustees determine in their sole discretion that the Paying Agent shall have failed to perform its obligations under this Trust Agreement in any material respect. The Paying Agent shall initially be the Bank, and any co-paying agent chosen by the Bank, and acceptable to the Administrative Trustees and the Depositor. Any Person acting as Paying Agent shall be permitted to resign as Paying Agent upon 30 days' written notice to the Administrative Trustees, the Property Trustee and the Depositor. In the event that the Bank shall no longer be the Paying Agent or a successor Paying Agent shall resign or its authority to act be revoked, the Administrative Trustees shall appoint a successor that is acceptable to the Property Trustee and the Depositor to act as Paying Agent (which shall be a bank or trust company). The Administrative Trustees shall cause such successor Paying Agent or any additional Paying Agent appointed by the Administrative Trustees to execute and deliver to the Trustees an instrument in which such successor Paying Agent or additional Paying Agent shall agree with the Trustees that as Paying Agent, such successor Paying Agent or additional Paying Agent will hold all sums, if any, held by it for payment to the Securityholders in trust for the benefit of the Securityholders entitled thereto until such sums shall be paid to such Securityholders. The Paying Agent shall return all unclaimed funds to the Property Trustee and upon resignation or removal of a Paying Agent such Paying Agent shall also return all funds in its possession to the Property Trustee. The provisions of Sections 8.1, 8.3 and 8.6 herein shall apply to the Bank also in its role as Paying Agent, for so long as the Bank shall act as Paying Agent and, to the extent applicable, to any other paying agent appointed hereunder, and any Paying Agent shall be bound by the requirements with respect to paying agents of securities issued pursuant to the Trust Indenture Act. Any reference in this Agreement to the Paying Agent shall include any co-paying agent unless the context requires otherwise.
23 SECTION 5.10 Ownership of Common Securities by Depositor. On the Closing Date, the Depositor shall acquire and retain beneficial and record ownership of the Common Securities. To the fullest extent permitted by law, other than a transfer in connection with a consolidation or merger of the Depositor into another Person, or any conveyance, transfer or lease by the Depositor of its properties and assets substantially as an entirety to any Person, pursuant to Section 8.1 of the Indenture, any attempted transfer of the Common Securities shall be void. The Administrative Trustees shall cause each Common Securities Certificate issued to the Depositor to contain a legend stating "THIS CERTIFICATE IS NOT TRANSFERABLE TO ANY PERSON". SECTION 5.11 Book-Entry Capital Securities Certificates; Common Securities Certificate. (a) The Capital Securities Certificates, upon original issuance, will be issued in the form of a typewritten Capital Securities Certificate or Certificates representing Book-Entry Capital Securities Certificates, to be delivered to The Depository Trust Company, the initial Clearing Agency, by, or on behalf of, the Trust. Such Capital Securities Certificate or Certificates shall initially be registered on the Securities Register in the name of Cede & Co., the nominee of the initial Clearing Agency, and no Owner will receive a Definitive Capital Securities Certificate representing such Owner's interest in such Capital Securities, except as provided in Section 5.13. Unless and until Definitive Capital Securities Certificates have been issued to Owners pursuant to Section 5.13: (i) the provisions of this Section 5.11(a) shall be in full force and effect; (ii) the Securities Registrar and the Trustees shall be entitled to deal with the Clearing Agency for all purposes of this Trust Agreement relating to the Book-Entry Capital Securities Certificates (including the payment of the Liquidation Amount of and Distributions on the Capital Securities evidenced by Book-Entry Capital Securities Certificates and the giving of instructions or directions to Owners of Capital Securities evidenced by Book-Entry Capital Securities Certificates) as the sole Holder of Capital Securities evidenced by Book-Entry Capital Securities Certificates and shall have no obligations to the Owners thereof; (iii) to the extent that the provisions of this Section 5.11 conflict with any other provisions of this Trust Agreement, the provisions of this Section 5.11 shall control; and (iv) the rights of the Owners of the Book-Entry Capital Securities Certificates shall be exercised only through the Clearing Agency and shall be limited to those established by law and agreements between such Owners and the Clearing Agency and/or the Clearing Agency Participants. Pursuant to the Certificate Depository Agreement, unless and until Definitive Capital Securities Certificates are issued pursuant to Section 5.13, the initial Clearing Agency will make book-entry transfers among the Clearing Agency Participants and receive and transmit payments on the Capital Securities to such Clearing Agency Participants.
24 (b) A single Common Securities Certificate representing the Common Securities shall be issued to the Depositor in the form of a definitive Common Securities Certificate. SECTION 5.12 Notices to Clearing Agency. To the extent that a notice or other communication to the Owners is required under this Trust Agreement, unless and until Definitive Capital Securities Certificates shall have been issued to Owners pursuant to Section 5.13, the Trustees shall give all such notices and communications specified herein to be given to Owners to the Clearing Agency, and shall have no obligations to the Owners. SECTION 5.13 Definitive Capital Securities Certificates. If (a) the Depositor advises the Trustees in writing that the Clearing Agency is no longer willing or able to properly discharge its responsibilities with respect to the Capital Securities Certificates, and the Depositor is unable to locate a qualified successor, (b) the Depositor at its option advises the Trustees in writing that it elects to terminate the book-entry system through the Clearing Agency or (c) after the occurrence of a Debenture Event of Default, Owners of Capital Securities Certificates representing beneficial interests aggregating at least a majority of the Liquidation Amount advise the Administrative Trustees in writing that the continuation of a book-entry system through the Clearing Agency is no longer in the best interest of the Owners of Capital Securities Certificates, then the Administrative Trustees shall notify other Trustees and the Clearing Agency, and the Clearing Agency, in accordance with its customary rules and procedures, shall notify all Clearing Agency Participants for whom it holds Capital Securities of the occurrence of any such event and of the availability of the Definitive Capital Securities Certificates to Owners of such class or classes, as applicable, requesting the same. Upon surrender to the Administrative Trustees of the typewritten Capital Securities Certificate or Certificates representing the Book-Entry Capital Securities Certificates by the Clearing Agency, accompanied by registration instructions, the Administrative Trustees, or any one of them, shall execute the Definitive Capital Securities Certificates in accordance with the instructions of the Clearing Agency or, if executed on behalf of the Trust by facsimile, countersigned by a transfer agent or its agent. Neither the Securities Registrar nor the Trustees shall be liable for any delay in delivery of such instructions and may conclusively rely on, and shall be protected in relying on, such instructions. Upon the issuance of Definitive Capital Securities Certificates, the Trustees shall recognize the Holders of the Definitive Capital Securities Certificates as Securityholders. The Definitive Capital Securities Certificates shall be typewritten, printed, lithographed or engraved or may be produced in any other manner as is reasonably acceptable to the Administrative Trustees that meets the requirements of any stock exchange or automated quotation system on which the Capital Securities are then listed or approved for trading, as evidenced by the execution thereof by the Administrative Trustees or any one of them. SECTION 5.14 Rights of Securityholders. (a) The legal title to the Trust Property is vested exclusively in the Property Trustee (in its capacity as such) in accordance with Section 2.9, and the Securityholders shall not have any right or title therein other than the undivided beneficial ownership interest in the assets of the Trust conferred by their Trust Securities and they shall have no right to call for any partition or division of property, profits or rights of the Trust except as described below. The Trust Securities shall be
25 personal property giving only the rights specifically set forth therein and in this Trust Agreement. The Trust Securities shall have no preemptive or similar rights and when issued and delivered to Securityholders against payment of the purchase price therefor will be fully paid and nonassessable by the Trust. The Holders of the Capital Securities, in their capacities as such, shall be entitled to the same limitation of personal liability extended to stockholders of private corporations for profit organized under the General Corporation Law of the State of Delaware. (b) For so long as any Capital Securities remain Outstanding, if, upon a Debenture Event of Default, the Debenture Trustee fails or the holders of not less than 25% in principal amount of the outstanding Debentures fail to declare the principal of all of the Debentures to be immediately due and payable, the Holders of at least 25% in Liquidation Amount of the Capital Securities then Outstanding shall have such right by a notice in writing to the Depositor and the Debenture Trustee; and upon any such declaration such principal amount of and the accrued interest on all of the Debentures shall become immediately due and payable as set forth in the Indenture, provided that the payment of principal and interest on such Debentures shall remain subordinated to the extent provided in the Indenture. At any time after such a declaration of acceleration with respect to the Debentures has been made and before a judgment or decree for payment of the money due has been obtained by the Debenture Trustee as in the Indenture provided, the Holders of a majority in Liquidation Amount of the Capital Securities, by written notice to the Property Trustee, the Depositor and the Debenture Trustee, may rescind and annul such declaration and its consequences if: (i) the Depositor has paid or deposited with the Debenture Trustee a sum sufficient to pay (A) all overdue installments of interest (including any Additional Interest (as defined in the Indenture)) on all of the Debentures, (B) the principal of any Debentures which have become due otherwise than by such declaration of acceleration and interest thereon at the rate borne by the Debentures, and (C) all sums paid or advanced by the Debenture Trustee under the Indenture and the reasonable compensation, expenses, disbursements and advances of the Debenture Trustee and the Property Trustee, their agents and counsel; and (ii) all Events of Default with respect to the Debentures, other than the non-payment of the principal of the Debentures which has become due solely by such acceleration, have been cured or waived as provided in Section 5.13 of the Indenture. The holders of a majority in aggregate Liquidation Amount of the Capital Securities may, on behalf of the Holders of all the Capital Securities, waive any past default under the Indenture, except a default in the payment of principal or interest (unless all Events of Default with respect to the Debentures, other than the non-payment of the principal of the Debentures which has become due solely by such acceleration, have been cured or annulled as provided in Section 5.3 of the Indenture and the Company has paid or deposited with the Debenture Trustee a sum sufficient to pay all overdue installments of interest (including any Additional Interest (as defined in the
26 Indenture)) on the Debentures, the principal of any Debentures which have become due otherwise than by such declaration of acceleration and interest thereon at the rate borne by the Debentures, and all sums paid or advanced by the Debenture Trustee under the Indenture and the reasonable compensation, expenses, disbursements and advances of the Debenture Trustee and the Property trustee, their agents and counsel) or a default in respect of a covenant or provision which under the Indenture cannot be modified or amended without the consent of the holder of each outstanding Debenture. No such rescission shall affect any subsequent default or impair any right consequent thereon. Upon receipt by the Property Trustee of written notice declaring such an acceleration, or rescission and annulment thereof, by Holders of the Capital Securities all or part of which is represented by Book-Entry Capital Securities Certificates, a record date shall be established for determining Holders of Outstanding Capital Securities entitled to join in such notice, which record date shall be at the close of business on the day the Property Trustee receives such notice. The Holders of Outstanding Capital Securities on such record date, or their duly designated proxies, and only such Persons, shall be entitled to join in such notice, whether or not such Holders remain Holders after such record date; provided, that, unless such declaration of acceleration, or rescission and annulment, as the case may be, shall have become effective by virtue of the requisite percentage having joined in such notice prior to the day which is 90 days after such record date, such notice of declaration of acceleration, or rescission and annulment, as the case may be, shall automatically and without further action by any Holder be canceled and of no further effect. Nothing in this paragraph shall prevent a Holder, or a proxy of a Holder, from giving, after expiration of such 90-day period, a new written notice of declaration of acceleration, or rescission and annulment thereof, as the case may be, that is identical to a written notice which has been canceled pursuant to the proviso to the preceding sentence, in which event a new record date shall be established pursuant to the provisions of this Section 5.14(b). (c) For so long as any Capital Securities remain Outstanding, to the fullest extent permitted by law and subject to the terms of this Trust Agreement and the Indenture, upon a Debenture Event of Default specified in Section 5.1(1) or 5.1(2) of the Indenture, any Holder of Capital Securities shall have the right to institute a proceeding directly against the Depositor, pursuant to Section 5.8 of the Indenture, for enforcement of payment to such Holder of the principal amount of or interest on Debentures having a principal amount equal to the Liquidation Amount of the Capital Securities of such Holder (a "Direct Action"). Except as set forth in Section 5.14(b) and this Section 5.14(c), the Holders of Capital Securities shall have no right to exercise directly any right or remedy available to the holders of, or in respect of, the Debentures. SECTION 5.15 CUSIP Numbers. The Administrative Trustees in issuing the Capital Securities may use "CUSIP" numbers (if then generally in use), and, if so, the Property Trustee shall use "CUSIP" numbers in notices of redemption as a convenience to Holders; provided that any such notice may state that no representation is made as to the correctness of such numbers either as printed on the Capital Securities or as contained in any notice of a redemption and that reliance may be placed only on the other identification numbers printed on the Capital Securities, and any such redemption shall not be affected by any defect in or omission of such numbers. The Administrative Trustees will promptly notify the Property Trustee of any change in the CUSIP numbers.
27 ARTICLE VI ACTS OF SECURITYHOLDERS; MEETINGS; VOTING SECTION 6.1 Limitations on Voting Rights. (a) Except as provided in this Section, in Sections 5.14, 8.10 and 10.3 and in the Indenture and as otherwise required by law, no Holder of Capital Securities shall have any right to vote or in any manner otherwise control the administration, operation and management of the Trust or the obligations of the parties hereto, nor shall anything herein set forth, or contained in the terms of the Trust Securities Certificates, be construed so as to constitute the Securityholders from time to time as partners or members of an association. (b) So long as any Debentures are held by the Property Trustee, the Trustees shall not (i) direct the time, method and place of conducting any proceeding for any remedy available to the Debenture Trustee, or executing any trust or power conferred on the Debenture Trustee with respect to such Debentures, (ii) waive any past default which is waiveable under Section 5.13 of the Indenture, (iii) exercise any right to rescind or annul a declaration that the principal of all the Debentures shall be due and payable or (iv) consent to any amendment, modification or termination of the Indenture or the Debentures, where such consent shall be required, without, in each case, obtaining the prior approval of the Holders of at least a majority in Liquidation Amount of all Outstanding Capital Securities, provided, however, that where a consent under the Indenture would require the consent of each holder of Debentures affected thereby, no such consent shall be given by the Property Trustee without the prior written consent of each Holder of Capital Securities. The Trustees shall not revoke any action previously authorized or approved by a vote of the Holders of Capital Securities, except by a subsequent vote of the Holders of Capital Securities. The Property Trustee shall notify all Holders of the Capital Securities of any notice of default received from the Debenture Trustee with respect to the Debentures. In addition to obtaining the foregoing approvals of the Holders of the Capital Securities, prior to taking any of the foregoing actions, the Administrative Trustees shall, at the expense of the Depositor, obtain an Opinion of Counsel experienced in such matters to the effect that such action shall not cause the Trust to fail to be classified as a grantor trust for United States federal income tax purposes. (c) If any proposed amendment to the Trust Agreement provides for, or the Trustees otherwise propose to effect, (i) any action that would adversely affect in any material respect the powers, preferences or special rights of the Capital Securities, whether by way of amendment to the Trust Agreement or otherwise, or (ii) the dissolution, winding-up or termination of the Trust, other than pursuant to the terms of this Trust Agreement, then the Holders of Outstanding Capital Securities as a class will be entitled to vote on such amendment or proposal and such amendment or proposal shall not be effective except with the approval of the Holders of at least a majority in Liquidation Amount of the Outstanding Capital Securities. Notwithstanding any other provision of this Trust Agreement, no amendment to this Trust Agreement may be made if, as a result of such amendment, it would cause the Trust to fail to be classified as a grantor trust for United States federal income tax purposes. SECTION 6.2 Notice of Meetings.
28 Notice of all meetings of the Capital Securityholders, stating the time, place and purpose of the meeting, shall be given by the Property Trustee pursuant to Section 10.9 to each Capital Securityholder of record, at his registered address, at least 15 days and not more than 90 days before the meeting. At any such meeting, any business properly before the meeting may be so considered whether or not stated in the notice of the meeting. Any adjourned meeting may be held as adjourned without further notice. SECTION 6.3 Meetings of Capital Securityholders. No annual meeting of Securityholders is required to be held. The Administrative Trustees, however, shall call a meeting of Capital Securityholders to vote on any matter upon the written request of the Capital Securityholders of record of 25% of the Outstanding Capital Securities (based upon their Liquidation Amount) and the Administrative Trustees or the Property Trustee may, at any time in their discretion, call a meeting of Capital Securityholders to vote on any matters as to which Capital Securityholders are entitled to vote. Capital Securityholders of record of 50% of the Outstanding Capital Securities (based upon their Liquidation Amount), present in person or by proxy, shall constitute a quorum at any meeting of Capital Securityholders. If a quorum is present at a meeting, an affirmative vote by the Capital Securityholders of record present, in person or by proxy, holding more than a majority of the Outstanding Capital Securities (based upon their Liquidation Amount) held by holders of record of Outstanding Capital Securities present, either in person or by proxy, at such meeting shall constitute the action of the Capital Securityholders, unless this Trust Agreement requires a greater number of affirmative votes. SECTION 6.4 Voting Rights. Securityholders shall be entitled to one vote for each $1,000 of Liquidation Amount represented by their Trust Securities in respect of any matter as to which such Securityholders are entitled to vote. SECTION 6.5 Proxies, etc. At any meeting of Securityholders, any Securityholder entitled to vote thereat may vote by proxy, provided that no proxy shall be voted at any meeting unless it shall have been placed on file with the Administrative Trustees, or with such other officer or agent of the Trust as the Administrative Trustees may direct, for verification prior to the time at which such vote shall be taken. Pursuant to a resolution of the Property Trustee, proxies may be solicited in the name of the Property Trustee or one or more officers of the Property Trustee. Only Securityholders of record shall be entitled to vote. When Trust Securities are held jointly by several Persons, any one of them may vote at any meeting in person or by proxy in respect of such Trust Securities, but if more than one of them shall be present at such meeting in person or by proxy, and such joint owners or their proxies so present disagree as to any vote to be cast, such vote shall not be received in respect of such Trust Securities. A proxy purporting to be executed by or on behalf of a Securityholder shall be deemed valid unless challenged at or prior to its exercise, and the burden
29 of proving invalidity shall rest on the challenger. No proxy shall be valid more than three years after its date of execution. SECTION 6.6 Securityholder Action by Written Consent. Any action which may be taken by Securityholders at a meeting may be taken without a meeting if Securityholders holding more than a majority of all Outstanding Trust Securities (based upon their Liquidation Amount) entitled to vote in respect of such action (or such larger proportion thereof as shall be required by any express provision of this Trust Agreement) shall consent to the action in writing. SECTION 6.7 Record Date for Voting and Other Purposes. For the purposes of determining the Securityholders who are entitled to notice of and to vote at any meeting or by written consent, or to participate in any Distribution on the Trust Securities in respect of which a record date is not otherwise provided for in this Trust Agreement, or for the purpose of any other action, the Administrative Trustees may from time to time fix a date, not more than 90 days prior to the date of any meeting of Securityholders or the payment of a Distribution or other action, as the case may be, as a record date for the determination of the identity of the Securityholders of record for such purposes. SECTION 6.8 Acts of Securityholders. Any request, demand, authorization, direction, notice, consent, waiver or other action provided or permitted by this Trust Agreement to be given, made or taken by Securityholders or Owners may be embodied in and evidenced by one or more instruments of substantially similar tenor signed by such Securityholders or Owners in person or by an agent duly appointed in writing; and, except as otherwise expressly provided herein, such action shall become effective when such instrument or instruments are delivered to an Administrative Trustee. Such instrument or instruments (and the action embodied therein and evidenced thereby) are herein sometimes referred to as the "Act" of the Securityholders or Owners signing such instrument or instruments. Proof of execution of any such instrument or of a writing appointing any such agent shall be sufficient for any purpose of this Trust Agreement and (subject to Section 8.1) conclusive in favor of the Trustees, if made in the manner provided in this Section. The fact and date of the execution by any Person of any such instrument or writing may be proved by the affidavit of a witness of such execution or by a certificate of a notary public or other officer authorized by law to take acknowledgments of deeds, certifying that the individual signing such instrument or writing acknowledged to him the execution thereof. Where such execution is by a signer acting in a capacity other than his individual capacity, such certificate or affidavit shall also constitute sufficient proof of his authority. The fact and date of the execution of any such instrument or writing, or the authority of the Person executing the same, may also be proved in any other manner which any Trustee receiving the same deems sufficient. The ownership of Capital Securities shall be proved by the Securities Register. Any request, demand, authorization, direction, notice, consent, waiver or other Act of the Securityholder of any Trust Security shall bind every future Securityholder of the same Trust
30 Security and the Securityholder of every Trust Security issued upon the registration of transfer thereof or in exchange therefor or in lieu thereof in respect of anything done, omitted or suffered to be done by the Trustees or the Trust in reliance thereon, whether or not notation of such action is made upon such Trust Security. Without limiting the foregoing, a Securityholder entitled hereunder to take any action hereunder with regard to any particular Trust Security may do so with regard to all or any part of the Liquidation Amount of such Trust Security or by one or more duly appointed agents each of which may do so pursuant to such appointment with regard to all or any part of such Liquidation Amount. If any dispute shall arise between the Securityholders and the Administrative Trustees or among such Securityholders or Trustees with respect to the authenticity, validity or binding nature of any request, demand, authorization, direction, consent, waiver or other Act of such Securityholder or Trustee under this Article VI, then the determination of such matter by the Property Trustee shall be conclusive with respect to such matter. SECTION 6.9 Inspection of Records. Upon reasonable notice to the Administrative Trustees and the Property Trustee, the records of the Trust shall be open to inspection by Securityholders during normal business hours for any purpose reasonably related to such Securityholder's interest as a Securityholder. ARTICLE VII REPRESENTATIONS AND WARRANTIES SECTION 7.1 Representations and Warranties of the Property Trustee and the Delaware Trustee. The Property Trustee and the Delaware Trustee, each severally on behalf of and as to itself, hereby represents and warrants for the benefit of the Depositor and the Securityholders that: (a) the Property Trustee is a New York banking corporation duly organized, validly existing and in good standing under the laws of the State of New York; (b) the Property Trustee has full corporate power, authority and legal right to execute, deliver and perform its obligations under this Trust Agreement and has taken all necessary action to authorize the execution, delivery and performance by it of this Trust Agreement; (c) the Delaware Trustee is a Delaware banking corporation duly organized, validly existing and in good standing in the State of Delaware; (d) the Delaware Trustee has full corporate power, authority and legal right to execute, deliver and perform its obligations under this Trust Agreement and has taken all necessary action to authorize the execution, delivery and performance by it of this Trust Agreement;
31 (e) this Trust Agreement has been duly authorized, executed and delivered by the Property Trustee and the Delaware Trustee and constitutes the valid and legally binding agreement of each of the Property Trustee and the Delaware Trustee enforceable against each of them in accordance with its terms, subject to bankruptcy, insolvency, fraudulent transfer, reorganization, moratorium and similar laws of general applicability relating to or affecting creditors' rights and to general equity principles; (f) the execution, delivery and performance of this Trust Agreement has been duly authorized by all necessary corporate or other action on the part of the Property Trustee and the Delaware Trustee and does not require any approval of stockholders of the Property Trustee and the Delaware Trustee and such execution, delivery and performance will not (i) violate the charter or by-laws of the Property Trustee or the Delaware Trustee, (ii) violate any provision of, or constitute, with or without notice or lapse of time, a default under, or result in the creation or imposition of, any Lien on any properties included in the Trust Property pursuant to the provisions of, any indenture, mortgage, credit agreement, license or other agreement or instrument to which the Property Trustee or the Delaware Trustee is a party or by which it is bound, or (iii) violate any law, governmental rule or regulation of the State of New York or the State of Delaware, as the case may be, governing the banking, trust or general powers of the Property Trustee or the Delaware Trustee (as appropriate in context) or any order, judgment or decree applicable to the Property Trustee or the Delaware Trustee; (g) neither the authorization, execution or delivery by the Property Trustee or the Delaware Trustee of this Trust Agreement nor the consummation of any of the transactions by the Property Trustee or the Delaware Trustee (as appropriate in context) contemplated herein or therein requires the consent or approval of, the giving of notice to, the registration with or the taking of any other action with respect to any governmental authority or agency under any existing New York or Delaware law governing the banking, trust or general powers of the Property Trustee or the Delaware Trustee, as the case may be; and (h) there are no proceedings pending or, to the best of each of the Property Trustee's and the Delaware Trustee's knowledge, threatened against or affecting the Property Trustee or the Delaware Trustee in any court or before any governmental authority, agency or arbitration board or tribunal which, individually or in the aggregate, would materially and adversely affect the Trust or would question the right, power and authority of the Property Trustee or the Delaware Trustee, as the case may be, to enter into or perform its obligations as one of the Trustees under this Trust Agreement. SECTION 7.2 Representations and Warranties of Depositor. The Depositor hereby represents and warrants for the benefit of the Securityholders that: (a) the Trust Securities Certificates issued at the Closing Date on behalf of the Trust have been duly authorized and will have been, duly and validly executed, issued and delivered by the Trustees pursuant to the terms and provisions of, and in accordance with the requirements of, this Trust Agreement and the Securityholders will be, as of such date, entitled to the benefits of this Trust Agreement; and
32 (b) there are no taxes, fees or other governmental charges payable by the Trust (or the Trustees on behalf of the Trust) under the laws of the State of Delaware or any political subdivision thereof in connection with the execution, delivery and performance by the Property Trustee or the Delaware Trustee, as the case may be, of this Trust Agreement. ARTICLE VIII THE TRUSTEES SECTION 8.1 Certain Duties and Responsibilities. (a) The duties and responsibilities of the Trustees shall be as provided by this Trust Agreement and, in the case of the Property Trustee, by the Trust Indenture Act. Notwithstanding the foregoing, no provision of this Trust Agreement shall require the Trustees to expend or risk their own funds or otherwise incur any financial liability in the performance of any of their duties hereunder, or in the exercise of any of their rights or powers, if they shall have reasonable grounds for believing that repayment of such funds or adequate indemnity against such risk or liability is not reasonably assured to them. Whether or not therein expressly so provided, every provision of this Trust Agreement relating to the conduct or affecting the liability of or affording protection to the Trustees shall be subject to the provisions of this Section. Nothing in this Trust Agreement shall be construed to release an Administrative Trustee from liability for its own gross negligent action, its own gross negligent failure to act, or its own willful misconduct. To the extent that, at law or in equity, an Administrative Trustee has duties (including fiduciary duties) and liabilities relating thereto to the Trust or to the Securityholders, such Administrative Trustee shall not be liable to the Trust or to any Securityholder for such Trustee's good faith reliance on the provisions of this Trust Agreement. The provisions of this Trust Agreement, to the extent that they restrict the duties and liabilities of the Administrative Trustees otherwise existing at law or in equity, are agreed by the Depositor and the Securityholders to replace such other duties and liabilities of the Administrative Trustees. (b) All payments made by the Property Trustee or a Paying Agent in respect of the Trust Securities shall be made only from the revenue and proceeds from the Trust Property and only to the extent that there shall be sufficient revenue or proceeds from the Trust Property to enable the Property Trustee or a Paying Agent to make payments in accordance with the terms hereof. Each Securityholder, by its acceptance of a Trust Security, agrees that it will look solely to the revenue and proceeds from the Trust Property to the extent legally available for distribution to it as herein provided and that the Trustees are not personally liable to it for any amount distributable in respect of any Trust Security or for any other liability in respect of any Trust Security. This Section 8.1(b) does not limit the liability of the Trustees expressly set forth elsewhere in this Trust Agreement or, in the case of the Property Trustee, in the Trust Indenture Act. (c) No provision of this Trust Agreement shall be construed to relieve the Property Trustee from liability for its own negligent action, its own negligent failure to act, or its own willful misconduct, except that:
33 (i) the Property Trustee shall not be liable for any error of judgment made in good faith by an authorized officer of the Property Trustee, unless it shall be proved that the Property Trustee was negligent in ascertaining the pertinent facts; (ii) the Property Trustee shall not be liable with respect to any action taken or omitted to be taken by it in good faith in accordance with the direction of the Holders of not less than a majority in Liquidation Amount of the Trust Securities relating to the time, method and place of conducting any proceeding for any remedy available to the Property Trustee, or exercising any trust or power conferred upon the Property Trustee under this Trust Agreement; (iii) the Property Trustee's sole duty with respect to the custody, safe keeping and physical preservation of the Debentures and the Payment Account shall be to deal with such property in a similar manner as the Property Trustee deals with similar property for its own account, subject to the protections and limitations on liability afforded to the Property Trustee under this Trust Agreement and the Trust Indenture Act; (iv) the Property Trustee shall not be liable for any interest on any money received by it except as it may otherwise agree in writing with the Depositor; and money held by the Property Trustee need not be segregated from other funds held by it except in relation to the Payment Account maintained by the Property Trustee pursuant to Section 3.1 and except to the extent otherwise required by law; and (v) the Property Trustee shall not be responsible for monitoring the compliance by the Administrative Trustees or the Depositor with their respective duties under this Trust Agreement, nor shall the Property Trustee be liable for the default or misconduct of the Administrative Trustees or the Depositor. SECTION 8.2 Certain Notices. Within ten Business Days after the occurrence of any Event of Default actually known to the Property Trustee, the Property Trustee shall transmit, in the manner and to the extent provided in Section 10.9, notice of such Event of Default to the Securityholders, the Administrative Trustees and the Depositor, unless such Event of Default shall have been cured or waived. Within five Business Days after the receipt of notice of the Depositor's exercise of its right to defer the payment of interest on the Debentures pursuant to the Indenture, the Administrative Trustee shall transmit, in the manner and to the extent provided in Section 10.9, notice of such exercise to the Securityholders and the Property Trustee, unless such exercise shall have been revoked. SECTION 8.3 Certain Rights of Property Trustee. Subject to the provisions of Section 8.1: (a) the Property Trustee may rely and shall be protected in acting or refraining from acting in good faith upon any resolution, Opinion of Counsel, certificate, written representation of a
34 Holder or transferee, certificate of auditors or any other certificate, statement, instrument, opinion, report, notice, request, consent, order, appraisal, bond, debenture, note, other evidence of indebtedness or other paper or document believed by it to be genuine and to have been signed or presented by the proper party or parties; (b) if (i) in performing its duties under this Trust Agreement the Property Trustee is required to decide between alternative courses of action or (ii) in construing any of the provisions of this Trust Agreement the Property Trustee finds the same ambiguous or inconsistent with any other provisions contained herein or (iii) the Property Trustee is unsure of the application of any provision of this Trust Agreement, then, except as to any matter as to which the Capital Securityholders are entitled to vote under the terms of this Trust Agreement, the Property Trustee shall deliver a notice to the Depositor requesting written instructions of the Depositor as to the course of action to be taken and the Property Trustee shall take such action, or refrain from taking such action, as the Property Trustee shall be instructed in writing to take, or to refrain from taking, by the Depositor; provided, however, that if the Property Trustee does not receive such instructions of the Depositor within ten Business Days after it has delivered such notice, or such reasonably shorter period of time set forth in such notice (which to the extent practicable shall not be less than two Business Days), it may, but shall be under no duty to, take or refrain from taking such action not inconsistent with this Trust Agreement as it shall deem advisable and in the best interests of the Securityholders, in which event the Property Trustee shall have no liability except for its own bad faith, negligence or willful misconduct; (c) any direction or act of the Depositor or the Administrative Trustees contemplated by this Trust Agreement shall be sufficiently evidenced by an Officers' Certificate; (d) whenever in the administration of this Trust Agreement, the Property Trustee shall deem it desirable that a matter be established before undertaking, suffering or omitting any action hereunder, the Property Trustee (unless other evidence is herein specifically prescribed) may, in the absence of bad faith on its part, request and rely upon an Officers' Certificate which, upon receipt of such request, shall be promptly delivered by the Depositor or the Administrative Trustees; (e) the Property Trustee shall have no duty to see to any recording, filing or registration of any instrument (including any financing or continuation statement or any filing under tax or securities laws) or any rerecording, refiling or reregistration thereof; (f) the Property Trustee may consult with counsel of its selection (which counsel may be counsel to the Depositor or any of its Affiliates, and may include any of its employees) and the advice of such counsel shall be full and complete authorization and protection in respect of any action taken, suffered or omitted by it hereunder in good faith and in reliance thereon and in accordance with such advice, such counsel may be counsel to the Depositor or any of its Affiliates, and may include any of its employees; the Property Trustee shall have the right at any time to seek instructions concerning the administration of this Trust Agreement from any court of competent jurisdiction; (g) the Property Trustee shall be under no obligation to exercise any of the rights or powers vested in it by this Trust Agreement at the request or direction of any of the Securityholders pursuant to this Trust Agreement, unless such Securityholders shall have offered
35 to the Property Trustee reasonable security or indemnity against the costs, expenses and liabilities which might be incurred by it in compliance with such request or direction; (h) the Property Trustee shall not be bound to make any investigation into the facts or matters stated in any resolution, certificate, statement, instrument, opinion, report, notice, request, consent, order, approval, bond, debenture, note or other evidence of indebtedness or other paper or document, unless requested in writing to do so by one or more Securityholders, but the Property Trustee may make such further inquiry or investigation into such facts or matters as it may see fit; (i) the Property Trustee may execute any of the trusts or powers hereunder or perform any duties hereunder either directly or by or through its agents or attorneys, provided that the Property Trustee shall be responsible for its own negligence or recklessness with respect to selection of any agent or attorney appointed by it hereunder; (j) whenever in the administration of this Trust Agreement the Property Trustee shall deem it desirable to receive written instructions with respect to enforcing any remedy or right or taking any other action hereunder the Property Trustee (i) may request written instructions from the Holders of the Trust Securities which written instructions may only be given by the Holders of the same proportion in Liquidation Amount of the Trust Securities as would be entitled to direct the Property Trustee under the terms of the Trust Securities in respect of such remedy, right or action, (ii) may refrain from enforcing such remedy or right or taking such other action until such written instructions are received, and (iii) shall be protected in acting in accordance with such written instructions; and (k) except as otherwise expressly provided by this Trust Agreement, the Property Trustee shall not be under any obligation to take any action that is discretionary under the provisions of this Trust Agreement. No provision of this Trust Agreement shall be deemed to impose any duty or obligation on the Property Trustee to perform any act or acts or exercise any right, power, duty or obligation conferred or imposed on it, in any jurisdiction in which it shall be illegal, or in which the Property Trustee shall be unqualified or incompetent in accordance with applicable law, to perform any such act or acts, or to exercise any such right, power, duty or obligation. No permissive power or authority available to the Property Trustee shall be construed to be a duty. SECTION 8.4 Not Responsible for Recitals or Issuance of Securities. The recitals contained herein and in the Trust Securities Certificates shall be taken as the statements of the Trust, and the Trustees do not assume any responsibility for their correctness. The Trustees shall not be accountable for the use or application by the Depositor of the proceeds of the Debentures. SECTION 8.5 May Hold Securities. Any Trustee or any other agent of any Trustee or the Trust, in its individual or any other capacity, may become the owner or pledgee of Trust Securities and, subject to Sections 8.8 and
36 8.13, except as provided in the definition of the term "Outstanding" in Article I, may otherwise deal with the Trust with the same rights it would have if it were not a Trustee or such other agent. SECTION 8.6 Compensation; Indemnity; Fees. Pursuant to Section 10.6 of the Indenture, the Depositor, as borrower, agrees: (a) to pay to the Trustees from time to time such compensation as shall be agreed in writing with the Depositor for all services rendered by them hereunder (which compensation shall not be limited by any provision of law in regard to the compensation of a trustee of an express trust); (b) except as otherwise expressly provided herein, to reimburse the Trustees upon request for all reasonable expenses, disbursements and advances incurred or made by the Trustees in accordance with any provision of this Trust Agreement (including the reasonable compensation and the expenses and disbursements of its agents and counsel), except any such expense, disbursement or advance as may be attributable to its negligence or bad faith; and (c) to the fullest extent permitted by applicable law, to indemnify and hold harmless (i) each Trustee, (ii) any Affiliate of any Trustee, (iii) any officer, director, shareholder, employee, representative or agent of any Trustee, and (iv) any employee or agent of the Trust or its Affiliates, (referred to herein as an "Indemnified Person") from and against any and all loss, damage, liability, tax, penalty, expense or claim of any kind or nature whatsoever incurred by such Indemnified Person by reason of the creation, operation or termination of the Trust or any act or omission performed or omitted by such Indemnified Person in good faith on behalf of the Trust and in a manner such Indemnified Person reasonably believed to be within the scope of authority conferred on such Indemnified Person by this Trust Agreement, except that no Indemnified Person shall be entitled to be indemnified in respect of any loss, damage or claim incurred by such Indemnified Person by reason of negligence or willful misconduct with respect to such acts or omissions. When the Property Trustee incurs expenses or renders services in connection with an Event of Default specified in Section 5.1(4) or Section 5.1(5) of the Indenture, the expenses (including the reasonable charges and expenses of its counsel) and the compensation for the services are intended to constitute expenses of administration under any applicable federal or state bankruptcy, insolvency or other similar law. The provisions of this Section 8.6 shall survive the termination of this Trust Agreement. No Trustee may claim any lien or charge on any Trust Property as a result of any amount due pursuant to this Section 8.6. The Depositor and any Trustee (in the case of the Property Trustee, subject to Section 8.8 hereof) may engage in or possess an interest in other business ventures of any nature or description, independently or with others, similar or dissimilar to the business of the Trust, and the Trust and the Holders of Trust Securities shall have no rights by virtue of this Trust Agreement in and to such independent ventures or the income or profits derived therefrom, and the pursuit of any such venture, even if competitive with the business of the Trust, shall not be deemed wrongful or improper. Neither the Depositor, nor any Trustee, shall be obligated to present any particular investment or other opportunity to the Trust even if such opportunity is of a character that, if
37 presented to the Trust, could be taken by the Trust, and the Depositor or any Trustee shall have the right to take for its own account (individually or as a partner or fiduciary) or to recommend to others any such particular investment or other opportunity. Any Trustee may engage or be interested in any financial or other transaction with the Depositor or any Affiliate of the Depositor, or may act as depository for, trustee or agent for, or act on any committee or body of holders of, securities or other obligations of the Depositor or its Affiliates. SECTION 8.7 Corporate Property Trustee Required; Eligibility of Trustees. (a) There shall at all times be a Property Trustee hereunder with respect to the Trust Securities. The Property Trustee shall be a Person that is eligible pursuant to the Trust Indenture Act to act as such and has a combined capital and surplus of at least $50,000,000. If any such Person publishes reports of condition at least annually, pursuant to law or to the requirements of its supervising or examining authority, then for the purposes of this Section, the combined capital and surplus of such Person shall be deemed to be its combined capital and surplus as set forth in its most recent report of condition so published. If at any time the Property Trustee with respect to the Trust Securities shall cease to be eligible in accordance with the provisions of this Section, it shall resign immediately in the manner and with the effect hereinafter specified in this Article. (b) There shall at all times be one or more Administrative Trustees hereunder with respect to the Trust Securities. Each Administrative Trustee shall be either a natural person who is at least 21 years of age or a legal entity that shall act through one or more persons authorized to bind that entity. (c) There shall at all times be a Delaware Trustee with respect to the Trust Securities. The Delaware Trustee shall either be (i) a natural person who is at least 21 years of age and a resident of the State of Delaware or (ii) a legal entity with its principal place of business in the State of Delaware and that otherwise meets the requirements of applicable Delaware law that shall act through one or more persons authorized to bind such entity. SECTION 8.8 Conflicting Interests. If the Property Trustee has or shall acquire a conflicting interest within the meaning of the Trust Indenture Act, the Property Trustee shall either eliminate such interest or resign, to the extent and in the manner provided by, and subject to the provisions of, the Trust Indenture Act and this Trust Agreement. SECTION 8.9 Co-Trustees and Separate Trustee. Unless an Event of Default shall have occurred and be continuing, at any time or times, for the purpose of meeting the legal requirements of the Trust Indenture Act or of any jurisdiction in which any part of the Trust Property may at the time be located, the Depositor and the Administrative Trustees, by agreed action of the majority of such Trustees, shall have power to appoint, and upon the written request of the Administrative Trustees, the Depositor shall for such purpose join with the Administrative Trustees in the execution, delivery, and performance of all instruments and agreements necessary or proper to appoint, one or more Persons approved by the Property Trustee either to act as co-trustee, jointly with the Property Trustee, of all or any part of such Trust Property, or to the extent required by law to act as separate trustee of any such
38 property, in either case with such powers as may be provided in the instrument of appointment, and to vest in such Person or Persons in the capacity aforesaid, any property, title, right or power deemed necessary or desirable, subject to the other provisions of this Section. If the Depositor does not join in such appointment within 15 days after the receipt by it of a request so to do, or in case a Debenture Event of Default has occurred and is continuing, the Property Trustee alone shall have power to make such appointment. Any co-trustee or separate trustee appointed pursuant to this Section shall either be (i) a natural person who is at least 21 years of age and a resident of the United States or (ii) a legal entity with its principal place of business in the United States that shall act through one or more persons authorized to bind such entity. Should any written instrument from the Depositor be required by any co-trustee or separate trustee so appointed for more fully confirming to such co-trustee or separate trustee such property, title, right, or power, any and all such instruments shall, on request, be executed, acknowledged and delivered by the Depositor. Every co-trustee or separate trustee shall, to the extent permitted by law, but to such extent only, be appointed subject to the following terms, namely: (a) The Trust Securities shall be executed and delivered and all rights, powers, duties, and obligations hereunder in respect of the custody of securities, cash and other personal property held by, or required to be deposited or pledged with, the Trustees specified hereunder shall be exercised solely by such Trustees and not by such co-trustee or separate trustee. (b) The rights, powers, duties, and obligations hereby conferred or imposed upon the Property Trustee in respect of any property covered by such appointment shall be conferred or imposed upon and exercised or performed by the Property Trustee or by the Property Trustee and such co-trustee or separate trustee jointly, as shall be provided in the instrument appointing such co-trustee or separate trustee, except to the extent that under any law of any jurisdiction in which any particular act is to be performed, the Property Trustee shall be incompetent or unqualified to perform such act, in which event such rights, powers, duties and obligations shall be exercised and performed by such co-trustee or separate trustee. (c) The Property Trustee at any time, by an instrument in writing executed by it, with the written concurrence of the Depositor, may accept the resignation of or remove any co-trustee or separate trustee appointed under this Section, and, in case a Debenture Event of Default has occurred and is continuing, the Property Trustee shall have power to accept the resignation of, or remove, any such co-trustee or separate trustee without the concurrence of the Depositor. Upon the written request of the Property Trustee, the Depositor shall join with the Property Trustee in the execution, delivery and performance of all instruments and agreements necessary or proper to effectuate such resignation or removal. A successor to any co-trustee or separate trustee so resigned or removed may be appointed in the manner provided in this Section. (d) No co-trustee or separate trustee hereunder shall be personally liable by reason of any act or omission of the Property Trustee or any other trustee hereunder. (e) The Property Trustee shall not be liable by reason of any act of a co-trustee or separate trustee.
39 (f) Any Act of Holders delivered to the Property Trustee shall be deemed to have been delivered to each such co-trustee and separate trustee. SECTION 8.10 Resignation and Removal; Appointment of Successor. No resignation or removal of any Trustee (the "Relevant Trustee") and no appointment of a successor Trustee pursuant to this Article shall become effective until the acceptance of appointment by the successor Trustee in accordance with the applicable requirements of Section 8.11. Subject to the immediately preceding paragraph, the Relevant Trustee may resign at any time by giving written notice thereof to the Securityholders. If the instrument of acceptance by the successor Trustee required by Section 8.11 shall not have been delivered to the Relevant Trustee within 30 days after the giving of such notice of resignation, the Relevant Trustee may petition, at the expense of the Trust, any court of competent jurisdiction for the appointment of a successor Relevant Trustee. Unless a Debenture Event of Default shall have occurred and be continuing, any Trustee may be removed at any time by Act of the Common Securityholder. If a Debenture Event of Default shall have occurred and be continuing, the Property Trustee or the Delaware Trustee, or both of them, may be removed at such time by Act of the Holders of a majority in Liquidation Amount of the Capital Securities, delivered to the Relevant Trustee (in its individual capacity and on behalf of the Trust). An Administrative Trustee may be removed by the Common Securityholder at any time. If the instrument of acceptance by the successor Trustee required by Section 8.11 shall not have been delivered to the Relevant Trustee within 30 days after such removal, the Relevant Trustee may petition, at the expense of the Trust, any court of competent jurisdiction for the appointment of a successor Relevant Trustee. If any Trustee shall resign, be removed or become incapable of acting as Trustee, or if a vacancy shall occur in the office of any Trustee for any cause, at a time when no Debenture Event of Default shall have occurred and be continuing, the Common Securityholder, by Act of the Common Securityholder delivered to the retiring Trustee, shall promptly appoint a successor Trustee or Trustees, and the retiring Trustee shall comply with the applicable requirements of Section 8.11. If the Property Trustee or the Delaware Trustee shall resign, be removed or become incapable of continuing to act as the Property Trustee or the Delaware Trustee, as the case may be, at a time when a Debenture Event of Default shall have occurred and be continuing, the Capital Securityholders, by Act of the Securityholders of a majority in Liquidation Amount of the Capital Securities then Outstanding delivered to the retiring Relevant Trustee, shall promptly appoint a successor Relevant Trustee or Trustees, and such successor Trustee shall comply with the applicable requirements of Section 8.11. If an Administrative Trustee shall resign, be removed or become incapable of acting as Administrative Trustee, at a time when a Debenture Event of Default shall have occurred and be continuing, the Common Securityholder by Act of the Common Securityholder delivered to the Administrative Trustee shall promptly appoint a successor Administrative Trustee or Administrative Trustees and such successor Administrative Trustee or Trustees shall comply with the applicable requirements of Section 8.11. If no successor Relevant Trustee shall have been so appointed by the Common Securityholder or the Capital Securityholders and accepted appointment in the manner required by Section 8.11, any Securityholder who has been a Securityholder of Trust Securities for at least six months may, on
40 behalf of himself and all others similarly situated, petition any court of competent jurisdiction for the appointment of a successor Relevant Trustee. The Property Trustee shall give notice of each resignation and each removal of a Trustee and each appointment of a successor Trustee to all Securityholders in the manner provided in Section 10.9 and shall give notice to the Depositor. Each notice shall include the name of the successor Relevant Trustee and the address of its Corporate Trust Office if it is the Property Trustee. Notwithstanding the foregoing or any other provision of this Trust Agreement, in the event any Administrative Trustee or a Delaware Trustee who is a natural person dies or becomes, in the opinion of the Depositor, incompetent or incapacitated, the vacancy created by such death, incompetence or incapacity may be filled by (a) the unanimous act of the remaining Administrative Trustees if there are at least two of them or (b) otherwise by the Depositor (with the successor in each case being a Person who satisfies the eligibility requirement for Administrative Trustees or Delaware Trustee, as the case may be, set forth in Section 8.7). SECTION 8.11 Acceptance of Appointment by Successor. In case of the appointment hereunder of a successor Relevant Trustee, the retiring Relevant Trustee and each successor Relevant Trustee with respect to the Trust Securities shall execute and deliver an amendment hereto wherein each successor Relevant Trustee shall accept such appointment and which (a) shall contain such provisions as shall be necessary or desirable to transfer and confirm to, and to vest in, each successor Relevant Trustee all the rights, powers, trusts and duties of the retiring Relevant Trustee with respect to the Trust Securities and the Trust and (b) shall add to or change any of the provisions of this Trust Agreement as shall be necessary to provide for or facilitate the administration of the Trust by more than one Relevant Trustee, it being understood that nothing herein or in such amendment shall constitute such Relevant Trustees co-trustees and upon the execution and delivery of such amendment the resignation or removal of the retiring Relevant Trustee shall become effective to the extent provided therein and each such successor Relevant Trustee, without any further act, deed or conveyance, shall become vested with all the rights, powers, trusts and duties of the retiring Relevant Trustee; but, on written request of the Trust or any successor Relevant Trustee such retiring Relevant Trustee shall duly assign, transfer and deliver to such successor Relevant Trustee all Trust Property, all proceeds thereof and money held by such retiring Relevant Trustee hereunder with respect to the Trust Securities and the Trust. Upon written request of any such successor Relevant Trustee, the Trust shall execute any and all instruments for more fully and certainly vesting in and confirming to such successor Relevant Trustee all such rights, powers and trusts referred to in the preceding paragraph. No successor Relevant Trustee shall accept its appointment unless at the time of such acceptance such successor Relevant Trustee shall be qualified and eligible under this Article. SECTION 8.12 Merger, Conversion, Consolidation or Succession to Business. Any Person into which the Property Trustee or the Delaware Trustee may be merged or converted or with which it may be consolidated, or any Person resulting from any merger,
41 conversion or consolidation to which such Relevant Trustee shall be a party, or any Person succeeding to all or substantially all the corporate trust business of such Relevant Trustee, shall be the successor of such Relevant Trustee hereunder, provided such Person shall be otherwise qualified and eligible under this Article, without the execution or filing of any paper or any further act on the part of any of the parties hereto. SECTION 8.13 Preferential Collection of Claims Against Depositor or Trust. In case of the pendency of any receivership, insolvency, liquidation, bankruptcy, reorganization, arrangement, adjustment, composition or other similar judicial proceeding relative to the Trust or any other obligor upon the Trust Securities or the property of the Trust or of such other obligor or their creditors, the Property Trustee (irrespective of whether any Distributions on the Trust Securities shall then be due and payable as therein expressed or by declaration or otherwise and irrespective of whether the Property Trustee shall have made any demand on the Trust for the payment of any past due Distributions) shall be entitled and empowered, to the fullest extent permitted by law, by intervention in such proceeding or otherwise: (a) to file and prove a claim for the whole amount of any Distributions owing and unpaid in respect of the Trust Securities and to file such other papers or documents as may be necessary or advisable in order to have the claims of the Property Trustee (including any claim for the reasonable compensation, expenses, disbursements and advances of the Property Trustee, its agents and counsel) and of the Holders allowed in such judicial proceeding, and (b) to collect and receive any moneys or other property payable or deliverable on any such claims and to distribute the same; and any custodian, receiver, assignee, trustee, liquidator, sequestrator or other similar official in any such judicial proceeding is hereby authorized by each Holder to make such payments to the Property Trustee and, in the event the Property Trustee shall consent to the making of such payments directly to the Holders, to pay to the Property Trustee any amount due it for the reasonable compensation, expenses, disbursements and advances of the Property Trustee, its agents and counsel, and any other amounts due the Property Trustee. Nothing herein contained shall be deemed to authorize the Property Trustee to authorize or consent to or accept or adopt on behalf of any Holder any plan of reorganization, arrangement adjustment or compensation affecting the Trust Securities or the rights of any Holder thereof or to authorize the Property Trustee to vote in respect of the claim of any Holder in any such proceeding. SECTION 8.14 Reports by Property Trustee. (a) The Property Trustee shall transmit to Securityholders such reports concerning the Property Trustee and its actions under this Trust Agreement as may be required pursuant to the Trust Indenture Act at the times and in the manner provided pursuant thereto. If required by Section 313(a) of the Trust Indenture Act, the Property Trustee shall, within sixty days after each May 15 following the date of this Trust Agreement deliver to Securityholders a brief report, dated as of such May 15, which complies with the provisions of such Section 313(a).
42 (b) A copy of each such report shall, at the time of such transmission to Holders, be filed by the Property Trustee with each national stock exchange, the Nasdaq National Market or such other interdealer quotation system or self-regulatory organization upon which the Trust Securities are listed or traded, if any, with the Commission and with the Depositor. The Depositor will promptly notify the Property Trustee of any such listing or trading. SECTION 8.15 Reports to the Property Trustee. The Depositor and the Administrative Trustees on behalf of the Trust shall provide to the Property Trustee such documents, reports and information as required by Section 314 of the Trust Indenture Act (if any) and the compliance certificate required by Section 314(a) of the Trust Indenture Act in the form, in the manner and at the times required by Section 314 of the Trust Indenture Act. Delivery of such reports, information and documents to the Property Trustee is for informational purposes only and the Property Trustee's receipt of such shall not constitute constructive notice of any information contained therein or determinable from information contained therein, including the Trust's compliance with any of its covenants hereunder (as to which the Property Trustee is entitled to rely exclusively on Officers' Certificates). SECTION 8.16 Evidence of Compliance with Conditions Precedent. Each of the Depositor and the Administrative Trustees on behalf of the Trust shall provide to the Property Trustee such evidence of compliance with any conditions precedent, if any, provided for in this Trust Agreement that relate to any of the matters set forth in Section 314 (c) of the Trust Indenture Act. Any certificate or opinion required to be given by an officer pursuant to Section 314(c)(1) of the Trust Indenture Act shall be given in the form of an Officers' Certificate. SECTION 8.17 Number of Trustees. (a) The number of Trustees shall be four, provided that the Holder of all of the Common Securities by written instrument may increase or decrease the number of Administrative Trustees. The Property Trustee and the Delaware Trustee may be the same Person. (b) If a Trustee ceases to hold office for any reason and the number of Administrative Trustees is not reduced pursuant to Section 8.17(a), or if the number of Trustees is increased pursuant to Section 8.17(a), a vacancy shall occur. The vacancy shall be filled with a Trustee appointed in accordance with Section 8.10. (c) The death, resignation, retirement, removal, bankruptcy, incompetence or incapacity to perform the duties of a Trustee shall not operate to dissolve, terminate or annul the Trust. Whenever a vacancy in the number of Administrative Trustees shall occur, until such vacancy is filled by the appointment of an Administrative Trustee in accordance with Section 8.10, the Administrative Trustees in office, regardless of their number (and notwithstanding any other provision of this Agreement), shall have all the powers granted to the Administrative Trustees and shall discharge all the duties imposed upon the Administrative Trustees by this Trust Agreement. SECTION 8.18 Delegation of Power.
43 (a) Any Administrative Trustee may, by power of attorney consistent with applicable law, delegate to any other natural person over the age of 21 his or her power for the purpose of executing any documents contemplated in Section 2.7(a), including any registration statement or amendment thereto filed with the Commission, or making any other governmental filing; and (b) The Administrative Trustees shall have power to delegate from time to time to such of their number or to the Depositor the doing of such things and the execution of such instruments either in the name of the Trust or the names of the Administrative Trustees or otherwise as the Administrative Trustees may deem expedient, to the extent such delegation is not prohibited by applicable law or contrary to the provisions of this Trust Agreement, as set forth herein. ARTICLE IX TERMINATION, LIQUIDATION AND MERGER SECTION 9.1 Termination Upon Expiration Date. Unless earlier terminated, the Trust shall automatically terminate on December 31, 2051 (the "Expiration Date"), following the distribution of the Trust Property in accordance with Section 9.4. SECTION 9.2 Early Termination. The first to occur of any of the following events is an "Early Termination Event": (a) the occurrence of a Bankruptcy Event in respect of, or the dissolution or liquidation of, the Holder of the Common Securities; (b) the written direction to the Property Trustee from the Depositor at any time to terminate the Trust and, after satisfaction of liabilities to creditors of the Trust as provided by applicable law, distribute Debentures to Securityholders in exchange for the Capital Securities (which direction is optional and wholly within the discretion of the Depositor); (c) the redemption of all of the Capital Securities in connection with the redemption of all of the Debentures; and (d) the entry of an order for dissolution of the Trust by a court of competent jurisdiction. SECTION 9.3 Termination. The respective obligations and responsibilities of the Trustees and the Trust created and continued hereby shall terminate upon the latest to occur of the following: (a) the distribution by the Property Trustee to Securityholders upon the liquidation of the Trust pursuant to Section 9.4, or upon the redemption of all of the Trust Securities pursuant to Section 4.2, of all amounts required to be distributed hereunder upon the final payment of the Trust Securities; (b) the payment of any expenses owed by the Trust; and (c) the discharge of all administrative duties of
44 the Administrative Trustees, including the performance of any tax reporting obligations with respect to the Trust or the Securityholders. SECTION 9.4 Liquidation. (a) If an Early Termination Event specified in clause (a), (b) or (d) of Section 9.2 occurs or upon the Expiration Date, the Trust shall be liquidated by the Trustees as expeditiously as the Trustees determine to be possible by distributing, after satisfaction or the making of reasonable provisions for the payment of liabilities to creditors of the Trust as provided by applicable law, to each Securityholder a Like Amount of Debentures, subject to Section 9.4(d). Notice of liquidation shall be given by the Property Trustee by first-class mail, postage prepaid mailed not later than 30 nor more than 60 days prior to the Liquidation Date to each Holder of Trust Securities at such Holder's address appearing in the Securities Register. All notices of liquidation shall: (i) state the CUSIP, Common Code and ISIN Numbers of the Trust Securities; (ii) state the Liquidation Date; (iii) state that from and after the Liquidation Date, the Trust Securities will no longer be deemed to be Outstanding and any Trust Securities Certificates not surrendered for exchange will be deemed to represent a Like Amount of Debentures; and (iv) provide such information with respect to the mechanics by which Holders may exchange Trust Securities Certificates for Debentures, or if Section 9.4(d) applies receive a Liquidation Distribution, as the Administrative Trustees or the Property Trustee shall deem appropriate. (b) Except where Section 9.2(c) or 9.4(d) applies, in order to effect the liquidation of the Trust and distribution of the Debentures to Securityholders, the Property Trustee shall establish a record date for such distribution (which shall be not more than 45 days prior to the Liquidation Date) and, either itself acting as exchange agent or through the appointment of a separate exchange agent, shall establish such procedures as it shall deem appropriate to effect the distribution of Debentures in exchange for the Outstanding Trust Securities Certificates. (c) Except where Section 9.2(c) or 9.4(d) applies, after the Liquidation Date, (i) the Trust Securities will no longer be deemed to be Outstanding, (ii) certificates representing a Like Amount of Debentures will be issued to Holders of Trust Securities Certificates, upon surrender of such certificates to the Administrative Trustees or their agent for exchange, (iii) the Depositor shall use its best efforts to have the Debentures listed on the New York Stock Exchange or on such other exchange, interdealer quotation system or self-regulatory organization as the Capital Securities are then listed or traded, (iv) any Trust Securities Certificates not so surrendered for exchange will be deemed to represent a Like Amount of Debentures, accruing interest at the rate provided for in the Debentures from the last Distribution Date on which a Distribution was made on such Trust Securities Certificates until such certificates are so surrendered (and until such certificates are so surrendered, no payments of interest or principal will be made to Holders of Trust Securities Certificates with respect to such Debentures) and (v) all rights of Securityholders
45 holding Trust Securities will cease, except the right of such Securityholders to receive Debentures upon surrender of Trust Securities Certificates. (d) In the event that, notwithstanding the other provisions of this Section 9.4, whether because of an order for dissolution entered by a court of competent jurisdiction or otherwise, distribution of the Debentures in the manner provided herein is determined by the Property Trustee not to be practical, the Trust Property shall be liquidated, and the Trust shall be dissolved, wound-up or terminated, by the Property Trustee. In such event, on the date of the dissolution, winding-up or other termination of the Trust, Securityholders will be entitled to receive out of the assets of the Trust available for distribution to Securityholders, after satisfaction of liabilities to creditors of the Trust as provided by applicable law, an amount equal to the Liquidation Amount per Trust Security plus accumulated and unpaid Distributions thereon to the date of payment (such amount being the "Liquidation Distribution"). If, upon any such dissolution, winding up or termination, the Liquidation Distribution can be paid only in part because the Trust has insufficient assets available to pay in full the aggregate Liquidation Distribution, then, subject to the next succeeding sentence, the amounts payable by the Trust on the Trust Securities shall be paid on a pro rata basis (based upon Liquidation Amounts). The Holder of the Common Securities will be entitled to receive Liquidation Distributions upon any such dissolution, winding-up or termination pro rata (determined as aforesaid) with Holders of Capital Securities, except that, if a Debenture Event of Default has occurred and is continuing, the Capital Securities shall have a priority over the Common Securities. SECTION 9.5 Mergers, Consolidations, Amalgamations or Replacements of the Trust. The Trust may not merge with or into, consolidate, amalgamate, or be replaced by, or convey, transfer or lease its properties and assets substantially as an entirety to any corporation or other Person, except pursuant to this Article IX. At the request of the Depositor, with the consent of the Administrative Trustees and without the consent of the Holders of the Capital Securities, the Property Trustee or the Delaware Trustee, the Trust may merge with or into, consolidate, amalgamate, or be replaced by or convey, transfer or lease its properties and assets substantially as an entirety to a trust organized as such under the laws of any State; provided, that (i) such successor entity either (a) expressly assumes all of the obligations of the Trust with respect to the Capital Securities or (b) substitutes for the Capital Securities other securities having substantially the same terms as the Capital Securities (the "Successor Securities") so long as the Successor Securities rank the same as the Capital Securities rank in priority with respect to distributions and payments upon liquidation, redemption and otherwise, (ii) the Depositor expressly appoints a trustee of such successor entity possessing the same powers and duties as the Property Trustee as the holder of the Debentures, (iii) the Successor Securities are listed or traded, or any Successor Securities will be listed upon notification of issuance, on any national securities exchange or other organization on which the Capital Securities are then listed or traded, if any, (iv) such merger, consolidation, amalgamation, replacement, conveyance, transfer or lease does not cause the Capital Securities (including any Successor Securities) to be downgraded by any nationally recognized statistical rating organization, (v) such merger, consolidation, amalgamation, replacement, conveyance, transfer or lease does not adversely affect the rights, preferences and privileges of the holders of the Capital Securities (including any Successor Securities) in any material respect, (vi) such successor entity has a purpose identical to that of the Trust, (vii) prior to such merger, consolidation, amalgamation, replacement, conveyance, transfer or lease, the Depositor has received an Opinion of Counsel to the effect that (a) such merger, consolidation,
46 amalgamation, replacement, conveyance, transfer or lease does not adversely affect the rights, preferences and privileges of the holders of the Capital Securities (including any Successor Securities) in any material respect, and (b) following such merger, consolidation, amalgamation, replacement, conveyance, transfer or lease, neither the Trust nor such successor entity will be required to register as an investment company under the 1940 Act and (viii) the Depositor owns all of the common securities of such successor entity and guarantees the obligations of such successor entity under the Successor Securities at least to the extent provided by the Guarantee. Notwithstanding the foregoing, the Trust shall not, except with the consent of Holders of 100% in Liquidation Amount of the Capital Securities, consolidate, amalgamate, merge with or into, or be replaced by or convey, transfer or lease its properties and assets substantially as an entirety to any other Person or permit any other Person to consolidate, amalgamate, merge with or into, or replace it if such consolidation, amalgamation, merger, replacement, conveyance, transfer or lease would cause the Trust or the successor entity to be classified as other than a grantor trust for United States federal income tax purposes. ARTICLE X MISCELLANEOUS PROVISIONS SECTION 10.1 Limitation of Rights of Securityholders. The death, incapacity, liquidation, dissolution, termination or bankruptcy of any Person having an interest, beneficial or otherwise, in Trust Securities shall not operate to terminate this Trust Agreement, nor entitle the legal representatives or heirs of such Person or any Securityholder for such Person, to claim an accounting, take any action or bring any proceeding in any court for a partition or winding up of the arrangements contemplated hereby, nor otherwise affect the rights, obligations and liabilities of the parties hereto or any of them. SECTION 10.2 Liability of the Common Securityholder. The Holder of the Common Securities shall be liable for all of the debts and obligations of the Trust (other than with respect to the Securities) to the extent not satisfied out of the Trust's assets. SECTION 10.3 Amendment. (a) This Trust Agreement may be amended from time to time by the Property Trustee, the Administrative Trustees and the Depositor, without the consent of any Securityholders, (i) to cure any ambiguity, correct or supplement any provision herein which may be inconsistent with any other provision herein, or to make any other provisions with respect to matters or questions arising under this Trust Agreement, which shall not be inconsistent with the other provisions of this Trust Agreement, or (ii) to modify, eliminate or add to any provisions of this Trust Agreement to such extent as shall be necessary to ensure that the Trust will be classified for United States federal income tax purposes as a grantor trust at all times that any Trust Securities are outstanding or to ensure that the Trust will not be required to register as an investment company under the 1940 Act; provided, however, that in the case of clause (i) or clause (ii), such action shall not adversely affect in any material respect the interests of any Securityholder, and
47 any amendments of this Trust Agreement shall become effective when notice thereof is given to the Securityholders. (b) Except as provided in Section 10.3(c) hereof, any provision of this Trust Agreement may be amended by the Trustees and the Depositor with (i) the consent of Trust Securityholders representing not less than a majority (based upon Liquidation Amounts) of the Trust Securities then Outstanding and (ii) receipt by the Trustees of an Opinion of Counsel to the effect that such amendment or the exercise of any power granted to the Trustees in accordance with such amendment will not affect the Trust's status as a grantor trust for United States federal income tax purposes or the Trust's exemption from status of an investment company under the 1940 Act. (c) In addition to and notwithstanding any other provision in this Trust Agreement, without the consent of each affected Securityholder (such consent being obtained in accordance with Section 6.3 or 6.6 hereof), this Trust Agreement may not be amended to (i) change the amount or timing of any Distribution on the Trust Securities or otherwise adversely affect the amount of any Distribution required to be made in respect of the Trust Securities as of a specified date or (ii) restrict the right of a Securityholder to institute suit for the enforcement of any such payment on or after such date; notwithstanding any other provision herein, without the unanimous consent of the Securityholders (such consent being obtained in accordance with Section 6.3 or 6.6 hereof), this paragraph (c) of this Section 10.3 may not be amended. (d) Notwithstanding any other provisions of this Trust Agreement, no Trustee shall enter into or consent to any amendment to this Trust Agreement which would cause the Trust to fail or cease to qualify for the exemption from status of an investment company under the 1940 Act or fail or cease to be classified as a grantor trust for United States federal income tax purposes. (e) Notwithstanding anything in this Trust Agreement to the contrary, without the consent of the Depositor, this Trust Agreement may not be amended in a manner which imposes any additional obligation on the Depositor. (f) In the event that any amendment to this Trust Agreement is made, the Administrative Trustees shall promptly provide to the Depositor a copy of such amendment. (g) Neither the Property Trustee nor the Delaware Trustee shall be required to enter into any amendment to this Trust Agreement which affects its own rights, duties or immunities under this Trust Agreement. The Property Trustee shall be entitled to receive an Opinion of Counsel and an Officers' Certificate stating that any amendment to this Trust Agreement is in compliance with this Trust Agreement. SECTION 10.4 Separability. In case any provision in this Trust Agreement or in the Trust Securities Certificates shall be invalid, illegal or unenforceable, the validity, legality and enforceability of the remaining provisions shall not in any way be affected or impaired thereby. SECTION 10.5 Governing Law.
48 THIS TRUST AGREEMENT AND THE RIGHTS AND OBLIGATIONS OF EACH OF THE SECURITYHOLDERS, THE TRUST AND THE TRUSTEES WITH RESPECT TO THIS TRUST AGREEMENT AND THE TRUST SECURITIES SHALL BE CONSTRUED IN ACCORDANCE WITH AND GOVERNED BY THE LAWS OF THE STATE OF DELAWARE (WITHOUT REGARD TO CONFLICT OF LAWS PRINCIPLES). SECTION 10.6 Payments Due on Non-Business Day. If the date fixed for any payment on any Trust Security shall be a day that is not a Business Day, then such payment need not be made on such date but may be made on the next succeeding day that is a Business Day (except as otherwise provided in Sections 4.1(a) and 4.2(d)), with the same force and effect as though made on the date fixed for such payment, and no interest shall accrue thereon for the period after such date. SECTION 10.7 Successors. This Trust Agreement shall be binding upon and shall inure to the benefit of any successor to the Depositor, the Trust or the Relevant Trustee, including any successor by operation of law. Except in connection with a consolidation, merger or sale involving the Depositor that is permitted under Article Eight of the Indenture and pursuant to which the assignee agrees in writing to perform the Depositor's obligations hereunder, the Depositor shall not assign its obligations hereunder. SECTION 10.8 Headings. The Article and Section headings are for convenience only and shall not affect the construction of this Trust Agreement. SECTION 10.9 Reports, Notices and Demands. Any report, notice, demand or other communication which by any provision of this Trust Agreement is required or permitted to be given or served to or upon any Securityholder or the Depositor may be given or served in writing by deposit thereof, first-class postage prepaid, in the United States mail, hand delivery or facsimile transmission, in each case, addressed, (a) in the case of a Capital Securityholder, to such Capital Securityholder as such Securityholder's name and address may appear on the Securities Register; and (b) in the case of the Common Securityholder or the Depositor, to The Chase Manhattan Corporation, 270 Park Avenue, New York, New York 10017, Attention: Treasurer, facsimile no.: (212) 270-1604. Such notice, demand or other communication to or upon a Securityholder shall be deemed to have been sufficiently given or made, for all purposes, upon hand delivery, mailing or transmission. Any notice, demand or other communication which by any provision of this Trust Agreement is required or permitted to be given or served to or upon the Trust, the Property Trustee, the Delaware Trustee or the Administrative Trustees shall be given in writing addressed (until another address is published by the Trust) as follows: (a) with respect to the Property Trustee to The Bank of New York, 101 Barclay Street, New York, New York 10286, Attention: Corporate Trust Administration; (b) with respect to the Delaware Trustee, to The Bank of New
49 York (Delaware), White Clay Center, Route 273, Newark, Delaware, with a copy to the Property Trustee at the address set forth in Clause (a); and (c) with respect to the Administrative Trustees, to them at the address above for notices to the Depositor, marked "Attention Administrative Trustees of Chase Capital II." Such notice, demand or other communication to or upon the Trust or the Property Trustee shall be deemed to have been sufficiently given or made only upon actual receipt of the writing by the Trust or the Property Trustee. SECTION 10.10 Agreement Not to Petition. Each of the Trustees and the Depositor agree for the benefit of the Securityholders that, until at least one year and one day after the Trust has been terminated in accordance with Article IX, they shall not file, or join in the filing of, a petition against the Trust under any bankruptcy, insolvency, reorganization or other similar law (including, without limitation, the United States Bankruptcy Code) (collectively, "Bankruptcy Laws") or otherwise join in the commencement of any proceeding against the Trust under any Bankruptcy Law. In the event the Depositor takes action in violation of this Section 10.10, the Property Trustee agrees, for the benefit of Securityholders, that at the expense of the Depositor, it shall file an answer with the bankruptcy court or otherwise properly contest the filing of such petition by the Depositor against the Trust or the commencement of such action and raise the defense that the Depositor has agreed in writing not to take such action and should be stopped and precluded therefrom and such other defenses, if any, as counsel for the Trustee or the Trust may assert. The provisions of this Section 10.10 shall survive the termination of this Trust Agreement. SECTION 10.11 Trust Indenture Act; Conflict with Trust Indenture Act. (a) This Trust Agreement is subject to the provisions of the Trust Indenture Act that are required or deemed to be part of this Trust Agreement and shall, to the extent applicable, be governed by such provisions. (b) The Property Trustee shall be the only Trustee which is a trustee for the purposes of the Trust Indenture Act. (c) If any provision hereof limits, qualifies or conflicts with another provision hereof which is required or deemed to be included in this Trust Agreement by any of the provisions of the Trust Indenture Act, such required or deemed provision shall control. If any provision of this Trust Agreement modifies or excludes any provision of the Trust Indenture Act which may be so modified or excluded, the latter provision shall be deemed to apply to this Trust Agreement as so modified or excluded, as the case may be. (d) The application of the Trust Indenture Act to this Trust Agreement shall not affect the nature of the Trust Securities as equity securities representing undivided beneficial interests in the assets of the Trust.
50 SECTION 10.12 Acceptance of Terms of Trust Agreement, Guarantee and Indenture. THE RECEIPT AND ACCEPTANCE OF A TRUST SECURITY OR ANY INTEREST THEREIN BY OR ON BEHALF OF A SECURITYHOLDER OR ANY BENEFICIAL OWNER, WITHOUT ANY SIGNATURE OR FURTHER MANIFESTATION OF ASSENT, SHALL CONSTITUTE THE UNCONDITIONAL ACCEPTANCE BY THE SECURITYHOLDER AND ALL OTHERS HAVING A BENEFICIAL INTEREST IN SUCH TRUST SECURITY OF ALL THE TERMS AND PROVISIONS OF THIS TRUST AGREEMENT AND AGREEMENT TO THE SUBORDINATION PROVISIONS AND OTHER TERMS OF THE GUARANTEE AND THE INDENTURE, AND SHALL CONSTITUTE THE AGREEMENT OF THE TRUST, SUCH SECURITYHOLDER AND SUCH OTHERS THAT THE TERMS AND PROVISIONS OF THIS TRUST AGREEMENT SHALL BE BINDING, OPERATIVE AND EFFECTIVE AS BETWEEN THE TRUST AND SUCH SECURITYHOLDER AND SUCH OTHERS. SECTION 10.13 Holders are Parties. Notwithstanding that Holders have not executed and delivered this Trust Agreement or any counterpart thereof, Holders shall be deemed to be parties to this Trust Agreement and shall be bound by all of the terms and conditions hereof and of the Trust Securities by acceptance and delivery of the Trust Securities.
51 SECTION 10.14 Counterparts. This Trust Agreement may contain more than one counterpart of the signature page and this Trust Agreement may be executed by the affixing of the signature of each of the Trustees of one of such counterpart signature pages. All of such counterpart signature pages shall be read as though one, and they shall have the same force and effect as though all of the signers had signed a single signature page. THE CHASE MANHATTAN CORPORATION By: /s/ Deborah L. Duncan ------------------------------------- Name: Deborah L. Duncan Title: Treasurer THE BANK OF NEW YORK, as Property Trustee By: /s/ Paul J. Schmalzel ------------------------------------- Name: Paul J. Schmalzel Title: Assistant Treasurer THE BANK OF NEW YORK (DELAWARE), as Delaware Trustee By: /s/ Melissa J. Beneduce ------------------------------------- Name: Melissa J. Beneduce Title: Assistant Vice President /s/ Peter J. Tobin ---------------------------------------- PETER J. TOBIN as Administrative Trustee /s/ Deborah L. Duncan ---------------------------------------- DEBORAH L. DUNCAN as Administrative Trustee
Exhibit 4.9(a) BANC ONE CORPORATION and THE CHASE MANHATTAN BANK Trustee INDENTURE Dated as of March 3, 1997 Senior Debt Securities ===============================================================================
TABLE OF CONTENTS(1) Page ---- ARTICLE ONE Definitions and Other Provisions of General Application SECTION 1.01. Definitions..................................................... 1 "this Indenture" and certain other terms........................ 1 "Act"........................................................... 2 "Affiliate"..................................................... 2 "Authenticating Agent".......................................... 3 "Authorized Newspaper".......................................... 3 "Authorized Officer"............................................ 3 "Bearer Security"............................................... 3 "Board of Directors"............................................ 3 "Board Resolution".............................................. 3 "Business Day".................................................. 3 "CEDEL; CEDEL S.A."............................................. 3 "Commission".................................................... 3 "Common Depositary"............................................. 4 "Company"....................................................... 4 "Company Request" and "Company Order"........................... 4 "corporation"................................................... 4 "coupon"........................................................ 4 "Defaulted Interest"............................................ 4 "Depositary".................................................... 4 "Designated Currency"........................................... 4 "Dollar"........................................................ 4 "ECU"........................................................... 5 "Euroclear"..................................................... 5 "European Communities".......................................... 5 "Event of Default".............................................. 5 "Exchange Rate"................................................. 5 "Exchange Rate Agent"........................................... 5 "Exchange Rate Officer's Certificate"........................... 5 "Foreign Currency".............................................. 5 "Global Exchange Date".......................................... 5 - --------- (1) This table of Contents is not part of the Indenture. Page 2
Page ---- "Global Security".............................................. 6 "Holder"....................................................... 6 "interest"..................................................... 6 "Interest Payment Date"........................................ 6 "Maturity"..................................................... 6 "Officers' Certificate"........................................ 6 "Opinion of Counsel"........................................... 6 "Original Issue Discount Security"............................. 6 "Outstanding".................................................. 7 "Paying Agent"................................................. 8 "Person"....................................................... 8 "Place of Payment"............................................. 8 "Predecessor Security"......................................... 8 "Principal Corporate Trust Office"............................. 8 "Principal Paying Agent"....................................... 8 "Redemption Date".............................................. 8 "Redemption Price"............................................. 8 "Registered Security".......................................... 9 "Regular Record Date".......................................... 9 "Remarketing Entity"........................................... 9 "Repayment Date"............................................... 9 "Repayment Price".............................................. 9 "Responsible Officer".......................................... 9 "Security" or "Securities"..................................... 9 "Security Register"............................................ 9 "Security Registrar"........................................... 9 "Special Record Date".......................................... 10 "Stated Maturity".............................................. 10 "Subsidiary of the Company" or "Subsidiary".................... 10 "Trustee"...................................................... 10 "Trust Indenture Act" or "TIA"................................. 10 "United States"................................................ 10 "United States Alien".......................................... 10 "vice president"............................................... 11 SECTION 1.02. Compliance Certificates and Opinions........................... 11 SECTION 1.03. Form of Documents Delivered to Trustee......................... 12 SECTION 1.04. Acts of Holders................................................ 12 SECTION 1.05. Notices, etc., to Trustee and Company.......................... 16 SECTION 1.06. Notices to Holders; Waiver..................................... 16 SECTION 1.07. Language of Notices, Etc....................................... 18 SECTION 1.08. Conflict with Trust Indenture Act.............................. 18 Page 3
Page ---- SECTION 1.09. Effect of Headings and Table of Contents....................... 18 SECTION 1.10. Successors and Assigns......................................... 18 SECTION 1.11. Separability Clause............................................ 18 SECTION 1.12. Benefits of Indenture.......................................... 18 SECTION 1.13. Legal Holidays................................................. 19 SECTION 1.14. Governing Law.................................................. 19 ARTICLE TWO Security Forms SECTION 2.01. Forms Generally................................................ 19 SECTION 2.02. Form of Securities............................................. 20 SECTION 2.03. Form of Trustee's Certificate of Authentication................ 21 SECTION 2.04. Global Securities.............................................. 21 ARTICLE THREE The Securities SECTION 3.01. Title and Terms................................................ 22 SECTION 3.02. Denominations.................................................. 25 SECTION 3.03. Execution, Authentication, Delivery and Dating................. 26 SECTION 3.04. Temporary Securities........................................... 29 SECTION 3.05. Registration, Registration of Transfer and Exchange...................................... 33 SECTION 3.06. Mutilated, Destroyed, Lost and Stolen Securities................................................. 38 SECTION 3.07. Payment of Interest; Interest Rights Preserved.................................................. 40 SECTION 3.08. Persons Deemed Owners.......................................... 42 SECTION 3.09. Cancellation................................................... 43 SECTION 3.10. Computation of Interest........................................ 43 SECTION 3.11. Forms of Certification......................................... 44 SECTION 3.12. Judgments...................................................... 44 Page 4
Page ---- ARTICLE FOUR Redemption of Securities SECTION 4.01. Applicability of Article....................................... 45 SECTION 4.02. Election to Redeem; Notice to Trustee.......................... 46 SECTION 4.03. Selection by Security Registrar of Securities to be Redeemed... 46 SECTION 4.04. Notice of Redemption........................................... 47 SECTION 4.05. Deposit of Redemption Price.................................... 48 SECTION 4.06. Securities Payable on Redemption Date.......................... 48 SECTION 4.07. Securities Redeemed in Part.................................... 49 SECTION 4.08. Redemption Suspended During Event of Default................... 49 ARTICLE FIVE Covenants SECTION 5.01. Payment of Principal, Premium and Interest..................... 50 SECTION 5.02. Maintenance of Office or Agency................................ 50 SECTION 5.03. Money for Security Payments to Be Held in Trust................ 52 SECTION 5.04. Additional Amounts............................................. 54 SECTION 5.05. Statement as to Compliance..................................... 55 SECTION 5.06. Maintenance of Corporate Existence, Rights and Franchises...... 56 ARTICLE SIX Holders' Lists and Reports By Trustee and Company SECTION 6.01. Company to Furnish Trustee Names and Addresses of Holders...... 56 SECTION 6.02. Preservation of Information; Communications to Holders......... 57 SECTION 6.03. Reports by Trustee............................................. 59 SECTION 6.04. Reports by Company............................................. 59 Page 5
Page ---- ARTICLE SEVEN Remedies SECTION 7.01. Events of Default.............................................. 60 SECTION 7.02. Acceleration of Maturity; Rescission and Annulment............. 62 SECTION 7.03. Collection of Indebtedness and Suits for Enforcement by Trustee......................................... 63 SECTION 7.04. Trustee May File Proofs of Claim............................... 64 SECTION 7.05. Trustee May Enforce Claims Without Possession of Securities................................... 65 SECTION 7.06. Application of Money Collected................................. 65 SECTION 7.07. Limitation on Suits............................................ 66 SECTION 7.08. Unconditional Right of Holders to Receive Principal, Premium and Interest.................... 67 SECTION 7.09. Restoration of Rights and Remedies............................. 67 SECTION 7.10. Rights and Remedies Cumulative................................. 68 SECTION 7.11. Delay or Omission Not Waiver................................... 68 SECTION 7.12. Control by Holders............................................. 68 SECTION 7.13. Waiver of Past Defaults........................................ 69 SECTION 7.14. Undertaking for Costs.......................................... 69 SECTION 7.15. Waiver of Stay or Extension Laws............................... 70 ARTICLE EIGHT The Trustee SECTION 8.01. Certain Duties and Responsibilities............................ 70 SECTION 8.02. Notice of Default.............................................. 72 SECTION 8.03. Certain Rights of Trustee...................................... 72 SECTION 8.04. Not Responsible for Recitals or Issuance of Notes.............. 74 SECTION 8.05. May Hold Securities............................................ 74 SECTION 8.06. Money Held in Trust............................................ 74 SECTION 8.07. Compensation and Reimbursement................................. 74 SECTION 8.08. Disqualification; Conflicting Interests..... .................. 75 SECTION 8.09. Corporate Trustee Required; Eligibility........................ 76 Page 6
Page ---- SECTION 8.10. Resignation and Removal; Appointment of Successor.............. 76 SECTION 8.11. Acceptance of Appointment by Successor......................... 79 SECTION 8.12. Merger, Conversion, Consolidation or Succession to Business of Trustee.......................... 80 SECTION 8.13. Preferential Collection of Claims Against Company.............. 81 SECTION 8.14. Appointment of Authenticating Agents........................... 81 ARTICLE NINE Supplemental Indentures SECTION 9.01. Supplemental Indentures Without Consent of Holders............. 83 SECTION 9.02. Supplemental Indentures With Consent of Holders................ 85 SECTION 9.03. Execution of Supplemental Indentures........................... 86 SECTION 9.04. Effect of Supplemental Indentures.............................. 87 SECTION 9.05. Conformity with Trust Indenture Act............................ 87 SECTION 9.06. Reference in Securities to Supplemental Indentures............. 87 ARTICLE TEN Consolidation, Merger, Conveyance or Transfer SECTION 10.01. Company May Consolidate, etc., Only on Certain Terms........... 87 SECTION 10.02. Successor Corporation Substituted.............................. 88 ARTICLE ELEVEN Satisfaction and Discharge SECTION 11.01. Satisfaction and Discharge of Indenture........................ 88 SECTION 11.02. Application of Trust Money..................................... 90 SECTION 11.03. Reinstatement.................................................. 90 Page 7
Page ---- ARTICLE TWELVE Immunity of Incorporators, Stockholders, Officers and Directors SECTION 12.01. Exemption from Individual Liability............................ 91 ARTICLE THIRTEEN Sinking Funds SECTION 13.01. Applicability of Article....................................... 91 SECTION 13.02. Satisfaction of Sinking Fund Payments with Securities.......... 92 SECTION 13.03. Redemption of Securities for Sinking Fund...................... 92 ARTICLE FOURTEEN Repayment at the Option of Holders SECTION 14.01. Applicability of Article....................................... 93 SECTION 14.02. Repayment of Securities........................................ 93 SECTION 14.03. Exercise of Option; Notice..................................... 93 SECTION 14.04. Election of Repayment by Remarketing Entities.................. 95 SECTION 14.05. Securities Payable on the Repayment Date....................... 95 ARTICLE FIFTEEN Meeting of Holders of Securities SECTION 15.01. Purposes for Which Meetings May Be Called...................... 96 SECTION 15.02 Call, Notice and Place of Meetings............................. 96 SECTION 15.03. Persons Entitled to Vote at Meetings........................... 97 SECTION 15.04. Quorum; Action................................................. 97 Page 8
Page ---- SECTION 15.05. Determination of Voting Rights; Conduct and Adjournment of Meetings........................ 98 SECTION 15.06. Counting Votes and Recording Action of Meetings................ 99 ARTICLE SIXTEEN Miscellaneous SECTION 16.01. Counterparts.................................................. 100 TESTIMONIUM.................................................................. 101 SIGNATURES AND SEALS......................................................... 101 ACKNOWLEDGMENTS.............................................................. 102 EXHIBIT A. Form of Certificate to be Given by Person Entitled to Receive Bearer Security EXHIBIT B. Form of Certificate to be Given by Euroclear and CEDEL S.A. in Connection with the Exchange of a Portion of a Temporary Global Security EXHIBIT C. Form of Certificate to be Given by Euroclear and CEDEL S.A. to Obtain Interest Prior to an Exchange Date EXHIBIT D. Form of Certificate to be Given by Beneficial Owners to Obtain Interest Prior to an Exchange Date
TABLE SHOWING REFLECTION IN INDENTURE OF CERTAIN PROVISIONS OF TRUST INDENTURE ACT OF 1939 Reflected in Indenture Section ----------------- TIA Section 310(a)(1)........................................... 8.09 (a)(2)........................................... 8.09 (a)(3)........................................... Not Applicable (a)(4)........................................... Not Applicable (a)(5)........................................... 8.09 (b).............................................. 8.08 8.10 (c).............................................. Not Applicable Section 311(a).............................................. 8.13 (b).............................................. 8.13 Section 312(a).............................................. 6.01 6.02(i) (b).............................................. 6.02(ii) (c).............................................. 6.02(iii) Section 313(a).............................................. 6.03(i) (b).............................................. 6.03(ii) (c).............................................. 6.03(i),(ii) and (iii) (d).............................................. 6.03(iii) Section 314(a).............................................. 6.04 5.05 (b).............................................. Not Applicable (c)(1)........................................... 1.02 (c)(2)........................................... 1.02 (c)(3)........................................... Not Applicable (d).............................................. Not Applicable (e).............................................. 1.02 (f).............................................. Not Applicable Section 315(a).............................................. 8.01(i) 8.01(iii) (b).............................................. 8.02 (c).............................................. 8.01(ii) (d).............................................. 8.01 (d)(1)........................................... 8.01(i) (d)(2)........................................... 8.01(iii)(b) (d)(3)........................................... 8.01(iii)(c) (e).............................................. 7.14 Section 316(a).............................................. 1.01 Page 2
Reflected in Indenture Section ----------------- Section 316(a)(1)(A)........................................ 7.02 7.12 (a)(1)(B)........................................ 7.13 (a)(2)........................................... Not Applicable (b).............................................. 7.08 (c).............................................. 1.04(viii) Section 317(a)(1)........................................... 7.03 (a)(2)........................................... 7.04 (b).............................................. 5.03 Section 318(a).............................................. 1.08 (c).............................................. 1.08
THIS INDENTURE is entered into as of March 3, 1997, between BANC ONE CORPORATION, a corporation organized and existing under the laws of the State of Ohio (hereinafter called the "Company"), having its principal executive office at 100 East Broad Street, Columbus, Ohio 43271, and THE CHASE MANHATTAN BANK, a New York banking corporation (hereinafter called the "Trustee"), having its principal corporate trust office at 450 W. 33rd Street, 15th Floor, New York, New York 10001. RECITALS OF THE COMPANY The Company deems it necessary from time to time to issue its unsecured debentures, notes, bonds and other evidences of indebtedness to be issued in one or more series (hereinafter called the "Securities") as hereinafter set forth, and to provide therefor the Company has duly authorized the execution and delivery of this Indenture. All things necessary to make this Indenture a valid agreement of the Company, in accordance with its terms, have been done. NOW, THEREFORE, THIS INDENTURE WITNESSETH: For and in consideration of the premises and the purchase of the Securities by the Holders thereof, it is mutually covenanted and agreed, for the equal and proportionate benefit of all Holders of the Securities or of any series thereof, as follows: ARTICLE ONE Definitions and Other Provisions of General Application SECTION 1.01. Definitions. For all purposes of this Indenture, except as otherwise expressly provided or unless the context otherwise requires: (i) the term "this Indenture" means this instrument as originally executed or as it may from Page 2
time to time be supplemented or amended by one or more indentures supplemental hereto entered into pursuant to the applicable provisions hereof and shall include the terms of particular series of Securities established as contemplated by Section 3.01; (ii) all references in this instrument to designated "Articles", "Sections" and other subdivisions are to the designated Articles, Sections and other subdivisions of this Indenture. The words "herein", "hereof" and "hereunder" and other words of similar import refer to this Indenture as a whole and not to any particular Article, Section or other subdivision; (iii) the terms defined in this Article have the meanings assigned to them in this Article and include the plural as well as the singular; (iv) all other terms used herein which are defined in the Trust Indenture Act, either directly or by reference therein, have the meanings assigned to them therein; and (v) all accounting terms not otherwise defined herein have the meanings assigned to them in accordance with generally accepted accounting principles, and, except as may be otherwise expressly provided herein or in one or more indentures supplemental hereto, the term "generally accepted accounting principles" with respect to any computation required or permitted hereunder shall mean such accounting principles as are generally accepted at the date of such computation. "Act", when used with respect to any Holder, has the meaning specified in Section 1.04. "Affiliate" of any specified Person means any other Person directly or indirectly controlling or controlled by or under direct or indirect common control with such specified Person. For the purposes of this definition, "control" when used with respect to any specified Person means the power to direct the management and policies of such Person, directly or indirectly, whether through the ownership of voting securities, by contract or otherwise; and the terms "controlling" and "controlled" have meanings correlative to the foregoing. Page 3
"Authenticating Agent" means any Person authorized to act on behalf of the Trustee to authenticate Securities pursuant to Section 8.14. "Authorized Newspaper" means a newspaper, in an official language of the country of publication or in the English language, customarily published on each Business Day, whether or not published on Saturdays, Sundays or holidays, and of general circulation in the place in connection with which the term is used or in the financial community of such place. Where successive publications are required to be made in Authorized Newspapers, the successive publications may be made in the same or in different newspapers in the same city meeting the foregoing requirements and in each case on any Business Day. "Authorized Officer" means the Chairman of the Board, the President, any Vice Chairman of the Board, any Vice President, the Treasurer, the Secretary, the Comptroller, any Assistant Comptroller, any Assistant Treasurer or any Assistant Secretary of the Company. "Bearer Security" means any Security in the form established pursuant to Section 2.02 which is payable to bearer, including, without limitation, unless the context otherwise indicates, a Security in global bearer form. "Board of Directors" means either the board of directors of the Company or any duly authorized committee of that board. "Board Resolution" means a copy of a resolution certified by the Secretary or an Assistant Secretary of the Company to have been duly adopted by the Board of Directors and to be in full force and effect on the date of such certification, and delivered to the Trustee. "Business Day" means any day, other than a Saturday or Sunday, on which banking institutions in the City of Columbus, Ohio and any Place of Payment for the Securities are open for business. "CEDEL" or "CEDEL S.A." means Cedel Bank, societe anonyme or its successors. "Commission" means the Securities and Exchange Commission, as from time to time constituted, created under the Exchange Act, or if any time after the execution and Page 4
delivery of this instrument such Commission is not existing and performing the duties now assigned to it under the Trust Indenture Act, then the body performing such duties at such time. "Common Depositary" has the meaning specified in Section 3.04(b)(ii). "Company" means the Person named as the "Company" in the first paragraph of this instrument until any successor corporation shall have become such pursuant to the applicable provisions of this Indenture, and thereafter "Company" shall mean any such successor corporation. "Company Request" and "Company Order" mean, respectively, a written request or order signed in the name of the Company by its Chairman of the Board, its President, a Vice Chairman of the Board, or a Vice President, and by its Treasurer, an Assistant Treasurer, its Comptroller, an Assistant Comptroller, its Secretary or an Assistant Secretary, and delivered to the Trustee. "corporation" includes corporations, associations, companies and business trusts. "coupon" means any interest coupon appertaining to a Bearer Security. "Defaulted Interest" has the meaning specified in Section 3.07. "Depositary" means, with respect to the Securities of any series issuable or issued in the form of a Global Security, the Person designated as Depositary by the Company pursuant to Section 3.01 until a successor Depositary shall have been appointed pursuant to Section 3.05, and thereafter "Depositary" shall mean or include each Person who is then a Depositary hereunder, and if at any time there is more than one such Person, "Depositary" as used with respect to the Securities of any such series shall mean the Depositary with respect to the Securities of that series. "Designated Currency" has the meaning specified in Section 3.12. "Dollar" or "$" means the coin or currency of the United States of America as at the time of payment is legal tender for the payment of public and private debts. Page 5
"ECU" means the European Currency Unit as defined and revised from time to time by the Council of the European Communities. "Euroclear" means Morgan Guaranty Trust Company of New York, Brussels Office, as operator of the Euroclear System. "European Communities" means the European Economic Community, the European Coal and Steel Community and the European Atomic Energy Community. "Event of Default" has the meaning specified in Section 7.01. "Exchange Act" means the Securities Exchange Act of 1934, as amended from time to time, and any statute successor thereto. "Exchange Rate" shall have the meaning specified as contemplated in Section 3.01. "Exchange Rate Agent" shall have the meaning specified as contemplated in Section 3.01. "Exchange Rate Officer's Certificate" with respect to any date for the payment of principal of (and premium, if any) and interest on any series of Securities, means a Certificate setting forth the applicable Exchange Rate and the amounts payable in Dollars and Foreign Currencies in respect of the principal of (and premium, if any) and interest on Securities denominated in ECU, any other composite currency or Foreign Currency, and signed by the Chairman of the Board, a Vice Chairman of the Board, the President, any Vice President, the Treasurer or any Assistant Treasurer of the Company or the Exchange Rate Agent appointed pursuant to Section 3.01 and delivered to the Trustee. "Foreign Currency" means a currency issued by the government of any country other than the United States of America. "Global Exchange Date" has the meaning specified in Section 3.04(b)(iv). Page 6
"Global Security" means a Security issued to evidence all or a part of a series of Securities in accordance with Section 3.03. "Holder" with respect to a Registered Security, means a Person in whose name such Registered Security is registered in the Security Register and, with respect to a Bearer Security (or any temporary Global Security) or a coupon, means the bearer thereof. "interest", when used with respect to an Original Issue Discount Security which by its terms bears interest only after Maturity, means interest payable after Maturity. "Interest Payment Date", when used with respect to any series of Securities, means the Stated Maturity of an instalment of interest on such Securities. "Maturity", when used with respect to any Security, means the date on which the principal of such Security (or any instalment of principal) becomes due and payable as therein or herein provided, whether at the Stated Maturity or by declaration of acceleration, call for redemption or otherwise. "Officers' Certificate" means a certificate signed by the Chairman of the Board, the President, a Vice Chairman of the Board, or a Vice President, and by the Treasurer, an Assistant Treasurer, the Comptroller, an Assistant Comptroller, the Secretary or an Assistant Secretary of the Company, and delivered to the Trustee. Each such certificate shall contain the statements set forth in Section 1.02, if applicable. "Opinion of Counsel" means a written opinion of counsel, who may (except as otherwise expressly provided in this Indenture) be an employee of the Company, and who shall be reasonably acceptable to the Trustee. Each such opinion shall contain the statements set forth in Section 1.02, if applicable. "Original Issue Discount Security" means any Security which provides for an amount less than the principal amount thereof to be due and payable upon a declaration of acceleration of the Maturity thereof pursuant to Section 7.02. Page 7
"Outstanding", when used with respect to Securities or Securities of any series, means, as of the date of determination, all such Securities theretofore authenticated and delivered under this Indenture, except: (i) such Securities theretofore canceled by the Trustee or delivered to the Trustee for cancellation; (ii) such Securities for whose payment or redemption money in the necessary amount has been theretofore deposited with the Trustee or any Paying Agent (other than the Company) in trust or set aside and segregated in trust by the Company (if the Company shall act as its own Paying Agent) for the Holders of such Securities; provided that, if such Securities are to be redeemed, notice of such redemption has been duly given pursuant to this Indenture or provision therefor satisfactory to the Trustee has been made; and (iii) such Securities in lieu of which other Securities have been authenticated and delivered pursuant to Section 3.06 of this Indenture; provided, however, that in determining whether the Holders of the requisite principal amount of such Securities Outstanding have given any request, demand, authorization, direction, notice, consent or waiver hereunder or whether a quorum is present at a meeting of Holders of Securities, the principal amount of Original Issue Discount Securities that shall be deemed to be Outstanding for such purposes shall be the amount of the principal thereof that would be due and payable as of the date of such determination upon a declaration of acceleration of the Maturity thereof pursuant to Section 7.02, and Securities owned by the Company or any other obligor upon the Securities or any Affiliate of the Company or such other obligor shall be disregarded and deemed not to be Outstanding, except that, in determining whether the Trustee shall be protected in relying upon any such request, demand, authorization, direction, notice, consent or waiver, only Securities which a Responsible Officer of the Trustee actually knows to be so owned shall be disregarded. Securities so owned which have been pledged in good faith may be regarded as Outstanding if the pledgee establishes to the satisfaction of the Trustee the pledgee's right so to act with respect to such Securities and that the pledgee is not the Company or any other obligor upon the Securities or any Affiliate of the Company or such other obligor. Page 8
"Paying Agent" means any Person authorized by the Company to pay the principal of, premium, if any, or interest on any Securities or any coupons appertaining thereto on behalf of the Company. "Person" means any individual, corporation, partnership, joint venture, association, joint-stock company, trust, unincorporated organization or government or any agency or political subdivision thereof. "Place of Payment", when used with respect to the Securities of any series, means the place or places where, subject to the provisions of Section 5.02, the principal of (and premium, if any) and interest on the Securities of that series are payable as specified in accordance with Section 3.01. "Predecessor Security" of any particular Security means every previous Security evidencing all or a portion of the same debt as that evidenced by such particular Security; and for the purposes of this definition, any Security authenticated and delivered under Section 3.06 in lieu of a mutilated, destroyed, lost or stolen Security shall be deemed to evidence the same debt as the mutilated, destroyed, lost or stolen Security. "Principal Corporate Trust Office" means the office of the Trustee, at which at any particular time its corporate trust business shall be principally administered, which office at the date of execution of this instrument is at the address set forth in the first paragraph of this instrument. "Principal Paying Agent" means the Paying Agent, if any, designated as such by the Company pursuant to Section 3.01 of this Indenture. "Redemption Date", when used with respect to any Security to be redeemed, means the date fixed for such redemption by or pursuant to this Indenture. "Redemption Price", when used with respect to any Security to be redeemed, means the price specified in such Security at which it is to be redeemed pursuant to this Indenture. Page 9
"Registered Security" means any Security in the form established pursuant to Section 2.02 which is registered in the Security Register. "Regular Record Date" for the interest payable on any Security on any Interest Payment Date means the date, if any, specified in such Security as the "Regular Record Date". "Remarketing Entity", when used with respect to the Securities of any series which are repayable at the option of the Holders thereof before their Stated Maturity, means any Person designated by the Company to purchase any such Securities. "Repayment Date", when used with respect to any Security to be repaid upon exercise of option for repayment by the Holder, means the date fixed for such repayment pursuant to this Indenture. "Repayment Price", when used with respect to any Security to be repaid upon exercise of option for repayment by the Holder, means the price at which it is to be repaid pursuant to this Indenture. "Responsible Officer", when used with respect to the Trustee, means any officer of the Trustee with direct responsibility for the administration of this Indenture and also means, with respect to a particular corporate trust matter, any other officer of the Trustee to whom such matter is referred because of his knowledge of and familiarity with the particular subject. "Security" or "Securities" means any Security or Securities, as the case may be, authenticated and delivered under this Indenture; provided, however, that, if at any time there is more than one Person acting as Trustee under this Indenture, "Securities," with respect to any such Person, shall mean Securities authenticated and delivered under this Indenture, exclusive, however, of Securities of any series as to which such Person is not Trustee. "Security Register" has the meaning specified in Section 3.05. "Security Registrar" has the meaning specified in Section 3.05. Page 10
"Special Record Date" for the payment of any Defaulted Interest means the date fixed by the Trustee pursuant to Section 3.07. "Stated Maturity", when used with respect to any Security, or any installment of principal thereof or interest thereon, means the date specified in such Security as the fixed date on which the principal of such Security, or such installment of principal or interest, is due and payable. "Subsidiary of the Company" or "Subsidiary" means a corporation, at least a majority of the outstanding voting stock of which is owned, directly or indirectly, by the Company or by one or more Subsidiaries of the Company, or by the Company and one or more Subsidiaries of the Company. As used under this heading, the term "voting stock" means stock having ordinary voting power for the election of directors irrespective of whether or not stock of any other class or classes shall have or might have voting power by reason of the happening of any contingency. "Trustee" means the Person named as the "Trustee" in the first paragraph of this instrument until a successor Trustee shall have become such pursuant to the applicable provisions of this Indenture, and thereafter "Trustee" shall mean or include each Person who is then a Trustee hereunder, and if at any time there is more than one such Person, "Trustee" as used with respect to the Securities of any series shall mean the Trustee with respect to Securities of that series. "Trust Indenture Act" or "TIA" (except as herein otherwise expressly provided) means the Trust Indenture Act of 1939, as in force at the date as of which this instrument was executed, and, to the extent required by law, as amended. "United States" means the United States of America (including the States and the District of Columbia), its territories, its possessions and other areas subject to its jurisdiction. "United States Alien", except as otherwise provided in or pursuant to this Indenture, means any Person who, for United States Federal income tax purposes, is a foreign corporation, a nonresident alien individual, a Page 11
nonresident alien fiduciary of a foreign estate or trust, or a foreign partnership, one or more of the members of which is, for United States Federal income tax purposes, a foreign corporation, a nonresident alien individual or a nonresident alien fiduciary of a foreign estate or trust. "vice president", when used with respect to the Company or the Trustee, means any vice president, whether or not designated by a number or a word or words added before or after the title "vice president". SECTION 1.02. Compliance Certificates and Opinions. Upon any application or request by the Company to the Trustee to take any action under any provision of this Indenture, the Company shall furnish to the Trustee an Officers' Certificate stating that all conditions precedent, if any, provided for in this Indenture relating to the proposed action have been complied with and an Opinion of Counsel stating that in the opinion of such counsel all such conditions precedent, if any, have been complied with, except that in the case of any such application or request as to which the furnishing of such documents is specifically required by any provision of this Indenture relating to such particular application or request, no additional certificate or opinion need be furnished. Every certificate or opinion with respect to compliance with a condition or covenant provided for in this Indenture (except as otherwise expressly provided in this Indenture) shall include: (i) a statement that each individual signing such certificate or opinion has read such covenant or condition and the definitions herein relating thereto; (ii) a brief statement as to the nature and scope of the examination or investigation upon which the statements or opinions contained in such certificate or opinion are based; (iii) a statement that, in the opinion of each such individual, he has made such examination or investigation as is necessary to enable him to express an informed opinion as to whether or not such covenant or condition has been complied with; and Page 12
(iv) a statement as to whether, in the opinion of each such individual, such condition or covenant has been complied with. SECTION 1.03. Form of Documents Delivered to Trustee. In any case where several matters are required to be certified by, or covered by an opinion of, any specified Person, it is not necessary that all such matters be certified by, or covered by the opinion of, only one such Person, or that they be so certified or covered by only one document, but one such Person may certify or give an opinion with respect to some matters and one or more other such Persons as to other matters, and any such Person may certify or give an opinion as to such matters in one or several documents. Any certificate or opinion of an officer of the Company may be based, insofar as it relates to legal matters, upon a certificate or opinion of, or representations by, counsel, unless such officer knows, or in the exercise of reasonable care should know, that the certificate or opinion or representations with respect to the matters upon which his certificate or opinion is based are erroneous. Any such certificate or Opinion of Counsel may be based, insofar as it relates to factual matters, upon a certificate or opinion of, or representations by, an officer or officers of the Company stating that the information with respect to such factual matters is in the possession of the Company, unless such counsel knows, or in the exercise of reasonable care should know, that the certificate or opinion or representations with respect to such matters are erroneous. Where any Person is required to make, give or execute two or more applications, requests, consents, certificates, statements, opinions or other instruments under this Indenture, they may, but need not, be consolidated and form one instrument. SECTION 1.04. Acts of Holders. (i) Any request, demand, authorization, direction, notice, consent, waiver or other action provided by this Indenture to be given or taken by Holders or Holders of any series may be embodied in and evidenced by one or more instruments of substantially similar tenor signed by such Holders in person or by an agent duly appointed in writing. If Securities of a series are issuable in whole or in part as Bearer Securities, any request, demand, authorization, direction, notice, consent, Page 13
waiver or other action provided by this Indenture to be given or taken by Holders may, alternatively, be embodied in and evidenced by the record of Holders of Securities voting in favor thereof, either in person or by proxies duly appointed in writing, at any meeting of Holders of Securities duly called and held in accordance with the provisions of Article Fifteen, or a combination of such instruments and any such record. Except as herein otherwise expressly provided, such action shall become effective when such instrument or instruments or record or both are delivered to the Trustee, and, where it is hereby expressly required, to the Company. Such instrument or instruments and any such record (and the action embodied therein and evidenced thereby) are herein sometimes referred to as the "Act" of the Holders signing such instrument or instruments and so voting at any such meeting. Proof of execution of any such instrument or of a writing appointing any such agent, or the holding by any Person of a Security, shall be sufficient for any purpose of this Indenture and (subject to Section 8.01) conclusive in favor of the Trustee and the Company, if made in the manner provided in this Section. The record of any meeting of Holders of Securities shall be proved in the manner provided in Section 15.06. (ii) The fact and date of the execution by any Person of any such instrument or writing may be proved by the affidavit of a witness of such execution or by the certificate of any notary public or other officer authorized by law to take acknowledgments of deeds, certifying that the individual signing such instrument or writing acknowledged to him the execution thereof. Where such execution is by or on behalf of any legal entity other than an individual, such certificate or affidavit shall also constitute proof of the authority of the Person executing the same. The fact and date of the execution of any such instrument or writing, or the authority of the Person executing the same, may also be proved in any other manner which the Trustee deems sufficient. (iii) The ownership of Registered Securities shall be proved by the Security Register. (iv) The principal amount and serial numbers of Bearer Securities held by any Person, and the date of holding the same, may be proved by the production of such Bearer Securities or by a certificate executed, as depositary, by any trust company, bank or other depositary, wherever situated, if such certificate shall be deemed by Page 14
the Trustee to be satisfactory, showing that at the date therein mentioned such Person had on deposit with such depositary, or exhibited to it, the Bearer Securities therein described; or such facts may be proved by the certificate or affidavit of the Person holding such Bearer Securities, if such certificate or affidavit is deemed by the Trustee to be satisfactory. The Trustee and the Company may assume that such ownership of any Bearer Security continues until (1) another certificate or affidavit bearing a later date issued in respect of the same Bearer Security is produced, or (2) such Bearer Security is produced to the Trustee by some other Person, or (3) such Bearer Security is surrendered in exchange for a Registered Security, or (4) such Bearer Security is no longer Outstanding. (v) The fact and date of execution of any such instrument or writing, the authority of the Person executing the same and the principal amount and serial numbers of Bearer Securities held by the Person so executing such instrument or writing and the date of holding the same may also be proved in any other manner which the Trustee deems sufficient; and the Trustee may in any instance require further proof with respect to any of the matters referred to in this Section. (vi) Any request, demand, authorization, direction, notice, consent, waiver or other action by the Holder of any Security shall bind every future Holder of the same Security and the Holder of every Security issued upon the registration of transfer thereof or in exchange therefor or in lieu thereof, in respect of any action taken, suffered or omitted by the Trustee or the Company in reliance thereon, whether or not notation of such action is made upon such Security. (vii) For purposes of determining the principal amount of Outstanding Securities of any series the Holders of which are required, requested or permitted to give any request, demand, authorization, direction, notice, consent, waiver or take any other Act under the Indenture, each Security denominated in a Foreign Currency or composite currency shall be deemed to have the principal amount determined by the Exchange Rate Agent by converting the principal amount of such Security in the currency in which such Security is denominated into Dollars at the Exchange Rate as of the date such Act is delivered to the Trustee and, where it is hereby expressly required, to the Company, by Holders of the required aggregate principal amount of the Page 15
Outstanding Securities of such series (or, if there is no such rate on such date, such rate on the date determined as specified as contemplated in Section 3.01). (viii) The Company may, in the circumstances permitted by the Trust Indenture Act, set a record date for purposes of determining the identity of Holders of Securities of any series entitled to give any request, demand, authorization, direction, notice, consent, waiver or take any other Act, or to vote or consent to any action by vote or consent authorized or permitted to be given or taken by Holders of Securities of such series. If not set by the Company prior to the first solicitation of a Holder of Securities of such Series made by any Person in respect of any such action, or in the case of any such vote, prior to such vote, such record date shall be the later of 30 days prior to the first solicitation of such consent or the date of the most recent list of Holders of such Securities furnished to the Trustee pursuant to Section 6.01 prior to such solicitation. (ix) Without limiting the foregoing, a Holder entitled hereunder to take any action hereunder with regard to any particular Security may do so with regard to all or any part of the principal amount of such Security or by one or more duly appointed agents, each of which may do so pursuant to such appointment with regard to all or any part of such principal amount. Any notice given or action taken by a Holder or its agents with regard to different parts of such principal amount pursuant to this paragraph shall have the same effect as if given or taken by separate Holders of each such different part. (x) Without limiting the generality of the foregoing, unless otherwise specified pursuant to Section 3.01 or pursuant to one or more indentures supplemental hereto, a Holder, including a Depositary that is the Holder of a Global Security, may make, give or take, by a proxy or proxies duly appointed in writing, any request, demand, authorization, direction, notice, consent, waiver or other action provided in this Indenture to be made, given or taken by Holders, and a Depositary that is the Holder of a Global Security may provide its proxy or proxies to the beneficial owners of interests in any such Global Security through such Depositary's standing instructions and customary practices. Page 16
(xi) The Company may fix a record date for the purpose of determining the Persons who are beneficial owners of interests in any Global Security held by a Depositary entitled under the procedures of such Depositary to make, give or take, by a proxy or proxies duly appointed in writing, any request, demand, authorization, direction, notice, consent, waiver or other action provided in this Indenture to be made, given or taken by Holders. If such a record date is fixed, the Holders on such record date or their duly appointed proxy or proxies, and only such Persons, shall be entitled to make, give or take such request, demand, authorization, direction, notice, consent, waiver or other action, whether or not such Holders remain Holders after such record date. No such request, demand, authorization, direction, notice, consent, waiver or other action shall be valid or effective if made, given or taken more than 90 days after such record date. SECTION 1.05. Notices, etc., to Trustee and Company. Any request, demand, authorization, direction, notice, consent, waiver or Act of Holders or other document provided or permitted by this Indenture to be made upon, given or furnished to, or filed with: (i) the Trustee by any Holder or by the Company shall be sufficient for every purpose hereunder if made, given, furnished or filed in writing to or with the Trustee at its Principal Corporate Trust Office, Attention: Corporate Trustee Administration Department; or (ii) the Company by any Holder or by the Trustee shall be sufficient for every purpose hereunder (unless otherwise herein expressly provided) if in writing and mailed, first-class, postage prepaid, to the Company, to the attention of its Treasurer, addressed to it at the address of its principal office specified in the first paragraph of this Indenture or at any other address previously furnished in writing to the Trustee by the Company. SECTION 1.06. Notices to Holders; Waiver. Where this Indenture or any Security provides for notice to Holders of any event: (1) such notice shall be sufficiently given (unless otherwise herein or in such Security expressly provided) if in writing and mailed, first class, Page 17
postage prepaid, to each Holder of Registered Securities affected by such event, at his address as it appears in the Security Register, not later than the latest date, and not earlier than the earliest date, prescribed for the giving of such notice. (2) such notice shall be sufficiently given to Holders of Bearer Securities if published in an Authorized Newspaper in The City of New York and, if the Securities of such series are then listed on The International Stock Exchange of the United Kingdom and the Republic of Ireland Limited and such stock exchange shall so require, in London and, if the Securities of such series are then listed on the Luxembourg Stock Exchange and such stock exchange shall so require, in Luxembourg and, if the Securities of such series are then listed on any other stock exchange and such stock exchange shall so require, in any other required city outside the United States, or, if not practicable, elsewhere in Europe on a Business Day at least twice, the first such publication to be not earlier than the earliest date, and not later than the latest date, prescribed for the giving of such notice. In case by reason of the suspension of regular mail service or by reason of any other cause it shall be impracticable to give such notice to Holders of Registered Securities by mail, then such notification as shall be made with the approval of the Trustee shall constitute a sufficient notification for every purpose hereunder. In any case where notice to Holders of Registered Securities is given by mail, neither the failure to mail such notice, nor any defect in any notice so mailed, to any particular Holder of Registered Securities shall affect the sufficiency of such notice with respect to other Holders of Registered Securities or the sufficiency of any notice by publication to Holders of Bearer Securities given as provided above. In case by reason of the suspension of publication of any Authorized Newspaper or Authorized Newspapers or by reason of any other cause it shall be impracticable to publish any notice to Holders of Bearer Securities as provided above, then such notification to Holders of Bearer Securities as shall be given with the approval of the Trustee shall constitute sufficient notice to such Holders for every purpose hereunder. Neither the failure to give notice by publication to Holders of Bearer Securities as provided above, nor any defect in any notice so published, Page 18
shall affect the sufficiency of any notice mailed to Holders of Registered Securities as provided above. Where this Indenture provides for notice in any manner, such notice may be waived in writing by the Person entitled to receive such notice, either before or after the event, and such waiver shall be the equivalent of such notice. Waivers of notice by Holders shall be filed with the Trustee, but such filing shall not be a condition precedent to the validity of any action taken in reliance upon such waiver. SECTION 1.07. Language of Notices, etc. Any request, demand, authorization, direction, notice, consent, or waiver required or permitted under this Indenture shall be in the English language, except that any published notice may be in an official language of the country of publication. SECTION 1.08. Conflict with Trust Indenture Act. If and to the extent that any provision of this Indenture limits, qualifies or conflicts with the duties imposed by, or with another provision (an "incorporated provision") included in this Indenture by operation of, Sections 310 to 318, inclusive, of the TIA, such imposed duties or incorporated provision shall control. SECTION 1.09. Effect of Headings and Table of Contents. The Article and Section headings herein and the Table of Contents are for convenience only and shall not affect the construction hereof. SECTION 1.10. Successors and Assigns. All covenants and agreements in this Indenture by the Company shall bind its successors and assigns, whether so expressed or not. SECTION 1.11. Separability Clause. In case any provision in this Indenture or in the Securities shall be invalid, illegal or unenforceable, the validity, legality and enforceability of the remaining provisions shall not in any way be affected or impaired thereby. SECTION 1.12. Benefits of Indenture. Nothing in this Indenture or in the Securities, express or implied, shall give to any Person, other than the parties hereto and their successors hereunder and the Holders, any benefit or Page 19
any legal or equitable right, remedy or claim under this Indenture. SECTION 1.13. Legal Holidays. Unless otherwise provided as contemplated by Section 3.01 with respect to any series of Securities, in any case where any Interest Payment Date, Stated Maturity, Repayment Date or Redemption Date of any Security or any date on which any Defaulted Interest is proposed to be paid shall not be a Business Day at any Place of Payment, then (notwithstanding any other provisions of the Securities or this Indenture) payment of the principal of, premium, if any, or interest on any Securities need not be made at such Place of Payment on such date, but may be made on the next succeeding Business Day with the same force and effect as if made on the Interest Payment Date, Stated Maturity, Repayment Date or Redemption Date or on the date on which Defaulted Interest is proposed to be paid, and, if such payment is made, no interest shall accrue on such payment for the period from and after any such Interest Payment Date, Stated Maturity, Repayment Date or Redemption Date, or date on which Defaulted Interest is proposed to be paid, as the case may be. SECTION 1.14. Governing Law. This Indenture and the Securities shall be construed in accordance with and governed by the laws of the State of New York. ARTICLE TWO Security Forms SECTION 2.01. Forms Generally. All Securities and any related coupons shall have such appropriate insertions, omissions, substitutions and other variations as are required or permitted by this Indenture, and may have such letters, numbers or other marks of identification and such legends or endorsements placed thereon as may be required to comply with the rules of any securities exchange or as may, consistently herewith, be determined by the officers executing such Securities or coupons, as evidenced by their execution of the Securities or coupons. The Trustee's certificates of authentication shall be in substantially the form set forth in this Article. Unless otherwise provided as contemplated by Section 3.01 with respect to any series of Securities, the Page 20
Securities of each series shall be issuable in registered form without coupons. If so provided as contemplated by Section 3.01, the Securities of a series shall be issuable solely in bearer form, or in both registered form and bearer form. Unless otherwise specified as contemplated by Section 3.01, Securities in bearer form shall have interest coupons attached. The definitive Securities and coupons shall be printed, lithographed or engraved or produced by any combination of these methods on a steel engraved border or steel engraved borders or may be produced in any other manner, all as determined by the officers executing such Securities or coupons, as evidenced by their execution of such Securities or coupons. SECTION 2.02. Form of Securities. Each Security and coupon shall be in one of the forms approved from time to time by or pursuant to a Board Resolution or an indenture supplemental hereto. Upon or prior to the delivery of a Security or coupons in any such form to the Trustee for authentication, the Company shall deliver to the Trustee the following: (i) such indenture supplemental hereto or the Board Resolution by or pursuant to which such form of Security or coupons has been approved, certified by the Secretary or an Assistant Secretary of the Company; (ii) the Officers' Certificate required by Section 3.01 of this Indenture; (iii) the Company Order required by Section 3.03 of this Indenture; and (iv) the Opinion of Counsel required by Section 3.03 of this Indenture. If temporary Securities of any series are issued in global form as permitted by Section 3.04, the form thereof also shall be established as provided in this Section 2.02. Page 21
SECTION 2.03. Form of Trustee's Certificate of Authentication. TRUSTEE'S CERTIFICATE OF AUTHENTICATION This is one of the Securities of the series designated therein referred to in the within-mentioned Indenture. THE CHASE MANHATTAN BANK, as Trustee, by -------------------------- Authorized Officer SECTION 2.04. Global Securities. If Securities of a series are issuable in whole or in part in global form, as specified as contemplated by Section 3.01, then, notwithstanding clause (xii) of Section 3.01 and the provisions of Section 3.02, such Global Security shall represent such of the outstanding Securities of such series as shall be specified therein and may provide that it shall represent the aggregate amount of Outstanding Securities from time to time endorsed thereon and that the aggregate amount of Outstanding Securities represented thereby may from time to time be reduced or increased to reflect exchanges or increased to reflect the issuance of additional uncertificated securities of such series. Any endorsement of a Global Security to reflect the amount, or any increase or decrease in the amount, of Outstanding Securities represented thereby shall be made in such manner and upon instructions given by such Person or Persons as shall be specified therein or in the Company Order to be delivered to the Trustee pursuant to Section 3.03 or Section 3.04. Global Securities may be issued in either registered or bearer form and in either temporary or permanent form. Page 22
ARTICLE THREE The Securities SECTION 3.01. Title and Terms. The aggregate principal amount of Securities which may be authenticated and delivered under this Indenture is unlimited. The Securities may be issued up to the aggregate principal amount of Securities from time to time authorized by or pursuant to a Board Resolution. The Securities may be issued in one or more series. All Securities of each series issued under this Indenture shall in all respects be equally and ratably entitled to the benefits hereof with respect to such series without preference, priority or distinction on account of the actual time or times of the authentication and delivery or Maturity of the Securities of such series. There shall be established in or pursuant to a Board Resolution, and set forth in, or determined in the manner provided in, an Officers' Certificate, or established in one or more indentures supplemental hereto, prior to the issuance of Securities of any series: (i) the title of the Securities of the series (which shall distinguish the Securities of the series from all other Securities); (ii) any limit upon the aggregate principal amount or aggregate initial public offering price of the Securities of the series which may be authenticated and delivered under this Indenture (except for Securities authenticated and delivered upon registration of transfer of, or in exchange for, or in lieu of, other Securities of that series pursuant to this Article Three or Sections 4.07, 9.06 or 14.03); (iii) the priority of payment, if any, of the Securities; (iv) The price or prices (which may be expressed as a percentage of the aggregate principal amount thereof) at which the Securities will be issued; (v) the date or dates on which the principal and premium, if any, of the Securities of the series is payable; Page 23
(vi) the rate or rates at which the Securities of the series shall bear interest, if any, or the method or methods by which such rates may be determined, if any, the date or dates from which such interest shall accrue, the Interest Payment Dates on which such interest shall be payable, the Regular Record Date for the interest payable on any Interest Payment Date and the basis upon which interest shall be calculated if other than that of a 360-day year consisting of twelve 30-day months; (vii) the extent to which any of the Securities will be issuable in temporary or permanent global form, and in such case, the Depositary for such Global Security or Securities, the terms and conditions, if any, upon which such Global Security may be exchanged in whole or in part for definitive securities, and the manner in which any interest payable on a temporary or permanent Global Security will be paid, whether or not consistent with Section 3.04 or 3.05; (viii) the office or offices or agency where, subject to Section 5.02, the Securities may be presented for registration of transfer or exchange; (ix) the place or places where, subject to the provisions of Section 5.02, the principal of (and premium, if any) and interest, if any, on Securities of the series shall be payable; (x) the period or periods within which, the price or prices at which and the terms and conditions upon which Securities of the series may be redeemed, in whole or in part, at the option of the Company; (xi) the obligation, if any, of the Company to redeem or purchase Securities of the series pursuant to any sinking fund or analogous provisions or at the option of a Holder thereof and the period or periods within which, the price or prices at which and the terms and conditions upon which Securities of the series shall be redeemed or purchased, in whole or in part, pursuant to such obligation; (xii) if other than denominations of $1,000 and any integral multiple thereof, the denominations in which Registered Securities of the series shall be issuable; and, if other than $5,000 or any integral multiple Page 24
thereof, the denominations in which Bearer Securities of the series shall be issuable; (xiii) the currency or currencies of denominations of the Securities of any series, which may be in Dollars, any Foreign Currency or any composite currency, including but not limited to the ECU, and, if any such currency of denomination is a composite currency other than the ECU, the agency or organization, if any, responsible for overseeing such composite currency; (xiv) the currency or currencies in which payment of the principal of (and premium, if any) and interest on the Securities will be made, the currency or currencies, if any, in which payment of the principal of (and premium, if any) or the interest on Registered Securities, at the election of each of the Holders thereof, may also be payable and the periods within which and the terms and conditions upon which such election is to be made and the Exchange Rate and the Exchange Rate Agent; (xv) if the amount of payments of principal of (and premium, if any) or any interest on Securities of the series may be determined with reference to an index, the method or methods by which such amounts shall be determined; (xvi) whether Securities of the series are to be issuable as Registered Securities, Bearer Securities or both, whether Securities of the series are to be issuable with or without coupons or both and, in the case of Bearer Securities, the date as of which such Bearer Securities shall be dated if other than the date of original issuance of the first Security of such series of like tenor and term to be issued; (xvii) whether, and under what conditions, additional amounts will be payable to Holders of Securities of the series pursuant to Section 5.04; (xviii) whether any of the Securities will be issued as Original Issue Discount Securities and the portion of the principal amount of such Securities which shall be payable upon declaration of acceleration of the Maturity thereof pursuant to Section 7.02; Page 25
(xix) information with respect to book-entry procedures, if any; (xx) any addition to or change in the Events of Default or covenants of the Company pertaining to the Securities of the series; and (xxi) any other terms of the series. All Securities of any one series and the coupons appertaining to Bearer Securities of such series, if any, shall be substantially identical except, in the case of Registered Securities, as to denomination and except as may otherwise be provided in or pursuant to such Board Resolution and set forth, or determined in the manner provided, in such Officers' Certificate or in any such indenture supplemental hereto. Securities of any particular series may be issued at various times, with different dates on which the principal or any installment of principal is payable, with different rates of interest, if any, or different methods by which rates of interest may be determined, with different dates on which such interest may be payable and with different Redemption Dates or Repayment Dates and may be denominated in different currencies or payable in different currencies. Notwithstanding Section 3.01(ii) and unless otherwise expressly provided with respect to a series of Securities, the aggregate principal amount of a series of Securities may be increased and additional Securities of such series may be issued up to the maximum aggregate principal amount authorized with respect to such series as increased. SECTION 3.02. Denominations. The Securities of each series shall be issuable in such form and denominations as shall be specified as contemplated by Section 3.01. In the absence of any specification with respect to the Securities of any series, the Registered Securities of each series shall be issuable only as Securities without coupons in denominations of $1,000 and any integral multiple thereof and the Bearer Securities of each series, if any, shall be issuable with coupons and in denominations of $5,000 and any integral multiple thereof. Page 26
SECTION 3.03. Execution, Authentication, Delivery and Dating. The Securities shall be executed on behalf of the Company by its Chairman of the Board, its President, a Vice Chairman of the Board, or one of its Vice Presidents or its Treasurer and by its Secretary or one of its Assistant Secretaries. The signatures of any or all of these officers on the Securities may be manual or facsimile. Coupons shall bear the facsimile signature of the Company's Chairman of the Board, its President, a Vice Chairman of the Board, one of its Vice Presidents or the Treasurer. Securities and coupons bearing the manual or facsimile signatures of individuals who were at any time the proper officers of the Company shall bind the Company, notwithstanding that such individuals or any of them have ceased to hold such offices prior to the authentication and delivery of such Securities or did not hold such offices at the date of such Securities. At any time and from time to time after the execution and delivery of this Indenture, the Company may deliver Securities of any series, together with any coupons appertaining thereto, executed by the Company to the Trustee for authentication, together with a Company Order for the authentication and delivery of such Securities, and the Trustee shall, upon receipt of the Company Order, authenticate and deliver such Securities as in this Indenture provided and not otherwise; provided, however, that, in connection with its original issuance, no Bearer Security shall be mailed or otherwise delivered to any location in the United States; and provided further that a Bearer Security may be delivered in connection with its original issuance only if the Person entitled to receive such Bearer Security shall have delivered to the Trustee, or such other Person as shall be specified in a temporary Global Security delivered pursuant to Section 3.04, a certificate in the form required by Section 3.11(i). If the Company shall establish pursuant to Section 3.01 that the Securities of a series are to be issued in whole or in part in the form of one or more Global Securities in registered or permanent bearer form, then the Company shall execute and the Trustee shall, in accordance with this Section and a Company Order for the authentication and delivery of such Global Securities with respect to such series, authenticate and deliver one or more Global Securities in permanent or temporary form that (i) shall represent and shall be denominated in an aggregate amount Page 27
equal to the aggregate principal amount of the Outstanding Securities of such series to be represented by one or more Global Securities, (ii) shall be registered, if in registered form, in the name of the Depositary for such Global Security or Securities or the nominee of such Depositary, and (iii) shall be delivered by the Trustee to such Depositary or pursuant to such Depositary's instructions. Each Depositary designated pursuant to Section 3.01 for a Global Security in registered form must, at the time of its designation and at all times while it serves as Depositary, be a clearing agency registered under the Exchange Act and any other applicable statute or regulation. In authenticating such Securities, and accepting the additional responsibilities under this Indenture in relation to such Securities, the Trustee shall be entitled to receive, and (subject to Section 8.01) shall be fully protected in relying upon, an Opinion of Counsel complying with Section 1.02 and stating that: (i) the form of such Securities and coupons, if any, has been established in conformity with the provisions of this Indenture; (ii) the terms of such Securities and coupons, if any, or the manner of determining such terms, have been established in conformity with the provisions of this Indenture; (iii) that such Securities and coupons, when authenticated and delivered by the Trustee and issued by the Company in the manner and subject to any conditions specified in such Opinion of Counsel, will constitute valid and legally binding obligations of the Company, enforceable against the Company in accordance with their terms, subject to bankruptcy, insolvency, reorganization, fraudulent transfer, moratorium and other laws of general applicability relating to or affecting the enforcement of creditors' rights and to general principles of equity; and (iv) such other matters as the Trustee may reasonably request. Page 28
The Trustee shall not be required to authenticate such Securities if the issue thereof will adversely affect the Trustee's own rights, duties or immunities under the Securities and this Indenture or otherwise in a manner which is not reasonably acceptable to the Trustee. Notwithstanding the provisions of Section 3.01 and of this Section 3.03, if all Securities of a series are not to be originally issued at one time, it shall not be necessary to deliver the Board Resolution or Officers' Certificate otherwise required pursuant to Section 3.01 or the Company Order and Opinion of Counsel otherwise required pursuant to this Section 3.03 at or prior to the time of authentication of each Security of such series if such documents are delivered at or prior to the authentication upon original issuance of the first Security of such series to be issued and such documents reasonably contemplate the issuance of all Securities of such series; provided that any subsequent request by the Company to the Trustee to authenticate Securities of such series upon original issuance shall constitute a representation and warranty by the Company that as of the date of such request, the statements made in the Officers' Certificate or other certificates delivered pursuant to Sections 1.02 and 3.01 shall be true and correct as if made on such date. A Company Order, Officers' Certificate or Board Resolution or supplemental indenture delivered by the Company to the Trustee in the circumstances set forth in the preceding paragraph may provide that Securities which are the subject thereof will be authenticated and delivered by the Trustee or its agent on original issue from time to time in the aggregate principal amount, if any, established for such series pursuant to such procedures acceptable to the Trustee as may be specified from time to time by Company Order upon telephonic (promptly confirmed in writing), electronic or written order of Persons designated in such Company Order, Officers' Certificate, supplemental indenture or Board Resolution and that such Persons are authorized to determine, consistent with such Company Order, Officers' Certificate, supplemental indenture or Board Resolution, such terms and conditions of said Securities as are specified in such Company Order, Officers' Certificate, supplemental indenture or Board Resolution. Each Registered Security shall be dated the date of its authentication; and unless otherwise specified as contemplated by Section 3.01, each Bearer Security and any Page 29
temporary Global Security referred to in Section 3.04 shall be dated as of the date of original issuance of such Security. No Security or coupon appertaining thereto shall be entitled to any benefit under this Indenture or be valid or obligatory for any purpose, unless there appears on such Security a certificate of authentication substantially in the form provided for herein executed by the Trustee by manual signature of an authorized officer, and such certificate upon any Security shall be conclusive evidence, and the only evidence, that such Security has been duly authenticated and delivered hereunder. Except as permitted by Section 3.06, the Trustee shall not authenticate and deliver any Bearer Security unless all appurtenant coupons for interest then matured have been detached and canceled. Notwithstanding the foregoing, if any Security or portion thereof shall have been duly authenticated and delivered hereunder but never issued and sold by the Company, and the Company shall deliver such Security to the Trustee for cancellation as provided in Section 3.09 together with a written statement (which need not comply with Section 1.02 and need not be accompanied by an Opinion of Counsel) stating that such Security or portion thereof has never been issued and sold by the Company, for all purposes of this Indenture such Security shall be deemed never to have been authenticated and delivered hereunder and shall never be entitled to the benefits of this Indenture. SECTION 3.04. Temporary Securities. (a) Pending the preparation of definitive Securities of any series, the Company may execute, and upon Company Order and the receipt of the certifications and opinions required under Sections 3.01 and 3.03, the Trustee shall authenticate and deliver, temporary Securities which are printed, lithographed, typewritten, mimeographed or otherwise produced, in any authorized denominations, substantially of the tenor of the definitive Securities in lieu of which they are issued in registered form or, if authorized, in bearer form with one or more coupons or without coupons, and with such appropriate insertions, omissions, substitutions and other variations as the officers executing such Securities may determine, as evidenced by their execution of such Securities. In the case of any series which may be issuable as Bearer Securities, such temporary Securities may be in global form, representing such of the Outstanding Securities of such series as shall be specified therein. Page 30
(b) Unless otherwise provided pursuant to Section 3.01: (i) Except in the case of temporary Securities in global form, each of which shall be exchanged in accordance with the provisions of the following paragraphs, if temporary Securities of any series are issued, the Company will cause definitive Securities of such series to be prepared without unreasonable delay. After the preparation of definitive Securities, the temporary Securities of such series shall be exchangeable for definitive Securities of such series upon surrender of the temporary Securities of such series at the office or agency of the Company in a Place of Payment for that series, without charge to the Holder. Upon surrender for cancellation of any one or more temporary Securities of any series (accompanied, if applicable, by all unmatured coupons and all matured coupons in default appertaining thereto), the Company shall execute and the Trustee shall authenticate and deliver in exchange therefor a like principal amount of definitive Securities of such series of authorized denominations; provided, however, that no definitive Bearer Security shall be delivered in exchange for a temporary Registered Security; and provided further that a definitive Bearer Security shall be delivered in exchange for a temporary Bearer Security only in compliance with the conditions set forth in the provisions of the third paragraph of Section 3.03. Until so exchanged, the temporary Securities of any series shall in all respects be entitled to the same benefits under this Indenture as definitive Securities of such series. (ii) If temporary Securities of any series are issued in global form, any such temporary Global Security shall, unless otherwise provided in such temporary Global Security, be delivered to the London office of a depositary or common depositary (the "Common Depositary"), for the benefit of the operator of Euroclear and CEDEL S.A., for credit to the respective accounts of the beneficial owners of such Securities (or to such other accounts as they may direct). Upon receipt of written instructions (which need not comply with Section 1.02) signed on behalf of the Company by any Person authorized to give such instructions, the Trustee or any Authenticating Agent shall endorse such temporary Global Security to reflect Page 31
the initial principal amount, or an increase in the principal amount, of Outstanding Securities represented thereby. Until such initial endorsement, such temporary Global Security shall not evidence any obligation of the Company. Such temporary Global Security shall at any time represent the aggregate principal amount of Outstanding Securities theretofore endorsed thereon as provided above, subject to reduction to reflect exchanges as described below. (iii) Unless otherwise specified in such temporary Global Security, and subject to the second proviso in the following paragraph, the interest of a beneficial owner of Securities of a series in a temporary Global Security shall be exchanged for definitive Securities (including a definitive global Bearer Security) of such series and of like tenor following the Global Exchange Date (as defined below) when the account holder instructs Euroclear or CEDEL S.A., as the case may be, to request such exchange on his behalf and delivers to Euroclear or CEDEL S.A., as the case may be, a certificate in the form required by Section 3.11(i), dated no earlier than 15 days prior to the Global Exchange Date, copies of which certificate shall be available from the offices of Euroclear and CEDEL S.A., the Trustee, any Authenticating Agent appointed for such series of Securities and each Paying Agent. Unless otherwise specified in such temporary Global Security, any such exchange shall be made free of charge to the beneficial owners of such temporary Global Security, except that a Person receiving definitive Securities must bear the cost of insurance, postage, transportation and the like in the event that such Person does not take delivery of such definitive Securities in person at the offices of Euroclear or CEDEL S.A. Definitive Securities in bearer form to be delivered in exchange for any portion of a temporary Global Security shall be delivered only outside the United States. (iv) Without unnecessary delay but in any event not later than the date specified in, or determined pursuant to the terms of, any such temporary Global Security as the "Global Exchange Date" (the "Global Exchange Date"), the Company shall deliver to the Trustee, or, if the Trustee appoints an Authenticating Agent pursuant to Section 8.14, to any such Authenticating Agent, definitive Securities in Page 32
aggregate principal amount equal to the principal amount of such temporary Global Security, executed by the Company. Unless otherwise specified as contemplated by Section 3.01, such definitive Securities shall be in the form of Bearer Securities or Registered Securities, or any combination thereof, as may be specified by the Company, the Trustee or any such Authenticating Agent, as may be appropriate. On or after the Global Exchange Date, such temporary Global Security shall be surrendered by the Common Depositary to the Trustee or any such Authenticating Agent, as the Company's agent for such purpose, to be exchanged, in whole or from time to time in part, for definitive Securities without charge and the Trustee or any such Authenticating Agent shall authenticate and deliver, in exchange for each portion of such temporary Global Security, an equal aggregate principal amount of definitive Securities of the same series, of authorized denominations and of like tenor as the portion of such temporary Global Security to be exchanged, which, except as otherwise specified as contemplated by Section 3.01, shall be in the form of Bearer Securities or Registered Securities, or any combination thereof; provided, however, that, unless otherwise specified in such temporary Global Security, upon such presentation by the Common Depositary, such temporary Global Security is accompanied by a certificate dated the Global Exchange Date or a subsequent date and signed by Euroclear as to the portion of such temporary Global Security held for its account then to be exchanged and a certificate dated the Global Exchange Date or a subsequent date and signed by CEDEL S.A., as to the portion of such temporary Global Security held for its account then to be exchanged, each in the form required by Section 3.11(ii); and provided further that a definitive Bearer Security (including a definitive global Bearer Security) shall be delivered in exchange for a portion of a temporary Global Security only in compliance with the conditions set forth in the provisions of the third paragraph of Section 3.03. (v) Upon any exchange of a portion of any such temporary Global Security, such temporary Global Security shall be endorsed by the Trustee or any such Authenticating Agent, as the case may be, to reflect the reduction of the principal amount evidenced thereby, whereupon its remaining principal amount shall be reduced for all purposes by the amount so exchanged. Page 33
Until so exchanged in full, such temporary Global Security shall in all respects be entitled to the same benefits under this Indenture as definitive Securities of such series authenticated and delivered hereunder, except that, unless otherwise specified as contemplated by Section 3.01, interest payable on such temporary Global Security on an Interest Payment Date for Securities of such series occurring prior to the applicable Global Exchange Date shall be payable, without interest, to Euroclear and CEDEL S.A. on or after such Interest Payment Date upon delivery by Euroclear and CEDEL S.A. to the Trustee or the Paying Agent, as the case may be, of a certificate or certificates in the form required by Section 3.11(iii), for credit on or after such Interest Payment Date to the respective accounts of the Persons who are the beneficial owners of such temporary Global Security on such Interest Payment Date and who have each delivered to Euroclear or CEDEL S.A., as the case may be, a certificate in the form required by Section 3.11(iv). Any interest so received by Euroclear and CEDEL S.A. and not paid as herein provided prior to the Global Exchange Date shall be returned to the Trustee or Paying Agent, as the case may be, which, upon expiration of two years after such Interest Payment Date, shall repay such interest to the Company on Company Request in accordance with Section 5.03. SECTION 3.05. Registration, Registration of Transfer and Exchange. With respect to Registered Securities, the Company shall keep or cause to be kept a register (sometimes referred to as the "Security Register") in which, subject to such reasonable regulations as it may prescribe, the Company shall provide for the registration of Registered Securities and the registration of transfers of Registered Securities and the Company shall appoint a "Security Registrar", and may appoint any "Co-Security Registrar" as may be appropriate, to keep the Security Register. Such Security Register shall be in written form or in any other form capable of being converted into written form within a reasonable time. At all reasonable times the information contained in such Security Register shall be available for inspection by the Trustee at the office of the Security Registrar. In the event that any Registered Securities issued hereunder have The City of New York as a Place of Payment, the Company shall appoint either a Security Registrar or Co-Security Registrar located in The City of New York. Page 34
Upon surrender for registration of transfer of any Registered Security of any series at the office or agency of the Company maintained pursuant to Section 5.02 for such purpose in a Place of Payment for such series, the Company shall execute, and the Trustee shall authenticate and deliver, in the name of the designated transferee or transferees, one or more new Registered Securities of such series of any authorized denominations and of a like aggregate principal amount, tenor and Stated Maturity. At the option of the Holder, Registered Securities of any series may be exchanged for other Registered Securities of such series, of any authorized denominations and of like aggregate principal amount, tenor and Stated Maturity, upon surrender of the Securities to be exchanged at such office or agency. Whenever any Securities are so surrendered for exchange, the Company shall execute, and the Trustee shall authenticate and deliver, the Securities which the Holder making the exchange is entitled to receive. Registered Securities may not be exchanged for Bearer Securities. At the option of the Holder, Bearer Securities of any series may be exchanged for Registered Securities of the same series of any authorized denominations and of a like aggregate principal amount and tenor, upon surrender of the Bearer Securities to be exchanged at any such office or agency, with all unmatured coupons and all matured coupons in default thereto appertaining. If the Holder of a Bearer Security is unable to produce any such unmatured coupon or coupons or matured coupon or coupons in default, such exchange may be effected if the Bearer Securities are accompanied by payment in funds acceptable to the Company in an amount equal to the face amount of such missing coupon or coupons, or the surrender of such missing coupon or coupons may be waived by the Company and the Trustee if there be furnished to them such security or indemnity as they may require to save each of them and any Paying Agent harmless. If thereafter the Holder of such Security shall surrender to any Paying Agent any such missing coupon in respect of which such a payment shall have been made, such Holder shall be entitled to receive the amount of any such payment from the Company; provided, however, that interest represented by coupons shall be payable only upon presentation and surrender of those coupons at an office or agency of a Paying Agent, maintained pursuant to Section 5.02 for such purpose, located outside the United States. Notwithstanding Page 35
the foregoing, in case a Bearer Security of any series is surrendered at any such office or agency in exchange for a Registered Security of the same series and like tenor after the close of business at such office or agency on (i) any Regular Record Date and before the opening of business at such office or agency on the relevant Interest Payment Date, or (ii) any Special Record Date and before the opening of business at such office or agency on the related date for payment of Defaulted Interest, such Bearer Security shall be surrendered without the coupon relating to such Interest Payment Date or proposed date for payment, as the case may be. Notwithstanding any other provision of this Section, unless and until it is exchanged in whole or in part for individual Securities represented thereby, a Global Security representing all or a portion of the Securities of a series may not be transferred except as a whole by the Depositary for such series to a nominee of such Depositary or by a nominee of such Depositary to such Depositary or another nominee of such Depositary or by such Depositary or any such nominee to a successor Depositary for such series or a nominee of such successor Depositary. Whenever any Securities are so surrendered for exchange, the Company shall execute, and the Trustee shall authenticate and deliver, the Securities which the Holder making the exchange is entitled to receive. If at any time the Depositary for the Securities of a series notifies the Company that it is unwilling or unable to continue as Depositary for the Securities of such series or if at any time the Depositary for the Securities of such series shall no longer be eligible under Section 3.03, the Company shall appoint a successor Depositary with respect to the Securities of such series. If a successor Depositary for the Securities of such series is not appointed by the Company within 90 days after the Company receives such notice or becomes aware of such ineligibility, the Company's election pursuant to Section 3.01(vii) shall no longer be effective with respect to the Securities of such series and the Company will execute, and the Trustee, upon receipt of a Company Order for the authentication and delivery of definitive Securities of such series, will authenticate and deliver Securities of such series of like tenor and terms in definitive form in an aggregate principal amount equal to the principal amount of Page 36
the Global Security or Securities representing such series in exchange for such Global Security or Securities. The Company may at any time and in its sole discretion determine that the Securities of any series issued in the form of one or more Global Securities shall no longer be represented by such Global Security or Securities. In such event, the Company will execute, and the Trustee, upon receipt of a Company Order for the authentication and delivery of definitive Securities of such series, will authenticate and deliver, Securities of such series of like tenor and terms in definitive form in an aggregate principal amount equal to the principal amount of the Global Security or Securities representing such series in exchange for such Global Security or Securities. If specified by the Company pursuant to Section 3.01 with respect to a series of Securities, the Depositary for such series of Securities may surrender a Global Security for such series of Securities in exchange in whole or in part for Securities of such series of like tenor and terms and in definitive form on such terms as are acceptable to the Company, the Trustee and such Depositary. Thereupon, the Company shall execute, and the Trustee upon receipt of a Company Order for the authentication and delivery of definitive Securities of such series, shall authenticate and deliver, without service charge: (a) to the Depositary or to each Person specified by such Depositary a new Security or Securities of the same series, of like tenor and terms and of any authorized denomination as requested by such Person in aggregate principal amount equal to and in exchange for such Person's beneficial interest in the Global Security; and (b) to such Depositary a new Global Security of like tenor and terms and in an authorized denomination equal to the difference, if any, between the principal amount of the surrendered Global Security and the aggregate principal amount of Securities delivered to Holders thereof. In any exchange provided for in any of the preceding three paragraphs, the Company will execute and the Trustee, pursuant to a Company Order, will authenticate and deliver, Securities (a) in definitive registered form in authorized denominations, if the Securities of such series Page 37
are issuable as Registered Securities, (b) in definitive bearer form in authorized denominations, with coupons attached, if the Securities of such series are issuable as Bearer Securities or (c) as either Registered or Bearer Securities, if the Securities of such series are issuable in either form; provided, however, that no definitive Bearer Security shall be delivered in exchange for a temporary Global Security other than in accordance with the provisions of Sections 3.03 and 3.04. Upon the exchange of Global Securities for Securities in definitive form, such Global Securities shall be canceled by the Trustee. Registered Securities issued in exchange for a Global Security pursuant to this Section 3.05 shall be registered in such names and in such authorized denominations, and delivered to such addresses, as the Depositary for such Global Security, pursuant to instructions from its direct or indirect participants or otherwise, shall instruct the Trustee in writing. The Trustee shall deliver such Registered Securities to the Persons in whose names such Securities are so registered or to the Depositary. The Trustee shall deliver Bearer Securities issued in exchange for a Global Security pursuant to this Section 3.05 to the Depositary or to the Persons at such addresses, and in such authorized denominations, as the Depositary for such Global Security, pursuant to instructions from its direct or indirect participants or otherwise, shall instruct the Trustee in writing; provided, however, that no definitive Bearer Security shall be delivered in exchange for a temporary Global Security other than in accordance with the provisions of Sections 3.03 and 3.04. All Securities issued upon any registration of transfer or exchange of Securities shall be the valid obligations of the Company, evidencing the same debt, and entitled to the same benefits under this Indenture, as the Securities surrendered upon such registration of transfer or exchange. Every Security presented or surrendered for registration of transfer or exchange shall (if so required by the Company or the Security Registrar) be duly endorsed, or be accompanied by a written instrument of transfer in form satisfactory to the Company and the Security Registrar duly executed, by the Holder thereof or his attorney duly authorized in writing. Page 38
Unless otherwise provided in the Securities to be registered for transfer or exchanged, no service charge shall be made for any registration of transfer or exchange of Securities, but the Company may (unless otherwise provided in such Securities) require payment of a sum sufficient to cover any tax or other governmental charge that may be imposed in connection with any registration of transfer or exchange of Securities, other than exchanges expressly provided in this Indenture to be made at the Company's own expense or without expense or without charge to the Holders. Neither the Company, the Security Registrar nor any Co-Security Registrar shall be required (i) to issue, register the transfer of or exchange any Securities of any series during a period beginning at the opening of business 15 days before the day of selection of Securities of such series to be redeemed and ending at the close of business on (A) if Securities of the series are issuable only as Registered Securities, the day of the mailing of the relevant notice of redemption of Registered Securities of such series so selected for redemption or (B) if Securities of the series are issuable as Bearer Securities, the day of the first publication of the relevant notice of redemption or, if Securities of the series are also issuable as Registered Securities and there is no publication, the mailing of the relevant notice of redemption, or (ii) to register the transfer or exchange of any Securities or portions thereof so selected for redemption. Notwithstanding anything herein to the contrary, the exchange of Bearer Securities into Registered Securities shall be subject to applicable laws and regulations in effect at the time of exchange; none of the Company, the Trustee nor the Security Registrar shall exchange any Bearer Securities into Registered Securities if it has received an Opinion of Counsel that as a result of such exchanges the Company would suffer adverse consequences under the United States Federal income tax laws and regulations then in effect and the Company has delivered to the Trustee a Company Order directing the Trustee not to make such exchanges unless and until the Trustee receives a subsequent Company Order to the contrary. The Company shall deliver copies of such Company Orders to the Security Registrar. SECTION 3.06. Mutilated, Destroyed, Lost and Stolen Securities. If (i) any mutilated Security or Security with a mutilated coupon is surrendered to the Page 39
Trustee or the Security Registrar, or if the Company, the Trustee and the Security Registrar receive evidence to their satisfaction of the destruction, loss or theft of any Security or coupon and (ii) there is delivered to the Company, the Trustee and the Security Registrar such security or indemnity as may be required by them to save each of them harmless, then, in the absence of notice to the Company, the Trustee or the Security Registrar that such Security has been acquired by a bona fide purchaser, the Company shall execute and upon its request the Trustee shall authenticate and deliver, in lieu of any such mutilated, destroyed, lost or stolen Security or in exchange for the Security to which a mutilated, destroyed, lost or stolen coupon appertains (with all appurtenant coupons not mutilated, destroyed, lost or stolen), a new Security of the same series and Stated Maturity and of like tenor and principal amount, bearing a number not contemporaneously outstanding and, if applicable, with coupons corresponding to the coupons appertaining thereto; provided, however, that any new Bearer Security will be delivered only in compliance with the conditions set forth in Section 3.05. In case any such mutilated, destroyed, lost or stolen Security or coupon has become or is about to become due and payable, the Company in its discretion may, instead of issuing a new Security, pay such Security; provided, however, that payment of principal of (and premium, if any) and any interest on Bearer Securities shall be payable only at an office or agency located outside the United States, and, in the ease of interest, unless otherwise specified as contemplated by Section 3.01, only upon presentation and surrender of the coupons appertaining thereto. Upon the issuance of any new Security under this Section, the Company may require the payment of a sum sufficient to cover any tax or other governmental charge that may be imposed in relation thereto and any other expenses (including the fees and expenses of the Trustee) connected therewith. Every new Security of any series, with its coupons, if any, issued pursuant to this Section in lieu of any destroyed, lost or stolen Security, or in exchange for a Security with a destroyed, lost or stolen coupon, shall constitute an original additional contractual obligation of the Company, whether or not the destroyed, lost or stolen Security and its coupons, if any, or the destroyed, lost or Page 40
stolen coupon shall be at any time enforceable by anyone, and shall be entitled to all the benefits of this Indenture equally and proportionately with any and all other Securities of the same series and their coupons, if any, duly issued hereunder. The provisions of this Section are exclusive and shall preclude (the extent lawful) all other rights and remedies with respect to the replacement or payment of mutilated, destroyed, lost or stolen Securities or coupons. SECTION 3.07. Payment of Interest; Interest Rights Preserved. Unless otherwise provided as contemplated by Section 3.01, interest on any Registered Security which is payable, and is punctually paid or duly provided for, on any Interest Payment Date shall unless otherwise provided in such Security be paid to the Person in whose name that Security (or one or more Predecessor Securities) is registered at the close of business on the Regular Record Date for such interest. Unless otherwise specified as contemplated by Section 3.01, in case a Bearer Security of any series is surrendered in exchange for a Registered Security of such series after the close of business (at an office or agency referred to in Section 3.05) on any Regular Record Date and before the opening of business (at such office or agency) on the next succeeding Interest Payment Date, such Bearer Security shall be surrendered without the coupon relating to such Interest Payment Date and interest will not be payable on such Interest Payment Date in respect of the Registered Security issued in exchange for such Bearer Security, but will be payable only to the Holder of such coupon when due in accordance with the provisions of this Indenture. At the option of the Company, payment of interest on any Registered Security may be made by check in the currency designated for such payment pursuant to the terms of such Registered Security mailed to the address of the Person entitled thereto as such address shall appear in the Security Register or by wire transfer to an account in such currency designated by such Person in writing not later than ten days prior to the date of such payment. Any interest on any Registered Security which is payable, but is not punctually paid or duly provided for, on any Interest Payment Date (herein called "Defaulted Interest") shall forthwith cease to be payable to the Holder on the relevant Regular Record Date by virtue of his having been such Holder, and such Defaulted Interest may be paid by Page 41
the Company, at its election in each case, as provided in clause (i) or clause (ii) below. (i) The Company may elect to make payments of any Defaulted Interest to the Persons in whose names any such Registered Securities (or their respective Predecessor Securities) are registered at the close of business on a Special Record Date for the payment of such Defaulted Interest, which shall be fixed in the following manner. The Company shall notify the Trustee in writing of the amount of Defaulted Interest proposed to be paid on each Registered Security and the date of the proposed payment, and at the same time the Company shall deposit with the Trustee an amount of money equal to the aggregate amount proposed to be paid in respect of such Defaulted Interest or shall make arrangements satisfactory to the Trustee for such deposit prior to the date of the proposed payment, such money when deposited to be held in trust for the benefit of the Persons entitled to such Defaulted Interest as in this clause provided. Thereupon the Trustee shall fix a Special Record Date for the payment of such Defaulted Interest which shall be not more than 15 nor less than 10 days prior to the date of the proposed payment and not less than 10 days after the receipt by the Trustee of the notice of the proposed payment. The Trustee shall promptly notify the Company of such Special Record Date and, in the name and at the expense of the Company, shall cause notice of the proposed payment of such Defaulted Interest and the Special Record Date therefor to be mailed, first class, postage prepaid, to each Holder at his address as it appears in the Security Register, not less than 10 days prior to such Special Record Date. Notice of the proposed payment of such Defaulted Interest and the Special Record Date therefor having been mailed as aforesaid, such Defaulted Interest shall be paid to the Persons in whose names such Registered Securities (or their respective Predecessor Securities) are registered on such Special Record Date and shall no longer be payable pursuant to the following clause (ii). In case a Bearer Security of any series is surrendered at the office or agency in a Place of Payment for such series in exchange for a Registered Security of such series after the close of business at such office or agency on any Special Record Date and before the opening of business at such office or agency on the related proposed date of payment of Defaulted Interest, such Page 42
Bearer Security shall be surrendered without the coupon relating to such proposed date for payment and Defaulted Interest will not be payable on such proposed date for payment in respect of the Registered Security issued in exchange for such Bearer Security, but will be payable only to the Holder of such coupon when due in accordance with the provisions of this Indenture. (ii) The Company may make payment of any Defaulted Interest in any other lawful manner not inconsistent with the requirements of any securities exchange on which the Securities with respect to which there exists such default may be listed, and upon such notice as may be required by such exchange, if, after notice given by the Company to the Trustee of the proposed payment pursuant to this clause, such payment shall be deemed practicable by the Trustee. Subject to the foregoing provisions of this Section, each Security delivered under this Indenture upon registration of transfer of, or in exchange for, or in lieu of, any other Security shall carry the rights to interest accrued and unpaid, and to accrue, which were carried by such other Security. Subject to the limitations set forth in Section 5.02, the Holder of any coupon appertaining to a Bearer Security shall be entitled to receive the interest payable on such coupon upon presentation and surrender of such coupon on or after the Interest Payment Date of such coupon at an office or agency maintained for such purpose pursuant to Section 5.02. SECTION 3.08. Persons Deemed Owners. Title to any Bearer Security, any coupons appertaining thereto and any temporary Global Security shall pass by delivery. Prior to due presentment for registration of transfer of any Registered Security, the Company, the Trustee and any agent of the Company or the Trustee may treat the Person in whose name such Security is registered as the owner of such Security for the purpose of receiving payment of principal of, premium, if any, and (subject to Section 3.07) interest on such Security, and for all purposes whatsoever, whether or not such Security be overdue, and neither the Company, the Trustee nor any agent of the Company or the Trustee shall be affected by notice to the contrary. Page 43
The Company, the Trustee and any agent of the Company or the Trustee may treat the bearer of any Bearer Security and the bearer of any coupon as the absolute owner of such Security or coupon for the purpose of receiving payment thereof or on account thereof and for all other purposes whatsoever, whether or not such Security or coupon be overdue, and neither the Company, the Trustee nor any agent of the Company or the Trustee shall be affected by notice to the contrary. None of the Company, the Trustee, any Paying Agent, any Authenticating Agent or the Security Registrar will have the responsibility or liability for any aspect of the records relating to or payments made on account of beneficial ownership interest of a Global Security or for maintaining, supervising or reviewing any records relating to such beneficial ownership interest, and they shall be fully protected in acting or refraining from acting on any such information provided by the Depositary. SECTION 3.09. Cancellation. Unless otherwise provided with respect to a series of Securities, all Securities and coupons surrendered for payment, registration of transfer, exchange, repayment or redemption shall, if surrendered to any Person other than the Trustee, be delivered to the Trustee. All Securities so delivered or surrendered directly to the Trustee for any such purpose shall be promptly cancelled by it. The Company may at any time deliver to the Trustee for cancellation any Securities previously authenticated and delivered hereunder which the Company may have acquired in any manner whatsoever, and all Securities so delivered shall be promptly cancelled by the Trustee. No Securities shall be authenticated in lieu of or in exchange for any Securities cancelled as provided in this Section, except as expressly permitted by this Indenture or such Securities. All cancelled Securities or coupons held by the Trustee shall be disposed of by the Trustee in accordance with its customary procedures and the Trustee shall deliver a certificate of such disposition to the Company. SECTION 3.10. Computation of Interest. Interest on the Securities of each series shall be computed as shall be specified as contemplated by Section 3.01. Page 44
SECTION 3.11. Form of Certification. Unless otherwise provided pursuant to Section 3.01: (i) Whenever any provision of this Indenture or the forms of Securities contemplate that certification be given by a Person entitled to receive a Bearer Security, such certification shall be provided substantially in the form of Exhibit A hereto, with only such changes as shall be approved by the Company. (ii) Whenever any provision of this Indenture or the forms of Securities contemplate that certification be given by Euroclear and CEDEL S.A. in connection with the exchange of a portion of a temporary Global Security, such certification shall be provided substantially in the form of Exhibit B hereto, with only such changes as shall be approved by the Company. (iii) Whenever any provision of the Indenture or the forms of Securities contemplate that certification be given by Euroclear and CEDEL S.A. in connection with payment of interest with respect to a temporary Global Security prior to the related Global Exchange Date, such certification shall be provided substantially in the form of Exhibit C hereto, with only such changes as shall be approved by the Company. (iv) Whenever any provision of the Indenture or the forms of Securities contemplate that certification be given by a beneficial owner of a portion of a temporary Global Security in connection with payment of interest with respect to a temporary Global Security prior to the related Global Exchange Date, such certification shall be provided substantially in the form of Exhibit D hereto, with only such changes as shall be approved by the Company. SECTION 3.12. Judgments. The Company may provide, pursuant to Section 3.01, for the Securities of any series that, to the fullest extent possible under applicable law and except as may otherwise be specified as contemplated in Section 3.01, (a) the obligation, if any, of the Company to pay the principal of (and premium, if any) and interest on the Securities of any series and any appurtenant coupons in a Foreign Currency, composite currency or Dollars (the "Designated Currency") as may be specified pursuant to Section 3.01 is of the essence and agrees that judgments in respect of such Securities shall be given in the Designated Page 45
Currency; (b) the obligation of the Company to make payments in the Designated Currency of the principal of (and premium, if any) and interest on such Securities and any appurtenant coupons shall, notwithstanding any payment in any other currency (whether pursuant to a judgment or otherwise), be discharged only to the extent of the amount in the Designated Currency that the Holder receiving such payment may, in accordance with normal banking procedures, purchase with the sum paid in such other currency (after any premium and cost of exchange) in the country of issue of the Designated Currency in the case of Foreign Currency or Dollars or in the international banking community in the case of a composite currency on the Business Day immediately following the day on which such Holder receives such payment; (c) if the amount in the Designated Currency that may be so purchased for any reason falls short of the amount originally due, the Company shall pay such additional amounts as may be necessary to compensate for such shortfall; and (d) any obligation of the Company not discharged by such payment shall be due as a separate and independent obligation and, until discharged as provided herein, shall continue in full force and effect. SECTION 3.13 CUSIP Numbers. The Company in issuing the Securities may use "CUSIP" numbers or Euroclear or CEDEL reference numbers (if then generally in use), and if, so, the Trustee shall use such numbers in notices of redemption or other related material as a convenience to Holders; provided that any such notice or other related material may state that no representation is made as to the correctness of such numbers either as printed on the Securities or as contained in any notice of redemption or other related material and that reliance may be placed only on the other identification numbers printed on the Securities, and any such redemption shall not be affected by any defect in or omission of such numbers. ARTICLE FOUR Redemption of Securities SECTION 4.01. Applicability of Article. Securities of any series which are redeemable before their Stated Maturity shall be redeemable in accordance with their terms and, except as otherwise specified as contemplated by Section 3.01 for Securities of any series, in accordance with this Article. Page 46
SECTION 4.02. Election To Redeem; Notice To Trustee. The election of the Company to redeem any Securities redeemable at the option of the Company shall be evidenced by an Officers' Certificate. In case of any redemption at the election of the Company of the Securities of any series, the Company shall, at least 60 days prior to the Redemption Date fixed by the Company (unless a shorter notice shall be satisfactory to the Trustee), notify the Trustee and the Security Registrar of such Redemption Date and of the principal amount of Securities of such series to be redeemed. In the case of any redemption of Securities (i) prior to the expiration of any restriction on such redemption provided in the terms of such Securities or elsewhere in this Indenture, or (ii) pursuant to an election of the Company which is subject to a condition specified in the terms of such Securities, the Company shall furnish the Trustee with an Officers' Certificate evidencing compliance with such restriction or condition. SECTION 4.03. Selection by Security Registrar of Securities To Be Redeemed. If less than all the Securities of any series with the same terms are to be redeemed, the particular Securities to be redeemed shall be selected not more than 60 days prior to the Redemption Date by the Security Registrar from the Outstanding Securities of such series having such terms not previously called for redemption, by such method as the Security Registrar shall deem fair and appropriate and which may provide for the selection for redemption of portions of the principal amount of Securities of such series of a denomination equal to or larger than the minimum authorized denomination for Securities of such series. Unless otherwise provided by the terms of the Securities of any series so selected for partial redemption, the portions of the principal of Securities of such series so selected for partial redemption shall be, in the case of Registered Securities, equal to $1,000 or an integral multiple thereof or, in the case of Bearer Securities, equal to $5,000 or an integral multiple thereof, and the principal amount of any such Security which remains outstanding shall not be less than the minimum authorized denomination for Securities of such series. The Security Registrar shall promptly notify the Company, the Trustee and the Co-Security Registrar, if any, in writing of the Securities selected for redemption and, in the case of any Security selected for partial redemption, the principal amount thereof to be redeemed. Page 47
For all purposes of this Indenture, unless the context otherwise requires, all provisions relating to the redemption of Securities shall relate, in the case of any Security redeemed or to be redeemed only in part, to the portion of the principal of such Security which has been or is to be redeemed. SECTION 4.04. Notice of Redemption. Notice of redemption shall be given in the manner provided in Section 1.06, not less than 30 nor more than 60 days prior to the Redemption Date, to each Holder of Securities to be redeemed. All notices of redemption shall state: (i) the Redemption Date; (ii) the Redemption Price; (iii) if less than all Outstanding Securities of any series having the same terms are to be redeemed, the identification (and, in the case of partial redemption, the respective principal amounts) of the particular Securities to be redeemed; (iv) that on the Redemption Date the Redemption Price will become due and payable upon each such Security to be redeemed, and that interest, if any, thereon shall cease to accrue on and after said date; (v) the place or places where such Securities, together in the case of Bearer Securities with all remaining coupons appertaining thereto, if any, maturing after the Redemption Date, are to be surrendered for payment of the Redemption Price; (vi) that the redemption is for a sinking fund, if such is the case; and (vii) the CUSIP number or the Euroclear or the CEDEL reference numbers (or any other number used by a Depository to identify such Securities), if any, of the Securities to be redeemed. A notice of redemption published as contemplated by Section 1.06 need not identify particular Registered Securities to be redeemed. Page 48
Notice of redemption of Securities to be redeemed at the election of the Company shall be given by the Company or, on Company Request, by the Trustee in the name and at the expense of the Company. SECTION 4.05. Deposit of Redemption Price. At or prior to the opening of business on any Redemption Date, the Company shall deposit or cause to be deposited with the Trustee or with a Paying Agent (or, if the Company is acting as its own Paying Agent, segregate and hold in trust as provided in Section 5.03) an amount of money sufficient to pay the Redemption Price of all the Securities which are to be redeemed on that date; provided, however, that deposits with respect to Bearer Securities shall be made with a Paying Agent or Paying Agents located outside the United States except as otherwise provided in Section 5.02, unless otherwise specified as contemplated by Section 3.01. SECTION 4.06. Securities Payable on Redemption Date. Notice of redemption having been given as aforesaid, the Securities so to be redeemed shall, on the Redemption Date, become due and payable at the Redemption Price therein specified and from and after such date (unless the Company shall default in the payment of the Redemption Price) such Securities shall cease to bear interest and the coupons for such interest appertaining to any Bearer Securities so to be redeemed, except to the extent provided below, shall be void. Upon surrender of any such Securities for redemption in accordance with said notice, such Securities shall be paid by the Company at the Redemption Price; provided, however, that installments of interest on Bearer Securities whose Stated Maturity is on or prior to the Redemption Date shall be payable only at an office or agency located outside the United States and, unless otherwise specified as contemplated by Section 3.01, only upon presentation and surrender of coupons for such interest. Installments of interest on Registered Securities whose Stated Maturity is on or prior to the Redemption Date shall be payable to the Holders of such Securities, or one or more Predecessor Securities, registered as such on the close of business on the relevant Regular Record Dates according to their terms and the provisions of Section 3.07. If any Bearer Security surrendered for redemption shall not be accompanied by all appurtenant coupons maturing after the Redemption Date, such Security may be paid after deducting from the Redemption Price an amount equal to the face amount of all such missing coupons, or the surrender of Page 49
such missing coupon or coupons may be waived by the Company and the Trustee if there be furnished to them such security or indemnity as they may require to save each of them and any Paying Agent harmless. If thereafter the Holder of such Security shall surrender to the Trustee or any Paying Agent any such missing coupon in respect of which a deduction shall have been made from the Redemption Price, such Holder shall be entitled to receive the amount so deducted; provided, however, that interest represented by coupons shall be payable only at an office or agency located outside the United States and, unless otherwise specified as contemplated by Section 3.01, only upon presentation and surrender of those coupons. If any Security called for redemption shall not be paid upon surrender thereof for redemption, the principal shall, until paid, bear interest from the Redemption Date at the rate borne by such Security, or as otherwise provided in such Security. SECTION 4.07. Securities Redeemed in Part. Any Security which is to be redeemed only in part shall be surrendered at the office or agency of the Company in a Place of Payment therefor (with, if the Company or the Security Registrar so requires, due endorsement by, or a written instrument of transfer in form satisfactory to the Company and the Security Registrar duly executed by, the Holder of such Security or his attorney duly authorized in writing), and the Company shall execute, and the Trustee shall authenticate and deliver to the Holder of such Security without service charge, a new Security or Securities of the same series and Stated Maturity, containing identical terms and conditions, of any authorized denominations as requested by such Holder, in aggregate principal amount equal to and in exchange for the unredeemed portion of the principal of the Security so surrendered. SECTION 4.08. Redemption Suspended During Event of Default. The Trustee shall not redeem any Securities (unless all Securities then Outstanding are to be redeemed) or commence the giving of any notice of redemption of Securities during the continuance of any Event of Default known to the Trustee, except that where the giving of notice of redemption of any Securities shall theretofore have been made, the Trustee shall redeem such Securities, provided funds are deposited with it for such purpose. Any moneys theretofore or thereafter received by the Trustee shall, during the continuance of such Event of Default, be held in Page 50
trust for the benefit of the Holders and applied in the manner set forth in Section 7.06; provided, however, that in case such Event of Default shall have been waived as provided herein or otherwise cured, such moneys shall thereafter be held and applied in accordance with the provisions of this Article. ARTICLE FIVE Covenants SECTION 5.01. Payment of Principal, Premium and Interest. The Company covenants and agrees for the benefit of each series of Securities that it will duly and punctually pay the principal of, premium, if any, and interest on the Securities of such series in accordance with the terms of the Securities of such series, any coupons appertaining thereto and this Indenture. Unless otherwise specified as contemplated by Section 3.01 with respect to any series of Securities, any interest due on Bearer Securities on or before Maturity shall be payable only outside the United States upon presentation and surrender of the several coupons for such interest installments as are evidenced thereby as they severally mature. SECTION 5.02. Maintenance of Office or Agency. If Securities of a series are issuable only as Registered Securities, the Company will maintain in each Place of Payment for any series of Securities an office or agency where Securities of that series may be presented or surrendered for payment, where Securities of that series may be surrendered for registration of transfer or exchange and where notices and demands to or upon the Company in respect of the Securities of that series and this Indenture may be served. The Company will give prompt written notice to the Trustee of the location, and of any change in the location, of such office or agency. If Securities of a series may be issuable as Bearer Securities, the Company will maintain (A) in the Borough of Manhattan, The City of New York, an office or agency where any Registered Securities of that series may be presented or surrendered for payment, where any Registered Securities of that series may be surrendered for registration of transfer, where Securities of that series may be surrendered for exchange and where notices and demands to or upon the Company in respect of the Securities of that series and this Indenture may be served, (B) subject to any laws or regulations applicable thereto, in a Place of Page 51
Payment for that series which is located outside the United States, an office or agency where Securities of that series and related coupons may be presented and surrendered for payment (including payment of any additional amounts payable on Securities of that series pursuant to Section 5.04); provided, however, that if the Securities of that series are listed on The International Stock Exchange of the United Kingdom and the Republic of Ireland Limited or the Luxembourg Stock Exchange or any other stock exchange located outside the United States and such stock exchange shall so require, the Company will maintain a Paying Agent for the Securities of that series in London or Luxembourg or any other required city located outside the United States, as the case may be, so long as the Securities of that series are listed on such exchange, and (C) subject to any laws or regulations applicable thereto, in a Place of Payment for such series located outside the United States an office or agency where any Registered Securities of that series may be surrendered for registration of transfer, where Securities of that series may be surrendered for exchange and where notices and demands to or upon the Company in respect of the Securities of that series and this Indenture may be served. The Company will give prompt written notice to the Trustee of the location, and any change in the location, of any such office or agency. If at any time the Company shall fail to maintain any such required office or agency in respect of any series of Securities or shall fail to furnish the Trustee with the address thereof, such presentations, and surrenders of Securities of that series may be made and notices and demands may be made or served at the Principal Corporate Trust Office of the Trustee, except that Bearer Securities of that series and the related coupons may be presented and surrendered for payment (including payment of any additional amounts payable on Bearer Securities of that series pursuant to Section 5.04) at the place specified for the purpose as contemplated by Section 3.01, and the Company hereby appoints the Trustee as its agent to receive such respective presentations, surrenders, notices and demands. Except as otherwise provided in the form of Bearer Security of any particular series pursuant to the provisions of this Indenture, no payment of principal, premium or interest on Bearer Securities shall be made at any office or agency of the Company in the United States or by check mailed to any address in the United States or by transfer to an account maintained with a bank located in the United States; provided, however, payment of principal of and any premium and interest denominated in Dollars (including Page 52
additional amounts payable in respect thereof) on any Bearer Security may be made at an office or agency of, and designated by, the Company located in the United States if (but only if) payment of the full amount of such principal, premium, interest or additional amounts in Dollars at all offices outside the United States maintained for the purpose by the Company in accordance with this Indenture is illegal or effectively precluded by exchange controls or similar restrictions and the Trustee receives an Opinion of Counsel that such payment within the United States is legal. Unless otherwise provided as contemplated by Section 3.01 with respect to any series of Securities, at the option of the Holder of any Bearer Security or related coupon, payment may be made by check in the currency designated for such payment pursuant to the terms of such Bearer Security presented or mailed to an address outside the United States or by transfer to an account in such currency maintained by the payee with a bank located outside the United States. The Company may also from time to time designate one or more other offices or agencies where the Securities of one or more series may be presented or surrendered for any or all of such purposes specified above in this Section and may constitute and appoint one or more Paying Agents for the payment of such Securities, in one or more other cities, and may from time to time rescind such designations and appointments; provided, however, that no such designation, appointment or rescission shall in any manner relieve the Company of its obligation to maintain an office or agency in each Place of Payment for Securities of any series for such purposes. The Company will give prompt written notice to the Trustee of any such designation or rescission and of any change in the location of any such other office or agency. Unless and until the Company rescinds one or more such appointments, the Company hereby appoints: (i) The Chase Manhattan Bank, as its Paying Agent in The City of New York with respect to all series of Securities having a Place of Payment in The City of New York and (ii) the [ ] at its principal office as its Paying Agent in the [ ] with respect to all series of Securities having a Place of Payment in the [ ]. SECTION 5.03. Money for Security Payments To Be Held in Trust. If the Company shall at any time act as its own Paying Agent for any series of Securities, it will, on or before each due date of the principal of, premium, if any, or interest on any of the Securities of such series and any appurtenant coupons, segregate and hold in trust for the Page 53
benefit of the Persons entitled thereto a sum sufficient to pay the principal, premium or interest so becoming due until such sums shall be paid to such Persons or otherwise disposed of as herein provided, and will promptly notify the Trustee of its action or failure so to act. Whenever the Company shall have one or more Paying Agents for any series of Securities, it will, at or prior to the opening of business on each due date of the principal of, premium, if any, or interest on any Securities of such series and any appurtenant coupons, deposit with a Paying Agent a sum sufficient to pay the principal, premium or interest so becoming due, such sum to be held in trust for the benefit of the Persons entitled to such principal, premium or interest, and (unless such Paying Agent is the Trustee) the Company will promptly notify the Trustee of its action or failure so to act. The Company will cause each Paying Agent other than the Trustee for any series of Securities to execute and deliver to the Trustee an instrument in which such Paying Agent shall agree with the Trustee subject to the provisions of this Section, that such Paying Agent will: (i) hold all sums held by it for the payment of principal of, premium, if any, or interest on Securities of such series and any appurtenant coupons in trust for the benefit of the Persons entitled thereto until such sums shall be paid to such Persons or otherwise disposed of as herein provided; (ii) give the Trustee notice of any default by the Company (or any other obligor upon the Securities of such series) in the making of any payment of principal, premium or interest on the Securities of such series or any appurtenant coupons; and (iii) at any time during the continuance of any such default, upon the written request of the Trustee, forthwith pay to the Trustee all sums so held in trust by such Paying Agent. The Company may at any time, for the purpose of obtaining the satisfaction and discharge of this Indenture or for any other purpose, pay, or by Company Order direct any Paying Agent to pay, to the Trustee all sums held in trust by the Company or such Paying Agent, such sums to be held by the Trustee upon the same trusts as those upon which Page 54
such sums were held by the Company or such Paying Agent, and, upon such payments by any Paying Agent to the Trustee, such Paying Agent shall be released from all further liability with respect to such money. Any money deposited with the Trustee or any Paying Agent, or then held by the Company, in trust for the payment of the principal of, premium, if any, or interest on any Security of any series or any appurtenant coupons and remaining unclaimed for two years after such principal, premium or interest has become due and payable shall be paid to the Company on Company Request, or (if then held by the Company) shall be discharged from such trust; and the Holder of such Security or any coupon appertaining thereto shall thereafter, as an unsecured general creditor, look only to the Company for payment thereof, and all liability of the Trustee or such Paying Agent with respect to such trust money, and all liability of the Company as trustee thereof, shall thereupon cease; provided, however, that the Trustee or such Paying Agent, before being required to make any such repayment, may at the expense of the Company cause to be published once, in an Authorized Newspaper in each Place of Payment, notice that such money remains unclaimed and that, after a date specified therein, which shall not be less than 30 days from the date of such publication, any unclaimed balance of such money then remaining will be repaid to the Company. SECTION 5.04. Additional Amounts. If the Securities of a series provide for the payment of additional amounts, the Company will pay to the Holder of any Security of any series or any coupon appertaining thereto additional amounts as provided therein. Whenever in this Indenture there is mentioned, in any context, the payment of the principal of (or premium, if any) or interest on, or in respect of, any Security of any series or payment of any related coupon or the net proceeds received on the sale or exchange of any Security of any series, such mention shall be deemed to include mention of the payment of additional amounts provided for in this Section to the extent that, in such context, additional amounts are, were or would be payable in respect thereof pursuant to the provisions of this Section and express mention of the payment of additional amounts (if applicable) in any provisions hereof shall not be construed as excluding additional amounts in those provisions hereof where such express mention is not made. Page 55
If the Securities of a series provide for the payment of additional amounts, at least 10 days prior to the first Interest Payment Date with respect to that series of Securities (or if the Securities of that series will not bear interest prior to Maturity, the first day on which a payment of principal (and premium, if any) is made), and at least 10 days prior to each date of payment of principal (and premium, if any) or interest if there has been any change with respect to the matters set forth in the below-mentioned Officers' Certificate, the Company will furnish the Trustee and the Company's Principal Paying Agent or Paying Agents, if other than the Trustee, with an Officers' Certificate instructing the Trustee and such Paying Agent or Paying Agents whether such payment of principal of (and premium, if any) or interest on the Securities of that series shall be made to Holders of Securities of that series or any related coupons who are United States Aliens without withholding for or on account of any tax, assessment or other governmental charge described in the Securities of that series. If any such withholding shall be required, then such Officers' Certificate shall specify by country the amount, if any, required to be withheld on such payments to such Holders of Securities or coupons and the Company will pay to the Trustee or such Paying Agent the additional amounts required by this Section. The Company covenants to indemnify the Trustee and any Paying Agent for, and to hold them harmless against, any loss, liability or reasonable expense incurred without negligence or bad faith on their part arising out of or in connection with actions taken or omitted by any of them in reliance on any Officers' Certificate furnished pursuant to this Section. SECTION 5.05. Statement as to Compliance. The Company will deliver to the Trustee, within 120 days after the end of each fiscal year of the Company, an Officers' Certificate (which need not comply with Section 1.02) (provided, however, that one of the signatories of which shall be the Company's principal executive officer, principal financial officer or principal accounting officer) stating, as to each signer thereof, that: (i) a review of the activities of the Company during such year and of performance under this Indenture and under the terms of the Securities has been made under his supervision; and (ii) to the best of his knowledge, based on such review, (a) the Company has fulfilled all its Page 56
obligations and complied with all conditions and covenants under this Indenture and under the terms of the Securities throughout such year, or, if there has been a default in the fulfillment of any such obligation, condition or covenant specifying each such default known to him and the nature and status thereof, and (b) no event has occurred and is occurring which is, or after notice or lapse of time or both would become, an Event of Default, or if such an event has occurred and is continuing, specifying such event known to him and the nature and status thereof. For purposes of this Section, compliance or default shall be determined without regard to any period of grace or requirement of notice provided for herein. SECTION 5.06. Maintenance of Corporate Existence, Rights and Franchises. So long as any of the Securities shall be Outstanding, the Company will do or cause to be done all things necessary to preserve and keep in full force and effect its corporate existence, rights and franchises to carry on its business; provided, however, that nothing in this Section 5.06 shall (i) require the Company to preserve any such right or franchise if the Board of Directors shall determine that the preservation thereof is no longer desirable in the conduct of the business of the Company and that the loss thereof is not disadvantageous in any material respect to the Holders, (ii) prevent any consolidation or merger of the Company, or any conveyance or transfer of its property and assets substantially as an entirety to any person, permitted by Article Ten, or (iii) prevent the liquidation or dissolution of the Company after any conveyance or transfer of its property and assets substantially as an entirety to any person permitted by Article Ten. ARTICLE SIX Holders' Lists and Reports by Trustee and Company SECTION 6.01. Company To Furnish Trustee Names and Addresses of Holders. The Company will furnish or cause to be furnished to the Trustee (i) semiannually, not more than 10 days after each March 1 and September 1, a list, in such form as the Trustee may reasonably require, containing all the information in the possession or control of the Company, any of its Paying Agents (other than the Trustee) Page 57
or the Security Registrar, if other than the Trustee, as to the names and addresses of the Holders of Securities as of such March 1 and September 1, and (ii) at such other times as the Trustee may request in writing, within 30 days after receipt by the Company of any such request, a list of similar form and content as of a date not more than 15 days prior to the time such list is requested to be furnished; provided, however, that if and so long as the Trustee is the Security Registrar for Securities of a series, no such list need be furnished with respect to such series of Securities. SECTION 6.02. Preservation of Information; Communications to Holders. (i) The Trustee shall preserve, in as current a form as is reasonably practicable, the names and addresses of Holders of Securities contained in the most recent list furnished to the Trustee as provided in Section 6.01 and the names and addresses of Holders of Securities received by the Trustee in its capacity as the Security Registrar, if so acting. The Trustee may destroy any list furnished to it as provided in Section 6.01 upon receipt of a new list so furnished. (ii) If three or more Holders of Securities of any series (hereinafter referred to as "applicants") apply in writing to the Trustee, and furnish to the Trustee reasonable proof that each such applicant has owned a Security of such series for a period of at least six months preceding the date of such application, and such application states that the applicants desire to communicate with other Holders of Securities of such series or with the Holders of all Securities with respect to their rights under this Indenture or under such Securities and is accompanied by a copy of the form of proxy or other communication which such applicants propose to transmit, then the Trustee shall, within five Business Days after the receipt of such application, at its election, either (a) afford such applicants access to the information preserved at the time by the Trustee in accordance with Section 6.02(i), or (b) inform such applicants as to the approximate number of Holders of Securities of such series or all Securities, as the case may be, whose names and addresses appear in the information preserved at the time by the Trustee in accordance with Section 6.02(i), and as to the approximate cost of mailing to such Page 58
Holders the form of proxy or other communication, if any, specified in such application. If the Trustee shall elect not to afford such applicants access to such information, the Trustee shall, upon the written request of such applicants, mail to each Holder of a Security of such series or all Holders of Securities, as the case may be, whose names and addresses appear in the information preserved at the time by the Trustee in accordance with Section 6.02(i), a copy of the form of proxy or other communication which is specified in such request, with reasonable promptness after a tender to the Trustee of the material to be mailed and of payment, or provision for the payment, of the reasonable expenses of mailing, unless, within five days after such tender, the Trustee shall mail to such applicants and file with the Commission, together with a copy of the material to be mailed, a written statement to the effect that, in the opinion of the Trustee, such mailing would be contrary to the best interests of the Holders of Securities of such series or all Securities, as the case may be, or would be in violation of applicable law. Such written statement shall specify the basis of such opinion. If the Commission, after opportunity for a hearing upon the objections specified in the written statement so filed, shall enter an order refusing to sustain any of such objections or if, after the entry of an order sustaining one or more of such objections, the Commission shall find, after notice and opportunity for hearing, that all the objections so sustained have been met and shall enter an order so declaring, the Trustee shall mail copies of such material to all such Holders of Securities with reasonable promptness after the entry of such order and the renewal of such tender; otherwise, the Trustee shall be relieved of any obligation or duty to such applicants respecting their application. (iii) Every Holder of Securities, by receiving and holding the same, agrees with the Company and the Trustee that neither the Company nor the Trustee shall be held accountable by reason of the disclosure of any such information as to the names and addresses of the Holders of Securities in accordance with Section 6.02(ii), regardless of the source from which such information was derived, and that the Trustee shall not be held accountable by reason of mailing any material pursuant to a request made under Section 6.02(ii). Page 59
SECTION 6.03. Reports by Trustee. (i) Within 60 days after May 15 of each year commencing with the year 1997, the Trustee shall mail to each Holder reports concerning the Trustee and its action under the Indenture as may be required pursuant to Section 313(a) of the Trust Indenture Act if and to the extent and in the manner provided pursuant thereto. The Trustee shall also comply with the other provisions of Section 313 of the Trust Indenture Act. (ii) Reports pursuant to this Section shall be transmitted by mail (1) to all Holders of Registered Securities, as their names and addresses appear in the Security Register and (2) to such Holders of Bearer Securities as have, within the two years preceding such transmission, filed their names and addresses with the Trustee for that purpose, and (3) except in the cases of reports under Section 313(b)(2) of the Trust Indenture Act, to each Holder of a Security of any series whose name and address appear in the information preserved at the time by the Trustee in accordance with Section 6.02(i). (iii) A copy of each such report shall, at the time of such transmission to Holders, be filed by the Trustee with each securities exchange upon which any Securities are listed, and also with the Commission. The Company will notify the Trustee when any Securities are listed on any securities exchange. SECTION 6.04. Reports by Company. The Company will: (i) file with the Trustee, within 15 days after the Company is required to file the same with the Commission, copies of the annual reports and of the information, documents and other reports (or copies of such portions of any of the foregoing as the Commission may from time to time by rules and regulations prescribe) which the Company may be required to file with the Commission pursuant to Section 13 or Section 15(d) of the Exchange Act; or, if the Company is not required to file information, documents or reports pursuant to either of said Sections, then it will file with the Trustee and the Commission, in accordance with rules and regulations prescribed from time to time by the Commission, such of the supplementary and periodic information, documents and reports which may be required pursuant to Section 13 of Page 60
the Exchange Act in respect of a security listed and registered on a national securities exchange as may be prescribed from time to time in such rules and regulations; (ii) file with the Trustee and the Commission, in accordance with rules and regulations prescribed from time to time by the Commission, such additional information, documents and reports with respect to compliance by the Company with the conditions and covenants of this Indenture as may be required from time to time by such rules and regulations; and (iii) transmit by mail to Holders of Securities, in the manner and to the extent provided in Section 6.03(ii), within 30 days after the filing thereof with the Trustee, such summaries of any information, documents and reports required to be filed by the Company pursuant to paragraphs (i) and (ii) of this Section as may be required by rules and regulations prescribed from time to time by the Commission. ARTICLE SEVEN Remedies SECTION 7.01. Events of Default. "Event of Default", with respect to any series of Securities, wherever used herein, means any one of the following events (whatever the reason for such Event of Default and whether it shall be voluntary or involuntary or be effected by operation of law or pursuant to any judgment, decree or order of any court or any order, rule or regulation of any administrative or governmental body), unless it is either inapplicable to a particular series or it is specifically deleted or modified in the supplemental indenture or Board Resolution under which such series of Securities is issued or in the form of Security for such series: (i) default in the payment of any interest upon any Security of that series when it becomes due and payable, and continuance of such default for a period of 30 days; or Page 61
(ii) default in the payment of the principal of (or premium, if any, on) any Security of that series at its Maturity; or (iii) default in the performance, or breach, of any covenant or warranty of the Company in this Indenture (other than a covenant or warranty a default in whose performance or whose breach is elsewhere in this Section specifically dealt with or which has expressly been included in this Indenture solely for the benefit of series of Securities other than that series), and continuance of such default or breach for a period of 90 days after there has been given, by registered or certified mail, to the Company by the Trustee or to the Company and the Trustee by the Holders of at least 25% in principal amount of the Outstanding Securities of that series a written notice specifying such default or breach and requiring it to be remedied and stating that such notice is a "Notice of Default" hereunder; or (iv) the entry of a decree or order by a court having jurisdiction in the premises granting relief in respect of the Company in an involuntary case under the Federal Bankruptcy Code, adjudging the Company a bankrupt, or approving as properly filed a petition seeking reorganization, arrangement, adjustment or composition of or in respect of the Company under the Federal Bankruptcy Code or any other applicable Federal or State bankruptcy, insolvency or similar law, or appointing a receiver, liquidator, custodian, assignee, trustee, sequestrator (or other similar official) of the Company, or of substantially all of its properties, or ordering the winding up or liquidation of its affairs, and the continuance of any such decree or order unstayed and in effect for a period of 60 consecutive days; or (v) the institution by the Company of proceedings to be adjudicated a bankrupt, or the consent of the Company to the institution of bankruptcy proceedings against it, or the filing by the Company of a petition or answer or consent seeking reorganization or relief under the Federal Bankruptcy Code or any other applicable Federal or State bankruptcy, insolvency or similar law, or the consent by the Company to the filing of any such petition or to the appointment of a receiver, liquidator, custodian, assignee, trustee, Page 62
sequestrator (or other similar official) of the Company or of substantially all of its properties; or (viii) any other Event of Default provided with respect to Securities of that series. SECTION 7.02. Acceleration of Maturity; Rescission and Annulment. If an Event of Default with respect to any series of Securities for which there are Securities Outstanding occurs and is continuing, then, and in every such case, the Trustee or the Holders of not less than 25% in principal amount of the Outstanding Securities of such series may declare the principal of all the Securities of such series (or, if the Securities of that series are Original Issue Discount Securities, such portion of the principal amount as may be specified in the terms of that series) to be immediately due and payable, by a notice in writing to the Company (and to the Trustee if given by Holders), and upon any such declaration the same shall become immediately due and payable. At any time after such a declaration of acceleration with respect to Securities of any series has been made and before a judgment or decree for payment of the money due has been obtained by the Trustee as hereinafter in this Article provided, the Holders of a majority in principal amount of the Outstanding Securities of such series, by written notice to the Company and the Trustee, may rescind and annul such declaration and its consequences, and any Event of Default giving rise to such declaration shall not be deemed to have occurred, if: (i) the Company has paid or deposited with the Trustee a sum sufficient to pay (a) all overdue installments of interest on all Securities of such series, (b) the principal of and premium, if any, on any Securities of such series which have become due otherwise than by such declaration of acceleration and interest thereon at the rate or rates prescribed therefor by the terms of the Securities of such series, (c) to the extent that payment of such interest is lawful, interest upon overdue installments of interest at the rate or rates Page 63
prescribed therefor by the terms of the Securities of such series, and (d) all sums paid or advanced by the Trustee hereunder and the reasonable compensation, expenses, disbursements and advances of the Trustee, the Security Registrar, any Paying Agent, and their agents and counsel and all other amounts due the Trustee under Section 8.07; and (ii) all Events of Default with respect to Securities of that series, other than the nonpayment of the principal of Securities of that series which have become due solely by such declaration of acceleration, have been cured or waived as provided in Section 7.13. No such recession shall affect any subsequent default or impair any right consequent thereon. SECTION 7.03. Collection of Indebtedness and Suits for Enforcement by Trustee. The Company covenants that if: (i) default is made in the payment of any instalment of interest on any Security of any series when such interest becomes due and payable and such default continues for a period of 30 days; or (ii) default is made in the payment of the principal of or premium, if any, on any Security of any series at the Maturity thereof; the Company will, upon demand of the Trustee, pay to it, for the benefit of the Holder of any such Security or coupon appertaining thereto, if any, the whole amount then due and payable on any such Security or coupon for principal, premium, if any, and interest, with interest upon the overdue principal and premium, if any, and (to the extent that payment of such interest shall be lawful) upon overdue installments of interest, at the rate or rates prescribed therefor by the terms of any such Security; and, in addition thereto, such further amount as shall be sufficient to cover the reasonable costs and expenses of collection, including the reasonable compensation, expenses, disbursements and advances of the Trustee, its agents and counsel and any other amounts due the Trustee under Section 8.07. Page 64
If the Company fails to pay such amounts forthwith upon such demand, the Trustee, in its own name and as trustee of an express trust, may institute a judicial proceeding for the collection of the sums so due and unpaid, and may prosecute such proceeding to judgment or final decree, and may enforce the same against the Company or any other obligor upon such Securities and collect the moneys adjudged or decreed to be payable in the manner provided by law out of the property of the Company or any other obligor upon such Securities, wherever situated. If an Event of Default with respect to any series of Securities occurs and is continuing, the Trustee may in its discretion proceed to protect and enforce its rights and the rights of the Holders of Securities of such series by such appropriate judicial proceedings as the Trustee shall deem most effectual to protect and enforce any such rights, whether for the specific enforcement of any covenant or agreement in this Indenture or in aid of the exercise of any power granted herein, or to enforce any other proper remedy. SECTION 7.04. Trustee May File Proofs of Claim. In case of the pendency of any receivership, insolvency, liquidation, bankruptcy, reorganization, arrangement, adjustment, composition or other judicial proceeding relative to the Company or any other obligor upon the Securities or the property of the Company or of such other obligor or their creditors, the Trustee (irrespective of whether the principal of any Securities shall then be due and payable as therein expressed or by declaration or otherwise and irrespective of whether the Trustee shall have made any demand on the Company for the payment of overdue principal, premium, if any, or interest) shall be entitled and empowered, by intervention in such proceeding or otherwise: (i) to file and prove a claim for the whole amount of principal, premium, if any, and interest owing and unpaid in respect of the Securities and to file such other papers or documents as may be necessary or advisable in order to have the claims of the Trustee (including any claim for the reasonable compensation, expenses, disbursements and advances of the Trustee, its agents and counsel and any other amounts due the Trustee under Section 8.07) and of the Holders allowed in such judicial proceeding; and Page 65
(ii) to collect and receive any moneys or other property payable or deliverable on any such claims and to distribute the same; and any receiver, assignee, trustee, liquidator, sequestrator or other similar official in any such judicial proceeding is hereby authorized by each Holder to make such payments to the Trustee, and in the event that the Trustee shall consent to the making of such payments directly to the Holders, to pay to the Trustee any amount due to it for the reasonable compensation, expenses, disbursements and advances of the Trustee, its agents and counsel, and any other amounts due the Trustee under Section 8.07. Nothing herein contained shall be deemed to authorize the Trustee to authorize or consent to or accept or adopt on behalf of any Holder of a Security or coupon any plan of reorganization, arrangement, adjustment or composition affecting the Securities or the rights of any Holder thereof, or to authorize the Trustee to vote in respect of the claim of any Holder of a Security or coupon in any such proceeding. SECTION 7.05. Trustee May Enforce Claims Without Possession of Securities. All rights of action and claims under this Indenture or under the Securities of any series, or coupons (if any) appertaining thereto, may be prosecuted and enforced by the Trustee without the possession of any of the Securities of such series or coupons appertaining thereto or the production thereof in any proceeding relating thereto, and any such proceeding instituted by the Trustee shall be brought in its own name as trustee of an express trust, and any recovery of judgment shall, after provision for the payment of the reasonable compensation, expenses, disbursements and advances of the Trustee, its agents and counsel and any other amounts due the Trustee under Section 8.07, be for the ratable benefit of the Holders of the Securities of such series and coupons appertaining thereto in respect of which such judgment has been recovered. SECTION 7.06. Application of Money Collected. Any money collected by the Trustee with respect to a series of Securities pursuant to this Article shall be applied in the following order, at the date or dates fixed by the Trustee, and, in case of the distribution of such money on account of principal, premium, if any, or interest, upon presentation of the Securities of such series or coupons Page 66
appertaining thereto, if any, or both, as the case may be, and the notation thereon of the payment if only partially paid and upon surrender thereof if fully paid: FIRST: To the payment of all amounts due the Trustee under Section 8.07; SECOND: To the payment of the amounts then due and unpaid upon the Securities of such series and coupons for principal, premium, if any, and interest, in respect of which or for the benefit of which such money has been collected, ratably, without preference or priority of any kind, according to the amounts due and payable on Securities of such series and coupons, if any, for principal, premium, if any, and interest, respectively. The Holders of each series of Securities denominated in ECU, any other composite currency or a Foreign Currency and any matured coupons relating thereto shall be entitled to receive a ratable portion of the amount determined by the Exchange Rate Agent by converting the principal amount Outstanding of such series of Securities and matured but unpaid interest on such series of Securities in the currency in which such series of Securities is denominated into Dollars at the Exchange Rate as of the Business Day immediately preceding the date of payment; and THIRD: The balance, if any, to the Person or Persons entitled thereto. SECTION 7.07. Limitation on Suits. No Holder of any Security of any series or any related coupons shall have any right to institute any proceeding, judicial or otherwise, with respect to this Indenture, or for the appointment of a receiver or trustee, or for any other remedy hereunder, unless: (i) such Holder has previously given written notice to the Trustee of a continuing Event of Default with respect to Securities of such series; (ii) the Holders of not less than a majority in principal amount of the Outstanding Securities of such series shall have made written request to the Trustee to institute proceedings in respect of such Event of Default in its own name as Trustee hereunder; Page 67
(iii) such Holder or Holders have offered to the Trustee reasonable indemnity against the costs, expenses and liabilities to be incurred in compliance with such request; (iv) the Trustee for 60 days after its receipt of such notice, request and offer of indemnity has failed to institute any such proceeding; and (v) no direction inconsistent with such written request has been given to the Trustee during such 60-day period by the Holders of a majority in principal amount of the Outstanding Securities of such series; it being understood and intended that no one or more Holders of Securities of such series shall have any right in any manner whatever by virtue of, or by availing of, any provision of this Indenture to affect, disturb or prejudice the rights of any other Holders of Securities of such series or to obtain or to seek to obtain priority or preference over any other such Holders or to enforce any right under this Indenture, except in the manner herein provided and for the equal and ratable benefit of all the Holders of Securities of such series. SECTION 7.08. Unconditional Right of Holders To Receive Principal, Premium and Interest. Notwithstanding any other provision in this Indenture, the Holder of any Security or coupon shall have the right, which is absolute and unconditional, to receive payment of the principal of, premium, if any, and (subject to Section 3.07) interest on such Security or payment of such coupon on the respective Stated Maturities expressed in such Security or coupon (or, in the case of redemption or repayment, on the Redemption Date or Repayment Date) and to institute suit for the enforcement of such payment, and such rights shall not be impaired without the consent of such Holder. SECTION 7.09. Restoration of Rights and Remedies. If the Trustee or any Holder of a Security or coupon has instituted any proceeding to enforce any right or remedy under this Indenture and such proceeding has been discontinued or abandoned for any reason, or has been determined adversely to the Trustee or to such Holder, then and in every such case the Company, the Trustee and the Holders shall, subject to any determination in such proceeding, be restored severally and respectively to their former positions hereunder, and thereafter all rights and Page 68
remedies of the Trustee and the Holders shall continue as though no such proceeding had been instituted. SECTION 7.10. Rights and Remedies Cumulative. Except as otherwise provided with respect to the replacement or payment of mutilated, lost, destroyed or stolen Securities or coupons in the last paragraph of Section 3.06, no right or remedy herein conferred upon or reserved to the Trustee or to the Holders is intended to be exclusive of any other right or remedy, and every right and remedy shall, to the extent permitted by law, be cumulative and in addition to every other right and remedy given hereunder or now or hereafter existing at law or in equity or otherwise. The assertion or employment of any right or remedy hereunder, or otherwise, shall not prevent the concurrent assertion or employment of any other appropriate right or remedy. SECTION 7.11. Delay or Omission Not Waiver. No delay or omission of the Trustee or of any Holder of any Security or coupon to exercise any right or remedy accruing upon any Event of Default shall impair any such right or remedy or constitute a waiver of any such Event of Default or an acquiescence therein. Every right and remedy given by this Article or by law to the Trustee or to the Holders may be exercised from time to time, and as often as may be deemed expedient, by the Trustee or by the Holders, as the case may be. SECTION 7.12. Control by Holders. The Holders of a majority in principal amount of the Outstanding Securities of any series shall have the right to direct the time, method and place of conducting any proceeding for any remedy available to the Trustee or exercising any trust or power conferred on the Trustee with respect to the Securities of such series; provided that: (i) such direction shall not be in conflict with any rule of law or with this Indenture; (ii) the Trustee shall not determine that the action so directed would be unjustly prejudicial to the Holders not taking part in such direction; (iii) subject to the provisions of Section 8.01, the Trustee shall have the right to decline to follow any such direction if the Trustee in good faith shall, by a Responsible Officer or Officers of the Trustee, Page 69
determine that the proceeding so directed would involve the Trustee in personal liability; and (iv) the Trustee may take any other action deemed proper by the Trustee which is not inconsistent with such direction. SECTION 7.13. Waiver of Past Defaults. The Holders of a majority in principal amount of the Outstanding Securities of any series may on behalf of the Holders of all the Securities of such series waive any past default hereunder and its consequences, except a default not theretofore cured: (i) in the payment of the principal of, premium, if any, or interest on any Security of such series; or (ii) in respect of a covenant or provision hereof which under Article Nine cannot be modified or amended without the consent of the Holder of each Outstanding Security of such series affected. Upon any such waiver, such default shall cease to exist, and any Event of Default arising therefrom shall be deemed to have been cured, for every purpose of the Securities of such series under this Indenture; but no such waiver shall extend to any subsequent or other default or impair any right consequent thereon. SECTION 7.14. Undertaking for Costs. All parties to this Indenture agree, and each Holder of any Security by his acceptance thereof shall be deemed to have agreed, that any court may in its discretion require, in any suit for the enforcement of any right or remedy under this Indenture, or in any suit against the Trustee for any action taken, suffered or omitted by it as Trustee, the filing by any party litigant in such suit of an undertaking to pay the costs of such suit, and that such court may in its discretion assess reasonable costs, including reasonable attorneys' fees, against any party litigant in such suit, having due regard to the merits and good faith of the claims or defenses made by such party litigant; but the provisions of this Section shall not apply to any suit instituted by the Company, to any suit instituted by the Trustee, to any suit instituted by any Holder, or group of Holders, holding in the aggregate more than 10% in principal amount of the Outstanding Securities of any series, or to any suit instituted by any Holder of Securities or coupons for the Page 70
enforcement of the payment of the principal of, premium, if any, or interest on any Security or payment of any coupon on or after the respective Stated Maturities expressed in such Security or coupon (or, in the case of redemption or repayment, on or after the Redemption Date or Repayment Date). SECTION 7.15. Waiver of Stay or Extension Laws. The Company covenants (to the extent that it may lawfully do so) that it will not at any time insist upon, or plead, or in any manner whatsoever claim or take the benefit or advantage of, any stay or extension law wherever enacted, now or at any time hereafter in force, which may affect the covenants or the performance of this Indenture; and the Company (to the extent that it may lawfully do so) hereby expressly waives all benefit or advantage of any such law, and covenants that it will not hinder, delay or impede the execution of any power herein granted to the Trustee, but will suffer and permit the execution of every such power as though no such law had been enacted. ARTICLE EIGHT The Trustee SECTION 8.01. Certain Duties and Responsibilities. (i) Except during the continuance of an Event of Default with respect to any series of Securities: (a) the Trustee undertakes to perform such duties and only such duties as are specifically set forth in this Indenture with respect to Securities of such series, and no implied covenants or obligations shall be read into this Indenture against the Trustee with respect to such series; and (b) in the absence of bad faith on its part, the Trustee may conclusively rely with respect to such series, as to the truth of the statements and the correctness of the opinions expressed therein, upon certificates or opinions furnished to the Trustee and conforming to the requirements of this Indenture; but in the case of any such certificate or opinions which by any provision hereof are specifically required to be furnished to the Trustee, the Trustee shall be under a duty to examine the same to determine whether or not Page 71
they conform as to form to the requirements of the Indenture. (ii) In case an Event of Default with respect to any series of Securities has occurred and is continuing, the Trustee shall exercise such of the rights and powers vested in it by this Indenture with respect to such series, and use the same degree of care and skill in their exercise, as a prudent person would exercise or use under the circumstances in the conduct of his or her own affairs. (iii) No provision of this Indenture shall be construed to relieve the Trustee from liability for its own negligent action, its own negligent failure to act, or its own wilful misconduct, except that: (a) this Subsection shall not be construed to limit the effect of Subsection (i) of this Section; (b) the Trustee shall not be liable for any error or judgment made in good faith by a Responsible Officer, unless it shall be proved that the Trustee was negligent in ascertaining the pertinent facts; (c) the Trustee shall not be liable with respect to any action taken, suffered or omitted to be taken by it in good faith in accordance with the direction of the Holders of a majority in principal amount of the Outstanding Securities of any series relating to the time, method and place of conducting any proceeding for any remedy available to the Trustee, or exercising any trust or power conferred upon the Trustee, under this Indenture with respect to Securities of such series; and (d) no provision of this Indenture shall require the Trustee to expend or risk its own funds or otherwise incur any financial liability in the performance of any of its duties hereunder, or in the exercise of any of its rights or powers, if it shall have reasonable grounds for believing that repayment of such funds or adequate indemnity against such risk or liability is not reasonably assured to it. (iv) Whether or not therein expressly so provided, every provision of this Indenture relating to the conduct or affecting the liability of or affording protection to the Trustee shall be subject to the provisions of this Section. Page 72
SECTION 8.02. Notice of Default. Within 90 days after the occurrence of any default hereunder with respect to Securities of any series, the Trustee shall transmit by mail to all Holders of Securities of such series entitled to receive reports pursuant to Section 6.03(ii) notice of such default hereunder known to the Trustee, unless such default shall have been cured or waived; provided, however, that, except in the case of a default in the payment of the principal of, premium, if any, or interest on any Security of such series, or any related coupons or in the payment of any sinking fund instalment with respect to Securities of such series the Trustee shall be protected in withholding such notice if and so long as the board of directors, the executive committee or a trust committee of directors and/or Responsible Officers of the Trustee in good faith determines that the withholding of such notice is in the interests of the Holders of Securities of such series; and provided further that in the case of any default of the character specified in Section 7.01(iii) with respect to Securities of such series, no such notice to Holders of Securities of such series shall be given until at least 90 days after the occurrence thereof. For the purpose of this Section, the term "default", with respect to Securities of any series, means any event which is, or after notice or lapse of time, or both, would become, an Event of Default with respect to Securities of such series. SECTION 8.03. Certain Rights of Trustee. Except as otherwise provided in Section 8.01: (i) the Trustee may rely and shall be protected in acting or refraining from acting upon any resolution, certificate, statement, instrument, opinion, report, notice, request, direction, consent, order, bond, note or other paper or document believed by it to be genuine and to have been signed or presented by the proper party or parties; (ii) any request or direction of the Company mentioned herein shall be sufficiently evidenced by a Company Request or Company Order and any resolution of the Board of Directors may be sufficiently evidenced by a Board Resolution; (iii) whenever in the administration of this Indenture the Trustee shall deem it desirable that a matter be proved or established prior to taking, suffering or omitting any action hereunder, the Trustee Page 73
(unless other evidence be herein specifically prescribed) may, in the absence of bad faith on its part, rely upon an Officers' Certificate; (iv) the Trustee may consult with counsel and the advice of such counsel or any Opinion of Counsel shall be full and complete authorization and protection in respect of any action taken, suffered or omitted by it hereunder in good faith and in reliance thereon; (v) the Trustee shall be under no obligation to exercise any of the rights or powers vested in it by this Indenture at the request or direction of any of the Holders pursuant to this Indenture, unless such Holders shall have offered to the Trustee reasonable security or indemnity against the costs, expenses and liabilities which might be incurred by it in compliance with such request or direction; (vi) the Trustee shall not be bound to make any investigation into the facts or matters stated in any resolution, certificate, statement, instrument, opinion, report, notice, request, direction, consent, order, bond, security or other paper or document, but the Trustee, in its discretion, may make further inquiry or investigation into such facts or matters as it may see fit, and, if the Trustee shall determine to make such further inquiry or investigation, it shall be entitled to examine the books, records and premises of the Company, personally or by agent or attorney and, if so requested to do so by any of the Holders, at the sole cost and expense of the Holders; (vii) the Trustee may execute any of the trusts or powers hereunder or perform any duties hereunder either directly or by or through agents or attorneys and the Trustee shall not be responsible for any misconduct or negligence on the part of any agent or attorney appointed with due care by it hereunder; (viii) the Trustee shall not be charged with knowledge of any default (as defined in Section 8.02) or Event of Default unless either (1) a Responsible Officer of the Trustee shall have actual knowledge of such default or Event of Default or (2) written notice of such default or Event of Default shall have been given to the Trustee by the Company or any Holder; Page 74
(ix) the Trustee shall not be liable for any action taken, suffered or omitted by it in good faith and reasonably believed by it to be authorized or within the discretion or rights or powers conferred upon it by this Indenture; and (x) in the event that the Trustee is also acting as Paying Agent, Authenticating Agent or Security Registrar hereunder, the rights and protections afforded to the Trustee pursuant to this Article Eight shall also be afforded to such Paying Agent, Authenticating Agent or Security Registrar. SECTION 8.04. Not Responsible for Recitals or Issuance of Securities. The recitals contained herein and in the Securities, except the Trustee's certificates of authentication, shall be taken as the statements of the Company, and neither the Trustee nor any Authenticating Agent assumes responsibility for their correctness. The Trustee makes no representations as to the validity or sufficiency of this Indenture or of the Securities. The Trustee shall not be accountable for the use or application by the Company of Securities or the proceeds thereof. SECTION 8.05. May Hold Securities. The Trustee, any Authenticating Agent, any Paying Agent, the Security Registrar or any other agent of the Company, in its individual or any other capacity, may become the owner or pledgee of Securities and, subject to Sections 8.08 and 8.13, may otherwise deal with the Company with the same rights it would have if it were not Trustee, Authenticating Agent, Paying Agent, Security Registrar or such other agent. SECTION 8.06. Money Held in Trust. Money held by the Trustee in trust hereunder need not be segregated from other funds except to the extent required by law. The Trustee shall be under no liability for interest on any money received by it hereunder except as otherwise agreed in writing with the Company. SECTION 8.07. Compensation and Reimbursement. The Company agrees: (i) to pay to the Trustee from time to time reasonable compensation for all services rendered by it hereunder (which compensation shall not be limited by any provision of law in regard to the compensation of a trustee of an express trust); Page 75
(ii) except as otherwise expressly provided herein, to reimburse the Trustee upon its request for all reasonable expenses, disbursements and advances incurred or made by the Trustee in accordance with any provision of this Indenture (including the reasonable compensation and the expenses and disbursements of its agents and counsel), except any such expense, disbursement or advance as may be attributable to its negligence or bad faith; and (iii) to indemnify the Trustee for, and to hold it harmless against, any loss, liability or expense incurred without negligence or bad faith on its part, arising out of or in connection with the acceptance or administration of this trust, including the costs and expenses of defending itself against any claim or liability in connection with the exercise or performance of any of its powers or duties hereunder. As security for the performance of the obligations of the Company under this Section the Trustee shall have a lien prior to the Securities upon all property and funds held or collected by the Trustee as such, except funds held in trust for the payment of principal of, premium, if any, or interest on particular Securities. Without prejudice to any other rights available to the Trustee under applicable law, when the Trustee incurs expenses or renders services in connection with an Event of Default specified in Section 7.01(iv) or (v), the expenses (including the reasonable fees and expenses of its counsel) and the compensation for the services are intended to constitute expenses of administration under any applicable bankruptcy, insolvency or other similar law. The obligations of the Company set forth in this Section 8.07 and any lien arising hereunder shall survive the resignation or removal of any Trustee, the discharge of the Company's obligations pursuant to Article Eleven of this Indenture and the termination of this Indenture and the repayment of the Securities whether at the Stated Maturity or otherwise. SECTION 8.08. Disqualification; Conflicting Interests. If the Trustee has or shall acquire a conflicting interest within the meaning of Section 310 of the Trust Indenture Act, the Trustee shall either eliminate such conflicting interest or resign, to the extent and in Page 76
the manner provided by, and subject to the provisions of, the Trust Indenture Act and this Indenture. To the extent permitted by the Trust Indenture Act, the Trustee shall not be deemed to have a conflicting interest with respect to the Securities of any series by virtue of being Trustee with respect to the Securities of any particular series of Securities other than that series. SECTION 8.09. Corporate Trustee Required; Eligibility. There shall at all times be a Trustee with respect to each series of Securities hereunder which shall be a corporation organized and doing business under the laws of the United States of America, any State thereof or the District of Columbia, authorized under such laws to exercise corporate trust powers, having a combined capital and surplus of at least $5,000,000, subject to supervision or examination by Federal or State authority; provided, however, that if Section 310(a) of the Trust Indenture Act or the rules and regulations of the Commission under the Trust Indenture Act at any time permit a corporation organized and doing business under the laws of any other jurisdiction to serve as trustee of an indenture qualified under the Trust Indenture Act, this Section 8.09 shall be automatically deemed amended to permit a corporation organized and doing business under the laws of any such jurisdiction to serve as Trustee hereunder. If such corporation publishes reports of condition at least annually, pursuant to law or to the requirements of the aforesaid supervising or examining authority, then for the purposes of this Section, the combined capital and surplus of such corporation shall be deemed to be its combined capital and surplus as set forth in its most recent report of condition so published. Neither the Company nor any person directly or indirectly controlling, controlled by or under common control with the Company may serve as Trustee. If at any time the Trustee with respect to any series of Securities shall cease to be eligible in accordance with the provisions of this Section, it shall resign immediately in the manner and with the effect hereinafter specified in this Article. SECTION 8.10. Resignation and Removal; Appointment of Successor. (i) No resignation or removal of the Trustee and no appointment of a successor Trustee pursuant to this Article shall become effective until the acceptance of appointment by the successor Trustee under Section 8.11. Page 77
(ii) The Trustee may resign with respect to any series of Securities at any time by giving written notice thereof to the Company. If an instrument of acceptance by a successor Trustee shall not have been delivered to the resigning Trustee within 30 days after the giving of such notice of resignation, the resigning Trustee may petition any court of competent jurisdiction for the appointment of a successor Trustee with respect to Securities of such series. (iii) The Trustee may be removed with respect to any series of Securities at any time by Act of the Holders of a majority in principal amount of the Outstanding Securities of such series, delivered to the Trustee and to the Company. (iv) If at any time: (a) the Trustee shall fail to comply with Section 8.08 with respect to any series of Securities after written request therefor by the Company or by any Holder who has been a bona fide Holder of a Security of such series for at least six months; or (b) the Trustee shall cease to be eligible under Section 8.09 with respect to any series of Securities and shall fail to resign after written request therefor by the Company or by any Holder of Securities of such series; or (c) the Trustee shall become incapable of acting with respect to any series of Securities or shall be adjudged a bankrupt or insolvent or a receiver of the Trustee or of its property shall be appointed or any public officer shall take charge or control of the Trustee or of its property or affairs for the purpose of rehabilitation, conservation or liquidation; then, in any such case, (1) the Company by a Board Resolution may remove the Trustee with respect to such series, or (2) subject to Section 7.14, any Holder who has been a bona fide Holder of a Security of such series for at least six months may, on behalf of himself and all others similarly situated, petition any court of competent jurisdiction for the removal of the Trustee and the appointment of a successor Trustee with respect to such series. Page 78
(v) If the Trustee shall resign, be removed or become incapable of acting with respect to any series of Securities, or if a vacancy shall occur in the office of Trustee with respect to any series of Securities for any cause, the Company, by a Board Resolution, shall promptly appoint a successor Trustee or Trustees with respect to the Securities of that or those series (it being understood that any such successor Trustee may be appointed with respect to the Securities of one or more or all of such series and that at any time there shall be only one Trustee with respect to the Securities of any particular series) and shall comply with the applicable requirements of Section 8.11. If, within one year after such resignation, removal or incapability, or the occurrence of such vacancy, a successor Trustee with respect to such series of Securities shall be appointed by the Act of the Holders of a majority in principal amount of the Outstanding Securities of such series delivered to the Company and the retiring Trustee with respect to such series, the successor Trustee so appointed shall, forthwith upon its acceptance of such appointment, become the successor Trustee with respect to such series and to that extent supersede the successor Trustee appointed by the Company with respect to such series. If no successor Trustee with respect to such series shall have been so appointed by the Company or the Holders of Securities of such series and accepted appointment in the manner hereinafter provided, any Holder who has been a bona fide Holder of a Security of such series for at least six months may, on behalf of himself and all others similarly situated, petition any court of competent jurisdiction for the appointment of a successor Trustee with respect to such series. (vi) The Company shall give notice of each resignation and each removal of the Trustee with respect to the Securities of any series and each appointment of a successor Trustee with respect to the Securities of any series by mailing written notice of such event by first-class mail, postage prepaid, to the Holders of Registered Securities of such series as their names and addresses appear in the Security Register and, if Securities of such series are issuable as Bearer Securities, by publishing notice of such event once in an Authorized Newspaper in each Place of Payment for the Securities of such series located outside the United States. Each notice shall include the name of the successor Trustee with respect to the Securities of such series and the address of its Principal Corporate Trust Office. Page 79
SECTION 8.11. Acceptance of Appointment by Successor. (i) In the case of the appointment hereunder of a successor Trustee with respect to any series of Securities, every such successor Trustee so appointed shall execute, acknowledge and deliver to the Company and to the retiring Trustee an instrument accepting such appointment, and thereupon the resignation or removal of the retiring Trustee shall become effective with respect to all or any series as to which it is resigning as Trustee, and such successor Trustee, without any further act, deed or conveyance, shall become vested with all the rights, powers, trusts and duties of the retiring Trustee with respect to all or any such series; but, on request of the Company or such successor Trustee, such retiring Trustee shall upon payment of its charges, execute and deliver an instrument transferring to such successor Trustee all the rights, powers and trusts of such retiring Trustee with respect to all or any such series; and shall duly assign, transfer and deliver to such successor Trustee all property and money held by such retiring Trustee hereunder with respect to all or any such series, subject nevertheless to its lien, if any, provided for in Section 8.07. (ii) In case of the appointment hereunder of a successor Trustee with respect to the Securities of one or more (but not all) series, the Company, the retiring Trustee and each successor Trustee with respect to the Securities of one or more series shall execute and deliver an indenture supplemental hereto wherein each successor Trustee shall accept such appointment and which (a) shall contain such provisions as shall be necessary or desirable to transfer and confirm to, and to vest in, each successor Trustee all the rights, powers, trusts and duties of the retiring Trustee with respect to the Securities of that or those series to which the appointment of such successor Trustee relates, (b) if the retiring Trustee is not retiring with respect to all Securities, shall contain such provisions as shall be deemed necessary or desirable to confirm that all the rights, powers, trusts and duties of the retiring Trustee with respect to the Securities of that or those series as to which the retiring Trustee is not retiring shall continue to be vested in the retiring Trustee, and (c) shall add to or change any of the provisions of this Indenture as shall be necessary to provide for or facilitate the administration of the trusts hereunder by more than one Trustee, it being understood that nothing herein or in such supplemental indenture shall constitute such Trustees co-trustees of the same trust and that each such Trustee Page 80
shall be trustee of a trust or trusts hereunder separate and apart from any trust or trusts hereunder administered by any other such Trustee; and upon the execution and delivery of such supplemental indenture the resignation or removal of the retiring Trustee shall become effective to the extent provided therein and each such successor Trustee, without any further act, deed or conveyance, shall become vested with all the rights, powers, trusts and duties of the retiring Trustee with respect to the Securities of that or those series to which the appointment of such successor Trustee relates; but, on request of the Company or any successor Trustee, such retiring Trustee shall duly assign, transfer and deliver to such successor Trustee all property and money held by such retiring Trustee hereunder with respect to the Securities of that or those series to which the appointment of such successor Trustee relates, subject nevertheless to its lien, if any, provided for in Section 8.07. (iii) Upon request of any such successor Trustee, the Company shall execute any and all instruments for more fully and certainly vesting in and confirming to such successor Trustee all such rights, powers and trusts referred to in paragraph (i) or (ii) of this Section, as the case may be. (iv) No successor Trustee with respect to a series of Securities shall accept its appointment unless at the time of such acceptance such successor Trustee shall be qualified and eligible with respect to such series under this Article. SECTION 8.12. Merger, Conversion, Consolidation or Succession to Business of Trustee. Any corporation into which the Trustee may be merged or converted or with which it may be consolidated, or any corporation resulting from any merger, conversion or consolidation to which the Trustee shall be a party, or any corporation succeeding to all or substantially all of the corporate trust business of the Trustee, shall be the successor of the Trustee hereunder; provided that such corporation shall be otherwise qualified and eligible under this Article, without the execution or filing of any paper or any further act on the part of any of the parties hereto. In case any Securities shall have been authenticated, but not delivered, by the Trustee then in office, any successor by merger, conversion or consolidation to such authenticating Trustee may adopt such authentication and deliver the Securities so authenticated with the same Page 81
effect as if such successor Trustee had itself authenticated such Securities. SECTION 8.13. Preferential Collection of Claims Against Company. If and when the Trustee shall be or become a creditor of the Company (or any other obligor upon the Securities), the Trustee shall be subject to the provisions of Section 311 of the Trust Indenture Act regarding the collection of any claims as a creditor against the Company (or any such other obligor). A Trustee that has resigned or been removed shall be subject to and comply with said Section 311 to the extent required thereby. SECTION 8.14. Appointment of Authenticating Agents. The Trustee may appoint an Authenticating Agent or Agents, which may include any Affiliate of the Company, with respect to one or more series of Securities. Such Authenticating Agent or Agents at the option of the Trustee shall be authorized to act on behalf of the Trustee to authenticate Securities of such series issued upon original issuance, exchange, registration of transfer or partial redemption thereof or pursuant to Section 3.06, and Securities so authenticated shall be entitled to the benefits of this Indenture and shall be valid and obligatory for all purposes as if authenticated by the Trustee hereunder. Whenever reference is made in this Indenture to the authentication and delivery of Securities by the Trustee or the Trustee's certificate of authentication or the delivery of Securities to the Trustee for authentication, such reference shall be deemed to include authentication and delivery on behalf of the Trustee by an Authenticating Agent, a certificate of authentication executed on behalf of the Trustee by an Authenticating Agent and delivery of Securities to the Authenticating Agent on behalf of the Trustee. Each Authenticating Agent shall be acceptable to the Company and shall at all times be a corporation organized and doing business under the laws of the United States of America, any State thereof or the District of Columbia, authorized under such laws to act as Authenticating Agent, having a combined capital and surplus of not less than $5,000,000 and subject to supervision or examination by Federal or State authority. Notwithstanding the foregoing, an Authenticating Agent located outside the United States may be appointed by the Trustee if previously approved in writing by the Company and if such Authenticating Agent meets the minimum capitalization requirements of this Section 8.14. If such Authenticating Agent publishes reports of condition at least annually, Page 82
pursuant to law or to the requirements of said supervising or examining authority, then for the purposes of this Section, the combined capital and surplus of such Authenticating Agent shall be deemed to be its combined capital and surplus as set forth in its most recent report of condition so published. If at any time an Authenticating Agent shall cease to be eligible in accordance with the provisions of this Section, such Authenticating Agent shall resign immediately in the manner and with the effect specified in this Section. Any corporation into which an Authenticating Agent may be merged or converted or with which it may be consolidated, or any corporation resulting from any merger, conversion or consolidation to which such Authenticating Agent shall be a party, or any corporation succeeding to the corporate agency or corporate trust business of an Authenticating Agent, shall continue to be an Authenticating Agent; provided such corporation shall be otherwise eligible under this Section, without the execution or filing of any paper or any further act on the part of the Trustee or the Authenticating Agent. An Authenticating Agent may resign at any time by giving written notice thereof to the Trustee and to the Company. The Trustee may at any time (and upon request by the Company shall) terminate the agency of an Authenticating Agent by giving written notice thereof to such Authenticating Agent and to the Company. Upon receiving such a notice of resignation or upon such termination, or in case at any time such Authenticating Agent shall cease to be eligible in accordance with the provisions of this Section, the Trustee may appoint a successor Authenticating Agent which shall be acceptable to the Company. Any successor Authenticating Agent upon acceptance of its appointment hereunder shall become vested with all the rights, powers and duties of its predecessor hereunder, with like effect as if originally named as an Authenticating Agent. No successor Authenticating Agent shall be appointed unless eligible under the provisions of this Section. If an appointment with respect to one or more series is made pursuant to this Section, the Securities of such series may have endorsed thereon, in addition to the Trustee's certificate of authentication, an alternate certificate of authentication in the following form: Page 83
This is one of the Securities of the series designated therein referred to in the within-mentioned Indenture. THE CHASE MANHATTAN BANK, as Trustee, by _________________________ as Authenticating Agent by _________________________ Authorized Signatory ARTICLE NINE Supplemental Indentures SECTION 9.01. Supplemental Indentures Without Consent of Holders. Without the consent of any Holder of any Securities or coupons, the Company, when authorized by a Board Resolution, and the Trustee, at any time and from time to time, may enter into one or more indentures supplemental hereto, in form satisfactory to the Trustee, for any of the following purposes: (i) to evidence the succession of another corporation or Person to the Company, and the assumption by any such successor of the covenants of the Company herein and in the Securities contained; or (ii) to evidence and provide for the acceptance of appointment by another corporation as a successor Trustee hereunder with respect to one or more series of Securities and to add to or change any of the provisions of this Indenture as shall be necessary to provide for or facilitate the administration of the trusts hereunder by more than one Trustee, pursuant to Section 8.11; or (iii) to add to the covenants of the Company, for the benefit of the Holders of Securities of all or any series of Securities or coupons (and if such covenants are to be for the benefit of less than all series of Securities or coupons, stating that such covenants are Page 84
expressly being included solely for the benefit of such series), or to surrender any right or power herein conferred upon the Company; or (iv) to cure any ambiguity, to correct or supplement any provision herein which may be inconsistent with any other provision herein, or to make any other provisions with respect to matters or questions arising under the Indenture; provided that such action shall not adversely affect the interests of the Holders of Securities of any series or any related coupons in any material respect; or (v) to add any additional Events of Default with respect to all or any series of the Securities (and, if such Event of Default is applicable to less than all series of Securities, specifying the series to which such Event of Default is applicable); or (vi) to add to, change or eliminate any of the provisions of this Indenture to provide that Bearer Securities may be registrable as to principal, to change or eliminate any restrictions on the payment of principal of (or premium, if any) or any interest on Bearer Securities, to permit Bearer Securities to be issued in exchange for Registered Securities, to permit Bearer Securities to be issued in exchange for Bearer Securities of other authorized denominations or to permit or facilitate the issuance of Securities in uncertificated form; provided any such action shall not adversely affect the interests of the Holders of Securities of any series or any related coupons in any material respect; or (vii) to add to, change or eliminate any of the provisions of this Indenture; provided that any such addition, change or elimination (a) shall become effective only when there is no Security Outstanding of any series created prior to the execution of such supplemental indenture which is adversely affected by such change in or elimination of such provision or (b) shall not apply to any Securities Outstanding; or (viii) to establish the form or terms of Securities of any series as permitted by Sections 2.02 and 3.01; or Page 85
(ix) to add to or change any provisions of this Indenture to such extent as shall be necessary to permit or facilitate the issuance of Securities convertible into other securities; or (x) to evidence any changes to Section 8.09 as permitted by the terms thereof; or (xi) to add to or change or eliminate any provision of this Indenture as shall be necessary or desirable in accordance with any amendments to the Trust Indenture Act; provided such action shall not adversely affect the interest of Holders of Securities of any series or any appurtenant coupons in any material respect. SECTION 9.02. Supplemental Indentures With Consent of Holders. With the consent of the Holders of not less than a majority in aggregate principal amount of the Outstanding Securities of all series affected by such supplemental indenture or indentures (acting as one class), by Act of said Holders delivered to the Company and the Trustee, the Company, when authorized by a Board Resolution, and the Trustee may enter into an indenture or indentures supplemental hereto for the purpose of adding any provisions to or changing in any manner or eliminating any of the provisions of this Indenture or of modifying in any manner the rights of the Holders of Securities of each such series and any related coupons under this Indenture; provided, however, that no such supplemental indenture shall, without the consent of the Holder of each Outstanding Security affected thereby: (i) change the Maturity of the principal of, or the Stated Maturity of any instalment of interest (or premium, if any) on, any Security, or reduce the principal amount thereof or any premium thereon or the rate of interest thereon, or change the obligation of the Company to pay additional amounts pursuant to Section 5.04 (except as contemplated by Section 10.01(i) and permitted by Section 9.01), or reduce the amount of the principal of an Original Issue Discount Security that would be due and payable upon a declaration of acceleration of the Maturity thereof pursuant to Section 7.02, or change the method of calculating interest thereon or the coin or currency in which any Security (or premium, if any, thereon) or the interest thereon is payable, or reduce the minimum rate Page 86
of interest thereon, or impair the right to institute suit for the enforcement of any such payment on or after the Stated Maturity thereof (or, in the case of redemption or repayment, on or after the Redemption Date or Repayment Date); (ii) reduce the percentage in principal amount of the Outstanding Securities of any series, the consent of whose Holders is required for any such supplemental indenture or the consent of whose Holders is required for any waiver of certain defaults hereunder and their consequences) provided for in this Indenture or reduce the requirements of Section 15.04 for a quorum; (iii) change any obligation of the Company to maintain an office or agency in the places and for the purposes specified in Section 5.02; or (iv) modify any of the provisions of this Section or Section 7.13, except to increase any such percentage or to provide that certain other provisions of this Indenture cannot be modified or waived. A supplemental indenture which changes or eliminates any covenant or other provision of this Indenture which has expressly been included solely for the benefit of one or more particular series of Securities, or which modifies the rights of the Holders of Securities of such series with respect to such covenant or other provision, shall be deemed not to affect the rights under this Indenture of the Holders of Securities of any other series. It shall not be necessary for any Act of Holders under this Section to approve the particular form of any proposed supplemental indenture, but it shall be sufficient if such Act shall approve the substance thereof. SECTION 9.03. Execution of Supplemental Indentures. In executing, or accepting the additional trusts created by, any supplemental indenture permitted by this Article or the modifications thereby of the trusts created by this Indenture, the Trustee shall be entitled to receive, and (subject to Section 8.01) shall be fully protected in relying upon, an Opinion of Counsel stating that the execution of such supplemental indenture is authorized or permitted by and complies with this Indenture. The Trustee may, but shall not be obligated to, enter into any such supplemental indenture which affects the Trustee's Page 87
own rights, liabilities, duties or immunities under this Indenture or otherwise. SECTION 9.04. Effect of Supplemental Indentures. Upon the execution of any supplemental indenture under this Article, this Indenture shall be modified in accordance therewith, and such supplemental indenture shall form a part of this Indenture for all purposes; and every Holder of Securities theretofore or thereafter authenticated and delivered hereunder shall be bound thereby. SECTION 9.05. Conformity with Trust Indenture Act. Every supplemental indenture executed pursuant to this Article shall conform to the requirements of the TIA as then in effect. SECTION 9.06. Reference in Securities to Supplemental Indentures. Securities authenticated and delivered after the execution of any supplemental indenture pursuant to this Article may, and shall, if required by the Trustee, bear a notation in form approved by the Trustee as to any matter provided for in such supplemental indenture. If the Company shall so determine, new Securities so modified as to conform, in the opinion of the Trustee and the Company, to any such supplemental indenture may be prepared and executed by the Company and authenticated and delivered by the Trustee in exchange for Outstanding Securities. ARTICLE TEN Consolidation, Merger, Conveyance or Transfer SECTION 10.01. Company May Consolidate, etc., Only on Certain Terms. The Company shall not consolidate with or merge into any other corporation or convey or transfer its properties and assets substantially as an entirety to any Person, unless: (i) the Person formed by such consolidation or into which the Company is merged or the Person which acquires by conveyance or transfer the properties and assets of the Company substantially as an entirety shall expressly assume, by an indenture supplemental hereto, executed and delivered to the Trustee, in form satisfactory to the Trustee, the due and punctual payment of the principal of, premium, if any, and Page 88
interest (including all additional amounts, if any, payable pursuant to Section 5.04) on all the Securities and the performance of every covenant of this Indenture on the part of the Company to be performed or observed; (ii) immediately after giving effect to such transaction, no Event of Default, and no event which, after notice or lapse of time, or both, would become an Event of Default, shall have happened and be continuing; and (iii) the Company has delivered to the Trustee an Officers' Certificate and an Opinion of Counsel each stating that such consolidation, merger, conveyance or transfer and such supplemental indenture comply with this Article and that all conditions precedent herein provided for relating to such transaction have been complied with. SECTION 10.02. Successor Corporation Substituted. Upon any consolidation or merger, or any conveyance or transfer of the properties and assets of the Company substantially as an entirety in accordance with Section 10.01, the successor Person formed by such consolidation or into which the Company is merged or to which such conveyance or transfer is made shall succeed to, and be substituted for, and may exercise every right and power of, the Company under this Indenture with the same effect as if such successor Person had been named as the Company herein. In the event of any such conveyance or transfer, the Company as the predecessor corporation shall be relieved of all obligations and covenants under this Indenture and may be dissolved, wound up and liquidated at any time thereafter. ARTICLE ELEVEN Satisfaction and Discharge SECTION 11.01. Satisfaction and Discharge of Indenture. This Indenture shall cease to be of further effect (except as to any surviving rights of registration of transfer or exchange of Securities herein expressly provided for and rights to receive payments thereon and any right to receive additional amounts, as provided in Section 5.04), and the Trustee, on receipt of a Company Request and at the expense of the Company, shall execute proper instruments Page 89
acknowledging satisfaction and discharge of this Indenture, when: (i) either (a) all Securities theretofore authenticated and delivered (other than (1) coupons appertaining to Bearer Securities surrendered for exchange for Registered Securities and maturing after such exchange, whose surrender is not required or has not been waived as provided in Section 3.05, (2) coupons appertaining to Bearer Securities called for redemption and maturing after the relevant Redemption Date, whose surrender has been waived as provided in Section 4.06, (3) coupons appertaining to Bearer Securities surrendered for repayment pursuant to Section 15.03 and maturing after the Repayment Date, whose surrender has been waived as provided in Section 15.03, (4) Securities and coupons which have been destroyed, lost or stolen and which have been replaced or paid as provided in Section 3.06, and (5) Securities for whose payment money has theretofore been deposited in trust or segregated and held in trust by the Company and thereafter repaid to the Company or discharged from such trust, as provided in Section 5.03) have been delivered to the Trustee for cancellation; or (b) all such Securities not theretofore delivered to the Trustee for cancellation (1) have become due and payable, or (2) will become due and payable at their Maturity within one year, or (3) are to be called for redemption within one year under arrangements satisfactory to the Trustee for the giving of notice of redemption by the Trustee in the name, and at the expense, of the Company, and the Company, in the case of (b) (1), (2) or (3) above, has deposited or caused to be deposited with the Trustee, as trust funds in trust for the purpose, an amount sufficient to pay and discharge the entire indebtedness on such Securities and coupons not Page 90
theretofore delivered to the Trustee for cancellation, for principal, premium, if any, and interest to the date of such deposit (in the ease of Securities which have become due and payable), or to the Maturity or Redemption Date, as the case may be; (ii) the Company has paid or caused to be paid all other sums payable hereunder by the Company; and (iii) the Company has delivered to the Trustee an Officers' Certificate and an Opinion of Counsel each stating that all conditions precedent herein provided for relating to the satisfaction and discharge of this Indenture have been complied with. Notwithstanding the satisfaction and discharge of this Indenture, the obligations of the Company to the Trustee under Section 8.07 and, if money shall have been deposited with the Trustee pursuant to subclause (b) of clause (i) of this Section, the obligations of the Trustee under Section 11.02 and the last paragraph of Section 5.03 shall survive. SECTION 11.02. Application of Trust Money. Subject to the provisions of the last paragraph of Section 5.03, all money deposited with the Trustee pursuant to Section 11.01 shall be held in trust and applied by it, in accordance with the provisions of the Securities, the coupons, if any, and this Indenture, to the payment, either directly or through any Paying Agent (including the Company acting as its own Paying Agent), as the Trustee may determine, to the Persons entitled thereto, of the principal, premium, if any, and interest for whose payment such money has been deposited with the Trustee; but such money need not be segregated from other funds except to the extent required by law. SECTION 11.03. Reinstatement. If the Trustee or any Paying Agent is unable to apply any money in accordance with Section 11.02 by reason of any legal proceeding or by reason of any order or judgment of any court or governmental authority enjoining, restraining or otherwise prohibiting such application, the Company's obligations under this Indenture and the Securities shall be revived and reinstated as though no deposit had occurred pursuant to Section 11.01 until such time as the Trustee or any Paying Agent is permitted to apply all such money in accordance with Section 11.02. Page 91
ARTICLE TWELVE Immunity of Incorporators, Stockholders, Officers and Directors SECTION 12.01. Exemption from Individual Liability. No recourse under or upon any obligation, covenant or agreement of this Indenture, or of any Security or coupon, or for any claim based thereon or otherwise in respect thereof, shall be had against any incorporator, stockholder, officer or director, as such, past, present or future, of the Company or of any successor corporation, either directly or through the Company, whether by virtue of any constitution, statute or rule of law, or by the enforcement of any assessment or penalty or otherwise; it being expressly understood that this Indenture and the obligations issued hereunder are solely corporate obligations of the Company, and that no such personal liability whatever shall attach to, or is or shall be incurred by, the incorporators, stockholders, officers or directors, as such, of the Company or of any successor corporation, or any of them, because of the creation of the indebtedness hereby authorized, or under or by reason of the obligations, covenants or agreements contained in this Indenture or in any of the Securities or coupons or implied therefrom; and that any and all such personal liability, either at common law or in equity or by constitution or statute, of, and any and all such rights and claims against, every such incorporator, stockholder, officer or director, as such, because of the creation of the indebtedness hereby authorized, or under or by reason of the obligations, covenants or agreements contained in this Indenture or in any of the Securities or coupons or implied therefrom, are hereby expressly waived and released as a condition of, and as a consideration for, the execution of this Indenture and the issuance of the Securities. ARTICLE THIRTEEN Sinking Funds SECTION 13.01. Applicability of Article. The provisions of this Article shall be applicable to any sinking fund for the retirement of Securities of a series except as otherwise specified as contemplated by Section 3.01 for Securities of such series. Page 92
The minimum amount of any sinking fund payment provided for by the terms of Securities of any series is herein referred to as a "mandatory sinking fund payment", and any payment in excess of such minimum amount provided for by the terms of Securities of any series is herein referred to as an "optional sinking fund payment". If provided for by the terms of Securities of any series, the cash amount of any sinking fund payment may be subject to reduction as provided in Section 13.02. Each sinking fund payment shall be applied to the redemption of Securities of any series as provided for by the terms of Securities of such series. SECTION 13.02. Satisfaction of Sinking Fund Payments with Securities. The Company (i) may deliver Outstanding Securities of a series (other than any previously called for redemption), together in the case of any Bearer Securities of such series with all unmatured coupons appertaining thereto and (ii) may apply as a credit Securities of a series which have been redeemed either at the election of the Company pursuant to the terms of such Securities or through the application of permitted optional sinking fund payments pursuant to the terms of such Securities, in each case in satisfaction of all or any part of any sinking fund payment with respect to the Securities of such series required to be made pursuant to the terms of such Securities as provided for by the terms of such series; provided that such Securities have not been previously so credited. Such Securities shall be received and credited for such purpose by the Trustee at the Redemption Price specified in such Securities for redemption through operation of the sinking fund and the amount of such sinking fund payment shall be reduced accordingly. SECTION 13.03. Redemption of Securities for Sinking Fund. Not less than 60 days prior to each sinking fund payment date for any series of Securities, the Company will deliver to the Trustee and the Security Registrar an Officers' Certificate specifying (i) the amount of the next ensuing sinking fund payment for that series pursuant to the terms of that series, (ii) the portion thereof, if any, which is to be satisfied by payment of cash and the portion thereof, if any, which is to be satisfied by delivering and crediting Securities of that series pursuant to Section 13.02, and (iii) that none of such Securities has theretofore been so credited and stating the basis for such credit, and will also deliver to the Trustee any Securities to be so delivered. Not less than 30 days before each Page 93
sinking fund payment date the Security Registrar shall select the Securities to be redeemed upon such sinking fund payment date in the manner specified in Section 4.03 and cause notice of the redemption thereof to be given in the name of and at the expense of the Company in the manner provided in Section 4.04. Such notice having been duly given, the redemption of such Securities shall be made upon the terms and in the manner stated in Sections 4.06 and 4.07 and shall be subject to Section 4.08. ARTICLE FOURTEEN Repayment at the Option of Holders SECTION 14.01. Applicability of Article. Securities of any series which are repayable at the option of the Holders thereof before their Stated Maturity shall be repaid in accordance with their terms and (except as otherwise specified pursuant to Section 3.01 for Securities of such series) in accordance with this Article. SECTION 14.02. Repayment of Securities. Each Security which is subject to repayment in whole or in part at the option of the Holder thereof on a Repayment Date shall be repaid at the applicable Repayment Price together with interest accrued to such Repayment Date as specified pursuant to Section 3.01. SECTION 14.03. Exercise of Option, Notice. Each Holder desiring to exercise such Holder's option for repayment shall, as conditions to such repayment, surrender the Security to be repaid in whole or in part together with written notice of the exercise of such option at any office or agency of the Company in a Place of Payment, not less than 30 nor more than 45 days prior to the Repayment Date; provided, however, that surrender of Bearer Securities together with written notice of exercise of such option shall be made at an office or agency located outside the United States except as otherwise provided in Section 5.02. Such notice, which shall be irrevocable, shall specify the principal amount of such Security to be repaid, which shall be equal to the minimum authorized denomination for such Security or an integral multiple thereof, and shall identify the Security to be repaid and, in the case of a partial repayment of the Security, shall specify the denomination or denominations of the Security or Securities of the same series to be issued to the Holder for the portion of the Page 94
principal of the Security surrendered which is not to be repaid. If any Bearer Security surrendered for repayment shall not be accompanied by all unmatured coupons and all matured coupons in default, such Bearer Security may be paid after deducting from the Repayment Price an amount equal to the face amount of all such missing coupons, or the surrender of such missing coupon or coupons may be waived by the Company and the Trustee if there be furnished to them such security or indemnity as they may require to save each of them and any Paying Agent harmless. If thereafter the Holder of such Bearer Security shall surrender to the Trustee or any Paying Agent any such missing coupon in respect of which a deduction shall have been made from the Repayment Price, such Holder shall be entitled to receive the amount so deducted without interest thereon; provided, however, that interest represented by coupons shall be payable only at an office or agency located outside the United States except as otherwise provided in Section 5.02. The Company shall execute and the Trustee shall authenticate and deliver without service charge to the Holder of any Registered Security so surrendered a new Registered Security or Securities of the same series and tenor, of any authorized denomination specified in the foregoing notice, in an aggregate principal amount equal to any portion of the principal of the Registered Security so surrendered which is not to be repaid. The Company shall execute and the Trustee shall authenticate and deliver without service charge to the Holder of any Bearer Security so surrendered a new Registered Security or Securities or new Bearer Security or Securities (and all appurtenant unmatured coupons and matured coupons in default) or any combination thereof of the same series and tenor of any authorized denomination or denominations specified in the foregoing notice, in an aggregate principal amount equal to any portion of the principal of the Security so surrendered which is not to be repaid; provided, however, that the issuance of a Registered Security therefor shall be subject to applicable laws and regulations, including provisions of the United States Federal income tax laws and regulations in effect at the time of the exchange; neither the Company, the Trustee nor the Security Registrar shall issue Registered Securities for Bearer Securities if it has received an Opinion of Counsel that as a result of such issuance the Company would suffer Page 95
adverse consequences under the United States Federal income tax laws then in effect and the Company has delivered to the Trustee a Company Order directing the Trustee not to make such issuances thereafter unless and until the Trustee receives a subsequent Company Order to the contrary. The Company shall deliver copies of such Company Order to the Security Registrar. For all purposes of this Indenture, unless the context otherwise requires, all provisions relating to the repayment of Securities shall relate, in the case of any Security repaid or to be repaid only in part, to the portion of the principal of such Security which has been or is to be repaid. SECTION 14.04. Election of Repayment by Remarketing Entities. The Company may elect, with respect to Securities of any series which are repayable at the option of the Holders thereof before their Stated Maturity, at any time prior to any Repayment Date to designate one or more Remarketing Entities to purchase, at a price equal to the Repayment Price, Securities of such series from the Holders thereof who give notice and surrender their Securities in accordance with Section 14.03. SECTION 14.05. Securities Payable on the Repayment Date. Notice of exercise of the option of repayment having been given and the Securities so to be repaid having been surrendered as aforesaid, such Securities shall, unless purchased in accordance with Section 14.04, on the Repayment Date become due and payable at the price therein specified and from and after the Repayment Date such Securities shall cease to bear interest and shall be paid on the Repayment Date, and the coupons for such interest appertaining to Bearer Securities so to be repaid, except to the extent provided above, shall be void, unless the Company shall default in the payment of such price, in which case the Company shall continue to be obligated for the principal amount of such Securities and shall be obligated to pay interest on such principal amount at the rate prescribed therefor by such Securities from time to time until payment in full of such principal amount. Page 96
ARTICLE FIFTEEN Meetings of Holders of Securities SECTION 15.01. Purposes for Which Meetings May Be Called. If Securities of a series are issuable in whole or in part as Bearer Securities, a meeting of Holders of Securities of such series may be called at any time and from time to time pursuant to this Article to make, give or take any request, demand, authorization, direction, notice, consent, waiver or other Act provided by this Indenture to be made, given or taken by Holders of Securities of such series. SECTION 15.02. Call, Notice and Place of Meetings. (i) The Trustee may at any time call a meeting of Holders of Securities of any series issuable in whole or in part as Bearer Securities for any purpose specified in Section 15.01, to be held at such time and at such place in the City of Columbus, Ohio, the Borough of Manhattan, The City of New York, or in London as the Trustee shall determine. Notice of every meeting of Holders of Securities of any series, setting forth the time and the place of such meeting and in general terms the action proposed to be taken at such meeting, shall be given, in the manner provided in Section 1.06, not less than 21 nor more than 180 days prior to the date fixed for the meeting. (ii) In case at any time the Company, pursuant to a Board Resolution, or the Holders of at least 10% in principal amount of the Outstanding Securities of any such series shall have requested the Trustee to call a meeting of the Holders of Securities of such series for any purpose specified in Section 15.01, by written request setting forth in reasonable detail the action proposed to be taken at the meeting, and the Trustee shall not have made the first publication of the notice of such meeting within 21 days after receipt of such request or shall not thereafter proceed to cause the meeting to be held as provided herein, then the Company or the Holders of Securities of such series in the amount above specified, as the case may be, may determine the time and the place in the City of Columbus, Ohio, the Borough of Manhattan, The City of New York, or in London for such meeting and may call such meeting for such purposes by giving notice thereof as provided in subsection (i) of this Section. Page 97
SECTION 15.03. Persons Entitled to Vote at Meetings. To be entitled to vote at any meeting of Holders of Securities of any series, a Person shall be (1) a Holder of one or more Outstanding Securities of such series, or (2) a Person appointed by an instrument in writing as proxy for a Holder or Holders of one or more Outstanding Securities of such series by such Holder or Holders. The only Persons who shall be entitled to be present or to speak at any meeting of Holders of Securities of any series shall be the Persons entitled to vote at such meeting and their counsel, any representatives of the Trustee and its counsel and any representatives of the Company and its counsel. SECTION 15.04. Quorum; Action. The Persons entitled to vote a majority in principal amount of the Outstanding Securities of a series shall constitute a quorum for a meeting of Holders of Securities of such series; provided, however, that if any action is to be taken at such meeting with respect to a consent or waiver which this Indenture expressly provides may be given by the Holders of a greater percentage in principal amount of the Outstanding Securities of a series, the Persons entitled to vote such greater percentage in principal amount of the Outstanding Securities of such series shall constitute a quorum. In the absence of a quorum within 30 minutes of the time appointed for any such meeting, the meeting shall, if convened at the request of Holders of Securities of such series, be dissolved. In the absence of a quorum in any other case the meeting may be adjourned for a period of not less than 10 days as determined by the chairman of the meeting prior to the adjournment of such meeting. In the absence of a quorum at any such adjourned meeting, such adjourned meeting may be further adjourned for a period of not less than 10 days as determined by the chairperson of the meeting prior to the adjournment of such adjourned meeting. Notice of the reconvening of any adjourned meeting shall be given as provided in Section 15.02(i), except that such notice need be given only once not less than five days prior to the date on which the meeting is scheduled to be reconvened. Notice of the reconvening of an adjourned meeting shall state expressly the percentage, as provided above, of the principal amount of the Outstanding Securities of such series which shall constitute a quorum. Except as limited by the provisos to Section 9.02, any resolution presented to a meeting or adjourned meeting duly reconvened at which a quorum is present as aforesaid may be adopted only by the affirmative vote of the Holders Page 98
of a majority in principal amount of the Outstanding Securities of the series; provided, however, that, except as limited by the provisos to Section 9.02, any resolution with respect to any consent or waiver which this Indenture expressly provides may be given by the Holders of a greater percentage in principal amount of the Outstanding Securities of a series may be adopted at a meeting or an adjourned meeting duly reconvened and at which a quorum is present as aforesaid only by the affirmative vote of the Holders of such greater percentage in principal amount of the Outstanding Securities of that series; and provided further that, except as limited by the provisos to Section 9.02, any resolution with respect to any request, demand, authorization, direction, notice, consent, waiver or other Act which this Indenture expressly provides may be made, given or taken by the Holders of a specified percentage, which is less than a majority in principal amount of the Outstanding Securities of a series may be adopted at a meeting or an adjourned meeting duly reconvened and at which a quorum is present as aforesaid by the affirmative vote of the Holders of such specified percentage in principal amount of the Outstanding Securities of that series. Any resolution passed or decision taken at any meeting of Holders of Securities of any series duly held in accordance with this Section shall be binding on all the Holders of Securities of such series and the related coupons, whether or not present or represented at the meeting. SECTION 15.05. Determination of Voting Rights; Conduct and Adjournment of Meetings. (a) Notwithstanding any other provisions of this Indenture, the Trustee may make such reasonable regulations as it may deem advisable for any meeting of Holders of Securities of such series in regard to proof of the holding of Securities of such series and of the appointment of proxies and in regard to the appointment and duties of inspectors of votes, the submission and examination of proxies, certificates and other evidence of the right to vote, and such other matters concerning the conduct of the meeting as it shall deem appropriate. Except as otherwise permitted or required by any such regulations, the holding of Securities shall be proved in the manner specified in Section 1.04 and the appointment of any proxy shall be proved in the manner specified in Section 1.04 or, in the case of Bearer Securities, by having the signature of the Page 99
person executing the proxy witnessed or guaranteed by any trust company, bank or banker authorized by Section 1.04 to certify to the holding of Bearer Securities. Such regulations may provide that written instruments appointing proxies, regular on their face, may be presumed valid and genuine without the proof specified in Section 1.04 or other proof. (b) The Trustee shall, by an instrument in writing, appoint a temporary chairperson of the meeting, unless the meeting shall have been called by the Company or by Holders of Securities as provided in Section 15.02(ii), in which case the Company or the Holders of Securities of the series calling the meeting, as the case may be, shall in like manner appoint a temporary chairperson. A permanent chairperson and a permanent secretary of the meeting shall be elected by vote of the Persons entitled to vote a majority in principal amount of the Outstanding Securities of such series represented at the meeting. (c) At any meeting each Holder of a Security of such series or proxy shall be entitled to one vote for each $1,000 principal amount (or the equivalent in ECU, any other composite currency or a Foreign Currency) of Securities of such series held or represented by him; provided, however, that no vote shall be cast or counted at any meeting in respect of any Security challenged as not Outstanding and ruled by the chairperson of the meeting not to be Outstanding. The chairperson of the meeting shall have no right to vote, except as a Holder of a Security of such series or proxy. (d) Any meeting of Holders of Securities of any series duly called pursuant to Section 15.02 at which a quorum is present may be adjourned from time to time by Persons entitled to vote a majority in principal amount of the Outstanding Securities of such series represented at the meeting; and the meeting may be held as so adjourned without further notice. SECTION 15.06. Counting Votes and Recording Action of Meetings. The vote upon any resolution submitted to any meeting of Holders of Securities of any series shall be by written ballots on which shall be subscribed the signatures of the Holders of Securities of such series or of their representatives by proxy and the principal amounts and serial numbers of the Outstanding Securities of such series held or represented by them. The permanent chairperson of Page 100
the meeting shall appoint two inspectors of votes who shall count all votes cast at the meeting for or against any resolution and who shall make and file with the secretary of the meeting their verified written reports in triplicate of all votes cast at the meeting. A record, at least in triplicate, of the proceedings of each meeting of Holders of Securities of any series shall be prepared by the secretary of the meeting and there shall be attached to said record the original reports of the inspectors of votes on any vote by ballot taken thereat and affidavits by one or more persons having knowledge of the facts setting forth a copy of the notice of the meeting and showing that said notice was given as provided in Section 15.02 and, if applicable, Section 15.04. Each copy shall be signed and verified by the affidavits of the permanent chairperson and secretary of the meeting and one such copy shall be delivered to the Company, and another to the Trustee to be preserved by the Trustee, the latter to have attached thereto the ballots voted at the meeting. Any record so signed and verified shall be conclusive evidence of the matters therein stated. ARTICLE SIXTEEN Miscellaneous SECTION 16.01. Counterparts. This Indenture may be executed in any number of counterparts, each of which shall be an original; but such counterparts shall together constitute but one and the same instrument. The Chase Manhattan Bank, hereby accepts the trusts in this Indenture declared and provided, upon the terms and conditions hereinabove set forth. Page 101
IN WITNESS WHEREOF, the parties hereto have caused this Indenture to be duly executed, and their respective corporate seals to be hereunto affixed and attested, all as of the day and year first above written. BANC ONE CORPORATION, by -------------------------- Name: Title: [Seal] Attest: [CORPORATE SEAL] ----------------------- Assistant Secretary THE CHASE MANHATTAN BANK, as Trustee, by -------------------------- Name: Title: [Seal] Attest: [CORPORATE SEAL] - -----------------------
STATE OF OHIO, ) ) ss.: COUNTY OF FRANKLIN ) On this day of February, 1997, before me personally came to me known, , who, being by me duly sworn, did depose and say that he resides at [ ]; that he is [ ] of BANC ONE CORPORATION, one of the corporations described in and which executed the foregoing instrument; that he knows the corporate seal of said corporation; that the seal affixed to said instrument is such corporate seal; that it was so affixed by authority of the Board of Directors of said corporation; and that he signed his name thereto by like authority. _________________________ Notary Public [Notarial Seal]
STATE OF NEW YORK, ) ) ss.: COUNTY OF NEW YORK, ) On this day of February, 1997, before me personally appeared , to me known, who, being by me duly sworn, did depose and say that he resides at ; that he is a of THE CHASE MANHATTAN BANK, one of the parties described in and which executed the foregoing instrument; that he knows the corporate seal of said corporation; that the seal affixed to said instrument is such corporate seal; that it was so affixed by authority of the Board of Directors of said corporation; and that he signed his name thereto by like authority. __________________________ Notary Public [Notarial Seal]
EXHIBIT A FORM OF CERTIFICATE TO BE GIVEN BY PERSON ENTITLED TO RECEIVE BEARER SECURITY CERTIFICATE ................... [Insert title or sufficient description of Securities to be delivered] This is to certify that the above-captioned Securities are not being acquired by or on behalf of a United States person, or, if a beneficial interest in the Securities is being acquired by or on behalf of a United States person, that such United States person is a financial institution within the meaning of Section 1.165-12(c)(1)(v) of the United States Treasury regulations which agrees to comply with the requirements of Section 165(j)(3)(A), (B) or (C) of the Internal Revenue Code of 1986, as amended and the regulations thereunder. If the undersigned is a dealer, the undersigned agrees to obtain a similar certificate from each person entitled to delivery of any of the above-captioned Securities in bearer form purchased from it; provided, however, that, if the undersigned has actual knowledge that the information contained in such a certificate is false, the undersigned will not deliver a Security in temporary or definitive bearer form to the person who signed such certificate notwithstanding the delivery of such certificate to the undersigned. As used herein, "United States person" means any citizen or resident of the United States, any corporation, partnership or other entity created or organized in or under the laws of the United States and any estate or trust the income of which is subject to United States Federal income taxation regardless of its source, and "United States" means the United States of America (including the States and the District of Columbia), its territories, its possessions and other areas subject to its jurisdiction. We undertake to advise you by telex if the above statement as to beneficial ownership is not correct on the date of delivery of the above-captioned Securities in bearer form as to all of such Securities.
We understand that this certificate is required in connection with certain tax legislation in the United States. If administrative or legal proceedings are commenced or threatened in connection with which this certificate is or would be relevant, we irrevocably authorize you to produce this certificate or a copy thereof to any interested party in such proceedings. Dated: 19 [To be dated no earlier than 15 days prior to the Exchange Date] [Name of Person Entitled to Receive Bearer Security) ________________________________ (Authorized Signatory) Name: Title:
EXHIBIT B FORM OF CERTIFICATE TO BE GIVEN BY EUROCLEAR AND CEDEL S.A. IN CONNECTION WITH THE EXCHANGE OF A PORTION OF A TEMPORARY GLOBAL SECURITY CERTIFICATE ................... [Insert title or sufficient description of Securities to be delivered] This is to certify with respect to $____ principal amount of the above-captioned Securities (i) that we have received from each of the persons appearing in our records as persons entitled to a portion of such principal amount (our "Qualified Account Holders") a certificate with respect to such portion substantially in the form attached hereto, and (ii) that we are not submitting herewith for exchange any portion of the temporary global Security representing the above-captioned Securities excepted in such certificates. We further certify that as of the date hereof we have not received any notification from any of our Qualified Account Holders to the effect that the statements made by such Qualified Account Holders with respect to any portion of the part submitted herewith for exchange are no longer true and cannot be relied upon as of the date hereof. Dated: , 19 [To be dated no earlier than the Exchange Date] [MORGAN GUARANTY TRUST COMPANY OF NEW YORK, Brussels Office, as Operator of the Euroclear System] [CEDEL S.A.] By__________________________________
EXHIBIT C FORM OF CERTIFICATE TO BE GIVEN BY EUROCLEAR AND CEDEL S.A. TO OBTAIN INTEREST PRIOR TO AN EXCHANGE DATE CERTIFICATE ................... [Insert title or sufficient description of Securities] This is to certify that, as of the Interest Payment Date on [Insert Date], the undersigned, which is a holder of an interest in the temporary global Security representing the above Securities, is not a United States person. As used herein, "United States person" means any citizen or resident of the United States, any corporation, partnership or other entity created or organized in or under the laws of the United States and any estate or trust the income of which is subject to United States Federal income taxation regardless of its source, and "United States" means the United States of America (including the States and the District of Columbia), its territories, its possessions and other areas subject to its jurisdiction. We confirm that the interest payable on such Interest Payment Date will be paid to each of the persons appearing in our records as being entitled to interest to be paid on the above date from whom we have received a written certification dated not earlier than 15 days prior to such Interest Payment Date to the effect that the beneficial owner of such portion with respect to which interest is to be paid on such date either is not a United States person or is a United States person which is a financial institution which has provided an Internal Revenue Service Form W-9 or is an exempt recipient as defined in United States Treasury Regulations Section 1.6049-4(c)(1)(ii). We undertake to retain certificates received from our member organizations in connection herewith for four years from the end of the calendar year in which such certificates are received.
The foregoing reflects any advice received subsequent to the date of any certificate stating that the statements contained in such certificate are no longer correct. Dated: , 19 [To be dated on or after the relevant Interest Payment Date] [MORGAN GUARANTY TRUST COMPANY OF NEW YORK, Brussels Office, as Operator of the Euroclear System] [CEDEL S.A.] By_________________________________
EXHIBIT D FORM OF CERTIFICATE TO BE GIVEN BY BENEFICIAL OWNERS TO OBTAIN INTEREST PRIOR TO AN EXCHANGE DATE CERTIFICATE ................... [Insert title or sufficient description of Securities] This is to certify that as of the date hereof, no portion of the temporary global Security representing the above-captioned Securities and held by you for our account is beneficially owned by a United States person or, if any portion thereof held by you for our account is beneficially owned by a United States person, such United States person is a financial institution within the meaning of Section 1.165-12(c)(1)(v) of the United States Treasury regulations which agrees to comply with Section 165(j)(3)(A), (B) or (C) of the Internal Revenue Code of 1986, as amended and the regulations thereunder, and certifies that either it has provided an Internal Revenue Service Form W-9 or is an exempt recipient as defined in Section 1.6049-4(c)(1)(ii) of the United States Treasury regulations. As used herein, "United States person" means any citizen or resident of the United States, any corporation, partnership or other entity created or organized in or under the laws of the United States and any estate or trust the income of which is subject to United States Federal income taxation regardless of its source, and "United States" means the United States of America (including the States and the District of Columbia), its territories, its possessions and other areas subject to its jurisdiction. We undertake to advise you by telex if the above statement as to beneficial ownership is not correct on the Interest Payment Date on [Insert Date] as to any such portion of such temporary global Security. We understand that this certificate is required in connection with certain tax legislation in the United States. If administrative or legal proceedings are commenced or threatened in connection with which this certificate is or would be relevant, we irrevocably authorize you to produce this
certificate or a copy thereof to any interested party in such proceedings. Dated: , 19 [To be dated on or after the 15th day before the relevant Interest Payment Date] [Name of Account Holder] ________________________________ (Authorized Signatory) Name: Title:
Exhibit 4.9(b) FIRST SUPPLEMENTAL INDENTURE, dated as of October 2, 1998, between BANK ONE CORPORATION, a corporation duly organized and existing under the laws of the State of Delaware ("ONE"), having its principal offices at One First National Plaza, Chicago, Illinois 60670 and THE CHASE MANHATTAN BANK, a banking corporation duly organized and existing under the laws of the State of New York, as trustee (the "Trustee"). WHEREAS, BANC ONE CORPORATION ("BANC ONE") has heretofore executed and delivered to the Trustee an Indenture, dated as of March 3, 1997 (the "Indenture"), providing for the issuance from time to time of Senior Debt Securities (herein and therein called the "Securities"); and WHEREAS, effective as of October 2, 1998, BANC ONE merged with and into ONE, a wholly owned subsidiary of BANC ONE; and WHEREAS, Section 10.1 of the Indenture provides for the execution of an indenture supplemental to the Indenture, in form satisfactory to the Trustee, to evidence the succession of any successor corporation to BANC ONE under the Indenture and the assumption of such successor corporation of the covenants of BANC ONE in the Indenture and in the Securities pursuant to such Indenture; and WHEREAS, all things necessary to make this First Supplemental Indenture a valid agreement of ONE, as the successor corporation to BANC ONE, under the Indenture, in accordance with its terms, have been done. NOW, THEREFORE, ONE and the Trustee hereby agree as follows: 1. From and after the date of this First Supplemental Indenture, ONE shall for all purposes be deemed to be the "Company", as such term is defined in the Indenture and the Securities, as if ONE was originally so named in the Indenture and the Securities, and, as such, ONE hereby expressly assumes, from and after the date of this First Supplemental Indenture, the due and punctual payment of the principal
of, premium, if any, and interest on all of the Securities and the performance of every covenant of the Indenture, as supplemented by this First Supplemental Indenture, on the part of the ONE to be performed or observed. 2. All provisions of this First Supplemental Indenture shall be deemed to be incorporated in, and made a part of, the Indenture; and the Indenture, as supplemented by this First Supplemental Indenture, shall be read, taken and construed as one and the same instrument. 3. The Trustee accepts the trusts created by the Indenture, as supplemented by this First Supplemental Indenture, and agrees to perform the same upon the terms and conditions in the Indenture, as supplemented by this First Supplemental Indenture. 4. The recitals contained in this First Supplemental Indenture shall be taken as statements of ONE, and the Trustee assumes no responsibility for their correctness. The Trustee makes no representations as to the validity or sufficiency of this First Supplemental Indenture. 5. All capitalized terms used and not defined herein shall have the respective meanings assigned to them in the Indenture. 6. This First Supplemental Indenture shall be governed by and construed in accordance with the laws of the State of New York. 7. This First Supplemental Indenture may be executed in any number of counterparts, each of which when so executed shall be deemed to be an original, but all such counterparts shall together constitute but one and the same instrument. -2-
IN WITNESS WHEREOF, the parties hereto have caused the First Supplemental Indenture to be duly executed, and their respective seals to be hereunto affixed and attested, all as of the date first above written. BANK ONE CORPORATION ATTEST: ____________________________ ____________________________ By: Title: _____________________ Title: Chief Financial Officer [Corporate Seal] THE CHASE MANHATTAN BANK, as Trustee ATTEST: ______________________________ ______________________________ By: Title: _______________________ Title: [Corporate Seal] -3-
STATE OF ILLINOIS ) ) ss: COUNTY OF COOK ) On the 2nd day of October, 1998, before me personally came Robert A. Rosholt, to me known, who, being duly sworn, did depose and say that he is the Chief Financial Officer of BANK ONE CORPORATION, one of the corporations described in and which executed the foregoing instrument; that he knows the seal of said corporation; that the seal affixed to said instrument is such corporate seal; that it was so affixed by authority of the Board of Directors of said corporation; and that he signed his name thereto by like authority. ______________________________ Notary Public My Commission Expires:__________ -4-
STATE OF ) ) ss: COUNTY OF ) On the ____ day of ___________ before me personally came ________________, to me known, who, being duly sworn, did depose and say that he is a ___________________________of THE CHASE MANHATTAN BANK, one of the corporations described in and which executed the foregoing instrument; that he knows the seal of said corporation; that the seal affixed to said instrument is such corporate seal; that it was so affixed by authority of the Board of Directors of said corporation; and that he signed his name thereto by like authority. ______________________________ Notary Public My Commission Expires:__________ -5-
Exhibit 4.10(a) BANC ONE CORPORATION AND THE CHASE MANHATTAN BANK TRUSTEE INDENTURE DATED AS OF MARCH 3, 1997 SUBORDINATED DEBT SECURITIES Page 1
TABLE OF CONTENTS(1) Page ---- ARTICLE ONE Definitions and Other Provisions of General Application SECTION 1.01. Definitions........................................... 2 "this Indenture" and certain other terms.............. 2 "Act"................................................. 3 "Affiliate"........................................... 3 "Authenticating Agent"................................ 3 "Authorized Newspaper"................................ 3 "Authorized Officer".................................. 3 "Bearer Security"..................................... 3 "Board of Directors".................................. 3 "Board Resolution".................................... 3 "Business Day"........................................ 4 "CEDEL; CEDEL S.A."................................... 4 "Commission".......................................... 4 "Common Depositary"................................... 4 "Company"............................................. 4 "Company Request" and "Company Order"................. 4 "corporation"......................................... 4 "coupon".............................................. 4 "Default"............................................. 4 "Defaulted Interest".................................. 4 "Depositary".......................................... 5 "Designated Currency"................................. 5 "Dollar".............................................. 5 "ECU"................................................. 5 "Euroclear"........................................... 5 "European Communities"................................ 5 "Event of Default".................................... 5 "Exchange Act"........................................ 5 "Exchange Rate"....................................... 5 "Exchange Rate Officer's Certificate"................. 5 "Existing Subordinated Indebtedness".................. 6 "Foreign Currency".................................... 6 "General Obligations"................................. 6 "Global Exchange Rate"................................ 7 (1) This Table of Contents is not part of the Indenture. Page 2
CONTENTS, p. 2 Page ---- "Global Security" ............................ 7 "Holder" ..................................... 7 "interest" ................................... 7 "Interest Payment Date" ...................... 7 "Maturity" ................................... 7 "Officers' Certificate" ...................... 7 "Opinion of Counsel" ......................... 7 "Original Issue Discount Security" ........... 8 "Outstanding" ................................ 8 "Paying Agent" ............................... 9 "Person" ..................................... 9 "Place of Payment" ........................... 9 "Predecessor Security" ....................... 9 "Principal Corporate Trust Office" ........... 9 "Principal Paying Agent" ..................... 9 "Redemption Date" ............................ 10 "Redemption Price" ........................... 10 "Registered Security" ........................ 10 "Regular Record Date" ........................ 10 "Remarketing Entity" ......................... 10 "Repayment Date" ............................. 10 "Repayment Price" ............................ 10 "Responsible Officer" ........................ 10 "Security"; "Securities" ..................... 10 "Security Register" .......................... 11 "Security Registrar" ......................... 11 "Senior Indebtedness" ........................ 11 "Special Record Date" ........................ 11 "Stated Maturity" ............................ 11 "Subsidiary of the Company" or "Subsidiary"... 11 "Trustee" .................................... 12 "Trust Indenture Act" or "TIA" ............... 12 "United States" .............................. 12 "United States Alien" ........................ 12 "vice president" ............................. 12 SECTION 1.02. Compliance Certificates and Opinions ......... 12 SECTION 1.03. Form of Documents Delivered to Trustee ....... 13 SECTION 1.04. Acts of Holders .............................. 14 SECTION 1.05. Notices, etc., to Trustee and Company ........ 17 SECTION 1.06. Notices to Holders; Waiver ................... 18 SECTION 1.07. Language of Notices, Etc ..................... 19 SECTION 1.08. Conflict with Trust Indenture Act ............ 19 Page 3
CONTENTS, p. 3 Page ---- SECTION 1.09. Effect of Headings and Table of Contents ............ 20 SECTION 1.10. Successors and Assigns .............................. 20 SECTION 1.11. Separability Clause ................................. 20 SECTION 1.12. Benefits of Indenture ............................... 20 SECTION 1.13. Legal Holidays ...................................... 20 SECTION 1.14. Governing Law ....................................... 21 ARTICLE TWO Security Forms SECTION 2.01. Form Generally ...................................... 21 SECTION 2.02. Form of Securities .................................. 21 SECTION 2.03. Form of Trustee's Certificate of Authentication ..... 22 SECTION 2.04. Global Securities ................................... 22 ARTICLE THREE The Securities SECTION 3.01. Title and Terms ..................................... 23 SECTION 3.02. Denominations ....................................... 27 SECTION 3.03. Execution, Authentication, Delivery and Dating ...... 27 SECTION 3.04. Temporary Securities ................................ 31 SECTION 3.05. Registration, Registration of Transfer and Exchange . 35 SECTION 3.06. Mutilated, Destroyed, Lost and Stolen Securities .... 40 SECTION 3.07. Payment of Interest; Interest Rights Preserved ...... 41 SECTION 3.08. Persons Deemed Owners ............................... 44 SECTION 3.09. Cancellation ........................................ 44 SECTION 3.10. Computation of Interest ............................. 45 SECTION 3.11. Forms of Certification .............................. 45 SECTION 3.12. Judgments ........................................... 46 SECTION 3.13. CUSIP Numbers ....................................... 46 Page 4
CONTENTS, p. 4 Page ---- ARTICLE FOUR Redemption of Securities SECTION 4.01. Applicability of Article .................................. 47 SECTION 4.02. Election to Redeem; Notice to Trustee ..................... 47 SECTION 4.03. Selection by Security Registrar of Securities to be Redeemed .............................. 47 SECTION 4.04. Notice of Redemption ...................................... 48 SECTION 4.05. Deposit of Redemption Price ............................... 49 SECTION 4.06. Securities Payable on Redemption Date ..................... 49 SECTION 4.07. Securities Redeemed in Part ............................... 50 SECTION 4.08. Redemption Suspended During Event of Default .............. 51 ARTICLE FIVE Covenants SECTION 5.01. Payment of Principal, Premium and Interest ................ 51 SECTION 5.02. Maintenance of Office or Agency ........................... 52 SECTION 5.03. Money for Security Payments to Be Held in Trust ........... 54 SECTION 5.04. Additional Amounts ........................................ 56 SECTION 5.05. Statement as to Compliance ................................ 57 SECTION 5.06. Maintenance of Corporate Existence, Rights and Franchises.. 57 ARTICLE SIX Holder's Lists and Reports by Trustee and Company SECTION 6.01. Company to Furnish Trustee Names and Addresses of Holders.. 58 SECTION 6.02. Preservation of Information; Communications to Holders .... 58 SECTION 6.03. Reports by Trustee ........................................ 60 SECTION 6.04. Reports by Company ........................................ 61 Page 5
CONTENTS, p. 5 Page ---- ARTICLE SEVEN Remedies SECTION 7.01. Events of Default .................................. 62 SECTION 7.02. Acceleration of Maturity; Rescission and Annulment.. 63 SECTION 7.03. Collection of Indebtedness and Suits for Enforcement by Trustee .................... 64 SECTION 7.04. Trustee May File Proofs of Claim ................... 65 SECTION 7.05. Trustee May Enforce Claims Without Possession of Securities ...................... 66 SECTION 7.06. Application of Money Collected ..................... 66 SECTION 7.07. Limitation on Suits ................................ 67 SECTION 7.08. Unconditional Right of Holders to Receive Principal, Premium and Interest .......................... 69 SECTION 7.09. Restoration of Rights and Remedies ................. 69 SECTION 7.10. Rights and Remedies Cumulative ..................... 69 SECTION 7.11. Delay or Omission Not Waiver ....................... 70 SECTION 7.12. Control by Noteholders ............................. 70 SECTION 7.13. Waiver of Past Defaults ............................ 70 SECTION 7.14. Undertaking for Costs .............................. 71 SECTION 7.15. Waiver of Stay or Extension Laws ................... 71 ARTICLE EIGHT The Trustee SECTION 8.01. Certain Duties and Responsibilities ................ 72 SECTION 8.02. Notice of Default .................................. 73 SECTION 8.03. Certain Rights of Trustee .......................... 74 SECTION 8.04. Not Responsible for Recitals or Issuance of Notes .. 76 SECTION 8.05. May Hold Securities ................................ 76 SECTION 8.06. Money Held in Trust ................................ 76 SECTION 8.07. Compensation and Reimbursement ..................... 76 SECTION 8.08. Disqualification; Conflicting Interests ............ 77 SECTION 8.09. Corporate Trustee Required; Eligibility ............ 77 SECTION 8.10. Resignation and Removal; Appointment of Successor .. 78 SECTION 8.11. Acceptance of Appointment by Successor ............. 80 Page 6
CONTENTS, p. 6 Page ---- SECTION 8.12. Merger, Conversion, Consolidation or Succession to Business of Trustee .......................... 82 SECTION 8.13. Preferential Collection of Claims against Company..... 82 SECTION 8.14. Appointment of Authenticating Agents ................. 82 ARTICLE NINE Supplemental Indentures SECTION 9.01. Supplemental Indentures Without Consent of Holders ... 85 SECTION 9.02. Supplemental Indentures With Consent of Holders ...... 87 SECTION 9.03. Execution of Supplemental Indentures ................. 88 SECTION 9.04. Effect of Supplemental Indentures .................... 88 SECTION 9.05. Conformity with Trust Indenture Act .................. 88 SECTION 9.06. Reference in Securities to Supplemental Indentures ... 89 SECTION 9.07. Subordination Unimpaired ............................. 89 ARTICLE TEN Consolidation, Merger, Conveyance or Transfer SECTION 10.01. Company May Consolidate, etc., Only on Certain Terms.. 89 SECTION 10.02. Successor Corporation Substituted .................... 90 ARTICLE ELEVEN Satisfaction and Discharge SECTION 11.01. Satisfaction and Discharge of Indenture .............. 90 SECTION 11.02. Application of Trust Money ........................... 92 SECTION 11.03. Reinstatement ........................................ 92 Page 7
CONTENTS, p. 7 Page ---- ARTICLE TWELVE Immunity of Incorporations, Stockholders, Officers and Directors SECTION 12.01. Exemption from Individual Liability ...................... 93 ARTICLE THIRTEEN Sinking Funds SECTION 13.01. Applicability of Article ................................. 93 SECTION 13.02. Satisfaction of Sinking Fund Payments with Securities .... 94 SECTION 13.03. Redemption of Securities for Sinking Fund ................ 94 ARTICLE FOURTEEN Subordination of Securities SECTION 14.01. Agreement to Subordinate ................................. 95 SECTION 14.02. Distribution on Dissolution, Liquidation and Reorganization; Subrogation of Securities .......................................... 95 SECTION 14.03. Payments on Securities Prohibited During Event of Default under Senior Indebtedness ... 99 SECTION 14.04. Payments on Securities Permitted ......................... 100 SECTION 14.05. Authorization of Holders to Trustee to Effect Subordination ................................ 100 SECTION 14.06. Notice To Trustee ........................................ 101 SECTION 14.07. Right of Trustee to Hold Senior Indebtedness or General Obligations ................. 101 SECTION 14.08. Article Fourteen Not to Prevent Defaults or Events of Default ....................... 101 SECTION 14.09. Securities to Rank Pari Passu with Existing Subordinated Indebtedness; Payment of Proceeds in Certain Cases .. 101 Page 8
CONTENTS, p. 8 Page ---- ARTICLE FIFTEEN Repayment at the Option of Holders SECTION 15.01. Applicability of Article ......................... 104 SECTION 15.02. Repayment of Securities .......................... 104 SECTION 15.03. Exercise of Option; Notice ....................... 104 SECTION 15.04. Election of Repayment by Remarketing Entities .... 106 SECTION 15.05. Securities Payable on the Repayment Date ......... 106 ARTICLE SIXTEEN Meetings of Holders of Securities SECTION 16.01. Purposes for Which Meetings May Be Called ........ 107 SECTION 16.02. Call, Notice and Place of Meetings ............... 107 SECTION 16.03. Persons Entitled to Vote at Meetings ............. 108 SECTION 16.04. Quorum; Action ................................... 108 SECTION 16.05. Determination of Voting Rights; Conduct and Adjournment of Meetings ......... 109 SECTION 16.06. Counting Votes and Recording Action of Meetings .. 110 ARTICLE SEVENTEEN Miscellaneous SECTION 17.01. Counterparts ..................................... 111 TESTIMONIUM ...................................................... 112 SIGNATURES AND SEALS ............................................. 112 ACKNOWLEDGMENTS .................................................. 113 EXHIBIT A. Form of Certificate to be Given by Person Entitled to Receive Bearer Security EXHIBIT B. Form of Certificate to be Given by Euro-clear and CEDEL S.A. in Connection with the Exchange of a Portion of a Temporary Global Security Page 9
Contents, p. 9 Page ---- EXHIBIT C. Form of Certificate to be Given by Euro-clear and CEDEL S.A. to Obtain Interest Prior to an Exchange Date EXHIBIT D. Form of Certificate to be Given by Beneficial Owners to Obtain Interest Prior to an Exchange Date Page 10
CONTENTS, p. 10 TABLE SHOWING REFLECTION IN INDENTURE OF CERTAIN PROVISIONS OF TRUST INDENTURE ACT OF 1939 Reflected in Indenture Section ------- TIA Section 310(a)(1)......................................................... 8.09 (a)(2)......................................................... 8.09 (a)(3)......................................................... Not Applicable (a)(4)......................................................... Not Applicable (a)(5)......................................................... 8.09 (b)............................................................ 8.08 8.10 (c)............................................................ Not Applicable Section 311(a)............................................................ 8.13 (b)............................................................ 8.13 Section 312(a)............................................................ 6.01 6.02(i) (b)............................................................ 6.02(ii) (c)............................................................ 6.02(iii) Section 313(a)............................................................ 6.03(i) (b)............................................................ 6.03(ii) (c)............................................................ 6.03(i), (ii) and (iii) (d)............................................................ 6.03(iii) Section 314(a)............................................................ 6.04 5.05 (b)............................................................ Not Applicable (c)(1)......................................................... 1.02 (c)(2)......................................................... 1.02 (c)(3)......................................................... Not Applicable (d)............................................................ Not Applicable (e)............................................................ 1.02 (f)............................................................ Not Applicable Section 315(a)............................................................ 8.01(i) 8.01(iii) (b)............................................................ 8.02 (c)............................................................ 8.01(ii) (d)............................................................ 8.01 (d)(1)......................................................... 8.01(i) (d)(2)......................................................... 8.01(iii)(b) (d)(3)......................................................... 8.01(iii)(c) (e)............................................................ 7.14 Section 316(a)............................................................ 1.01 Page 11
CONTENTS, p. 11 Reflected in Indenture Section ------- Section 316(a)(1)(A)................................................... 7.02 7.12 (a)(1)(B)................................................... 7.13 (a)(2)...................................................... Not Applicable (b)......................................................... 7.08 (c)......................................................... 1.04(viii) Section 317(a)(1)...................................................... 7.03 (a)(2)...................................................... 7.04 (b)......................................................... 5.03 Section 318(a)......................................................... 1.08 (c)......................................................... 1.08 Page 12
THIS INDENTURE is entered into as of March 3, 1997, between BANC ONE CORPORATION, a corporation organized and existing under the laws of the State of Ohio (hereinafter called the "Company"), having its principal executive office at 100 East Broad Street, Columbus, Ohio 43271, and THE CHASE MANHATTAN BANK, a New York banking corporation (hereinafter called the "Trustee"), having its principal corporate trust office at 450 W. 33rd Street, 15th Floor, New York, New York 10001. RECITALS OF THE COMPANY The Company deems it necessary from time to time to issue its unsecured subordinated debentures, notes, bonds and other evidences of indebtedness to be issued in one or more series (hereinafter called the "Securities") as hereinafter set forth, and to provide therefor the Company has duly authorized the execution and delivery of this Indenture. All things necessary to make this Indenture a valid agreement of the Company, in accordance with its terms, have been done. NOW, THEREFORE, THIS INDENTURE WITNESSETH: For and in consideration of the premises and the purchase of the Securities by the Holders thereof, it is mutually covenanted and agreed, for the equal and proportionate benefit of all Holders of the Securities or of any series thereof, as follows: ARTICLE ONE DEFINITIONS AND OTHER PROVISIONS OF GENERAL APPLICATION SECTION 1.01. Definitions. For all purposes of this Indenture, except as otherwise expressly provided or unless the context otherwise requires: (i) the term "this Indenture" means this instrument as originally executed or as it may from time to time be supplemented or amended by one or more indentures supplemental hereto entered into pursuant to the applicable provisions hereof and shall include the terms of particular series of Securities established as contemplated by Section 3.01; (ii) all references in this instrument to designated "Articles", "Sections" and other subdivisions are to the designated Articles, Sections and other subdivisions of this Indenture. The words "herein", "hereof" and "hereunder" and other words of similar import refer to this Indenture as a whole and not to any particular Article, Section or other subdivision; (iii) the terms defined in this Article have the meanings assigned to them in this Article and include the plural as well as the singular; (iv) all other terms used herein which are defined in the Trust Indenture Act, either directly or by reference therein, have the meanings assigned to them therein; and (V) all accounting terms not otherwise defined herein have the meanings assigned to them in accordance with generally accepted accounting principles, and, except as may be otherwise expressly provided herein or in one or more indentures supplemental hereto, the term "generally accepted accounting principles" with respect to any computation required or permitted hereunder shall mean such accounting principles as are generally accepted at the date of such computation. "Act", when used with respect to any Holder, has the meaning specified in Section 1.04. "Affiliate" of any specified Person means any other Person directly or indirectly controlling or controlled by or under direct or indirect common control with such specified Person. For the purposes of this definition, "control" when used with respect to any specified Person means the power to direct the management and policies of such Person, directly or indirectly, whether through the ownership of voting securities, by contract or otherwise; and the terms "controlling" and "controlled" have meanings correlative to the foregoing. "Authenticating Agent" means any Person authorized to act on behalf of the Trustee to authenticate Securities pursuant to Section 8.14. "Authorized Newspaper" means a newspaper, in an official language of the country of publication or in the English language, customarily published on each Business Day, whether or not published on Saturdays, Sundays or holidays, and of general circulation in the place in connection with which the term is used or in the financial community of such place. Where successive publications are required to be made in Authorized Newspapers, the successive publications may be made in the same or in different newspapers in the same city meeting the foregoing requirements and in each case on any Business Day. "Authorized Officer" means the Chairman of the Board, the President, any Vice Chairman of the Board, any Vice President, the Treasurer, the Secretary, the Comptroller, any Assistant Comptroller, any Assistant Treasurer or any Assistant Secretary of the Company. Page 13
"Bearer Security" means any Security in the form established pursuant to Section 2.02 which is payable to bearer, including, without limitation, unless the context otherwise indicates, a Security in global bearer form. "Board of Directors" means either the board of directors of the Company or any duly authorized committee of that board. "Board Resolution" means a copy of a resolution certified by the Secretary or an Assistant Secretary of the Company to have been duly adopted by the Board of Directors and to be in full force and effect on the date of such certification, and delivered to the Trustee. "Business Day" means any day, other than a Saturday or Sunday, on which banking institutions in the City of Columbus, Ohio and any Place of Payment for the Securities are open for business. "CEDEL" or "CEDEL S.A." means Cedel Bank, societe anonymne or its successors. "Commission" means the Securities and Exchange Commission, as from time to time constituted, created under the Exchange Act, or if any time after the execution and delivery of this instrument such Commission is not existing and performing the duties now assigned to it under the Trust Indenture Act, then the body performing such duties at such time. "Common Depositary" has the meaning specified in Section 3.04(b)(ii). "Company" means the Person named as the "Company" in the first paragraph of this instrument until any successor corporation shall have become such pursuant to the applicable provisions of this Indenture, and thereafter "Company" shall mean any such successor corporation. "Company Request" and "Company Order" mean, respectively, a written request or order signed in the name of the Company by its Chairman of the Board, its President, a Vice Chairman of the Board, or a Vice President, and by its Treasurer, an Assistant Treasurer, its Comptroller, an Assistant Comptroller, its Secretary or an Assistant Secretary, and delivered to the Trustee. "corporation" includes corporations, associations, companies and business trusts. "coupon" means any interest coupon appertaining to a Bearer Security. "Default" has the meaning specified in Section 7.07. "Defaulted Interest" has the meaning specified in Section 3.07. "Depositary" means, with respect to the Securities of any series issuable or issued in the form of a Global Security, the Person designated as Depositary by the Company pursuant to Section 3.01 until a successor Depositary shall have been appointed pursuant to Section 3.05, and thereafter "Depositary" shall mean or include each Person who is then a Depositary hereunder, and if at any time there is more than one such Person, "Depositary" as used with respect to the Securities of any such series shall mean the Depositary with respect to the Securities of that series. "Designated Currency" has the meaning specified in Section 3.12. "Dollar" or "$" means the coin or currency of the United States of America as at the time of payment is legal tender for the payment of public and private debts. "ECU" means the European Currency Unit as defined and revised from time to time by the Council of the European Communities. "Euroclear" means Morgan Guaranty Trust Company of New York, Brussels Office, as operator of the Euroclear System. "European Communities" means the European Economic Community, the European Coal and Steel Community and the European Atomic Energy Community. "Event of Default" has the meaning specified in Section 7.01. "Exchange Act" means the Securities Exchange Act of 1934, as amended from time to time, and any statute successor thereto. "Exchange Rate" shall have the meaning specified as contemplated in Section 3.01. "Exchange Rate Agent" shall have the meaning specified as contemplated in Section 3.01. Page 14
"Exchange Rate Officer's Certificate" with respect to any date for the payment of principal of (and premium, if any) and interest on any series of Securities, means a certificate setting forth the applicable Exchange Rate and the amounts payable in Dollars and Foreign Currencies in respect of the principal of (and premium, if any) and interest on Securities denominated in ECU, any other composite currency or Foreign Currency, and signed by the Chairman of the Board, a Vice Chairman of the Board, the President, any Vice President, the Treasurer or any Assistant Treasurer of the Company or the Exchange Rate Agent appointed pursuant to Section 3.01 and delivered to the Trustee. "Existing Subordinated Indebtedness" means, unless otherwise determined with respect to any series of Securities pursuant to Section 3.01, the Company's 7.25% Subordinated Notes Due August 1, 2002, the Company's 8.74% Subordinated Notes Due September 15, 2003, the Company's 7.00% Subordinated Notes Due July 15, 2005, the Company's 9.875% Subordinated Notes Due March 1, 2009, the Company's 10.00% Subordinated Notes Due August 15, 2010, the Company's 7.75% Subordinated Debentures Due July 15, 2025 and the Company's 7.625% Subordinated Debentures Due October 15, 2026. "Foreign Currency" means a currency issued by the government of any country other than the United States of America. "General Obligations" means, unless otherwise determined with respect to any series of Securities pursuant to Section 3.01, all obligations of the Company to make payment on account of claims in respect of derivative products such as interest and foreign exchange rate contracts, commodity contracts and similar arrangements, other than (i) obligations on account of Senior Indebtedness, (ii) obligations on account of indebtedness for money borrowed ranking pari passu with or subordinate to the Securities and (iii) obligations which by their terms are expressly stated not to be superior in right of payment to the Securities or to rank on a parity with the Securities; provided, however, that notwithstanding the foregoing, in the event that any rule, guideline or interpretation promulgated or issued by the Board of Governors of the Federal Reserve System (or other competent regulatory agency or authority), as from time to time in effect, establishes or specifies criteria for the inclusion in regulatory capital of subordinated debt of a bank holding company requiring that such subordinated debt be subordinated to obligations to creditors in addition to those set forth above, then the term "General Obligations" shall also include such additional obligations to creditors, as from time to time in effect pursuant to such rules, guidelines or interpretations. For purposes of this definition, "claim" shall have the meaning assigned thereto in Section 101(4) of the Bankruptcy Code of 1978, as amended to the date of this instrument. "Global Exchange Date" has the meaning specified in Section 3.04(b)(iv). "Global Security" means a Security issued to evidence all or a part of a series of Securities in accordance with Section 3.03. "Holder", with respect to a Registered Security, means a Person in whose name such Registered Security is registered in the Security Register and, with respect to a Bearer Security (or any temporary Global Security) or a coupon, means the bearer thereof. "interest", when used with respect to an Original Issue Discount Security which by its terms bears interest only after Maturity, means interest payable after Maturity. "Interest Payment Date", when used with respect to any series of Securities, means the Stated Maturity of an installment of interest on such Securities. "Maturity", when used with respect to any Security, means the date on which the principal of such Security (or any installment of principal) becomes due and payable as therein or herein provided, whether at the Stated Maturity or by declaration of acceleration, call for redemption or otherwise. "Officers' Certificate" means a certificate signed by the Chairman of the Board, the President, a Vice Chairman of the Board, or a Vice President, and by the Treasurer, an Assistant Treasurer, the Comptroller, an Assistant Comptroller, the Secretary or an Assistant Secretary of the Company, and delivered to the Trustee. Each such certificate shall contain the statements set forth in Section 1.02, if applicable. "Opinion of Counsel" means a written opinion of counsel, who may (except as otherwise expressly provided in this Indenture) be an employee of the Company, and who shall be reasonably acceptable to the Trustee. Each such opinion shall contain the statements set forth in Section 1.02, if applicable. "Original Issue Discount Security" means any Security which provides for an amount less than the principal amount thereof to be due and payable upon a declaration of acceleration of the Maturity thereof pursuant to Section 7.02. "Outstanding" when used with respect to Securities or Securities of any series, means, as of the date of determination, all such Securities theretofore authenticated and delivered under this Indenture, except: (i) such Securities theretofore canceled by the Trustee or delivered to the Trustee for cancellation; Page 15
(ii) such Securities for whose payment or redemption money in the necessary amount has been theretofore deposited with the Trustee or any Paying Agent (other than the Company) in trust or set aside and segregated in trust by the Company (if the Company shall act as its own Paying Agent) for the Holders of such Securities; provided that, if such Securities are to be redeemed, notice of such redemption has been duly given pursuant to this Indenture or provision therefor satisfactory to the Trustee has been made; and (iii) such Securities in lieu of which other Securities have been authenticated and delivered pursuant to Section 3.06 of this Indenture; provided, however, that in determining whether the Holders of the requisite principal amount of such Securities Outstanding have given any request, demand, authorization, direction, notice, consent or waiver hereunder or whether a quorum is present at a meeting of Holders of Securities, the principal amount of Original Issue Discount Securities that shall be deemed to be Outstanding for such purposes shall be the amount of the principal thereof that would be due and payable as of the date of such determination upon a declaration of acceleration of the Maturity thereof pursuant to Section 7.02, and Securities owned by the Company or any other obligor upon the Securities or any Affiliate of the Company or such other obligor shall be disregarded and deemed not to be Outstanding, except that, in determining whether the Trustee shall be protected in relying upon any such request, demand, authorization, direction, notice, consent or waiver, only Securities which a Responsible Officer of the Trustee actually knows to be so owned shall be disregarded. Securities so owned which have been pledged in good faith may be regarded as Outstanding if the pledgee establishes to the satisfaction of the Trustee the pledgee's right so to act with respect to such Securities and that the pledgee is not the Company or any other obligor upon the Securities or any Affiliate of the Company or such other obligor. "Paying Agent" means any Person authorized by the Company to pay the principal of, premium, if any, or interest on any Securities or any coupons appertaining thereto on behalf of the Company. "Person" means any individual, corporation, partnership, joint venture, association, joint-stock company, trust, unincorporated organization or government or any agency or political subdivision thereof. "Place of Payment", when used with respect to the Securities of any series, means the place or places where, subject to the provisions of Section 5.02, the principal of (and premium, if any) and interest on the Securities of that series are payable as specified in accordance with Section 3.01. "Predecessor Security" of any particular Security means every previous Security evidencing all or a portion of the same debt as that evidenced by such particular Security; and for the purposes of this definition, any Security authenticated and delivered under Section 3.06 in lieu of a mutilated, destroyed, lost or stolen Security shall be deemed to evidence the same debt as the mutilated, destroyed, lost or stolen Security. "Principal Corporate Trust Office" means the office of the Trustee, at which at any particular time its corporate trust business shall be principally administered, which office at the date of execution of this instrument is at the address set forth in the first paragraph of this instrument "Principal Paying Agent" means the Paying Agent, if any, designated as such by the Company pursuant to Section 3.01 of this Indenture. "Redemption Date", when used with respect to any Security to be redeemed, means the date fixed for such redemption by or pursuant to this Indenture. "Redemption Price", when used with respect to any Security to be redeemed, means the price specified in such Security at which it is to be redeemed pursuant to this Indenture. "Registered Security" means any Security in the form established pursuant to Section 2.02 which is registered in the Security Register. "Regular Record Date" for the interest payable on any Security on any Interest Payment Date means the date, if any, specified in such Security as the "Regular Record Date". "Remarketing Entity", when used with respect to the Securities of any series which are repayable at the option of the Holders thereof before their Stated Maturity, means any Person designated by the Company to purchase any such Securities. "Repayment Date", when used with respect to any Security to be repaid upon exercise of option for repayment by the Holder, means the date fixed for such repayment pursuant to this Indenture. "Repayment Price", when used with respect to any Security to be repaid upon exercise of option for repayment by the Holder, means the price at which it is to be repaid pursuant to this Indenture. Page 16
"Responsible Officer", when used with respect to the Trustee, means any officer of the Trustee with direct responsibility for the administration of this Indenture and also means, with respect to a particular corporate trust matter, any other officer of the Trustee to whom such matter is referred because of his knowledge of and familiarity with the particular subject. "Security" or "Securities" means any Security or Securities, as the case may be, authenticated and delivered under this Indenture; provided, however, that, if at any time there is more than one Person acting as Trustee under this Indenture, "Securities", with respect to any such Person, shall mean Securities authenticated and delivered under this Indenture, exclusive, however, of Securities of any series as to which such Person is not Trustee. "Security Register" has the meaning specified in Section 3.05. "Security Registrar" has the meaning specified in Section 3.05. "Senior Indebtedness" means the principal of, premium, if any, and interest on (i) all of the Company's indebtedness for money borrowed, other than the Securities and the Existing Subordinated Indebtedness, whether outstanding on the date of execution of this Indenture or thereafter created, assumed or incurred, except such indebtedness as is by its terms expressly stated to be not superior in right of payment to the Securities or the Existing Subordinated Indebtedness or to rank pari passu with the Securities or the Existing Subordinated Indebtedness and (ii) any deferrals, renewals or extensions of any such Senior Indebtedness. The term "indebtedness for money borrowed" as used in the foregoing sentence shall include, without limitation, any obligation of, or any obligation guaranteed by, the Company for the repayment of borrowed money, whether or not evidenced by bonds, debentures, notes or other written instruments, and any deferred obligation for the payment of the purchase price of property or assets. "Special Record Date" for the payment of any Defaulted Interest means the date fixed by the Trustee pursuant to Section 3.07. "Stated Maturity", when used with respect to any Security, or any installment of principal thereof or interest thereon, means the date specified in such Security as the fixed date on which the principal of such Security, or such installment of principal or interest, is due and payable. "Subsidiary of the Company" or "Subsidiary" means a corporation at least a majority of the outstanding voting stock of which is owned, directly or indirectly, by the Company or by one or more Subsidiaries of the Company, or by the Company and one or more Subsidiaries of the Company. As used under this heading, the term "voting stock" means stock having ordinary voting power for the election of directors irrespective of whether or not stock of any other class or classes shall have or might have voting power by reason of the happening of any contingency. "Trustee" means the Person named as the "Trustee" in the first paragraph of this instrument until a successor Trustee shall have become such pursuant to the applicable provisions of this Indenture, and thereafter "Trustee" shall mean or include each Person who is then a Trustee hereunder, and if at any time there is more than one such Person, "Trustee" as used with respect to the Securities of any series shall mean the Trustee with respect to Securities of that series. "Trust Indenture Act" or "TIA" (except as herein otherwise expressly provided) means the Trust Indenture Act of 1939, as in force at the date as of which this instrument was executed, and, to the extent required by law, as amended. "United States" means the United States of America (including the States and the District of Columbia), its territories, its possessions and other areas subject to its jurisdiction. "United States Alien", except as otherwise provided in or pursuant to this Indenture, means any Person who, for United States Federal income tax purposes, is a foreign corporation, a nonresident alien individual, a non-resident alien fiduciary of a foreign estate or trust, or a foreign partnership one or more of the members of which is, for United States Federal income tax purposes, a foreign corporation, a non-resident alien individual or a non-resident alien fiduciary of a foreign estate or trust. "vice president", when used with respect to the Company or the Trustee, means any vice president, whether or not designated by a number or a word or words added before or after the title "vice president". SECTION 1.02. Compliance Certificates and Opinions. Upon any application or request by the Company to the Trustee to take any action under any provision of this Indenture, the Company shall furnish to the Trustee an Officers' Certificate stating that all conditions precedent, if any, provided for in this Indenture relating to the proposed action have been complied with and an Opinion of Counsel stating that in the opinion of such counsel all such conditions precedent, if any, have been complied with, except that in the case of any such application or request as to which the furnishing of such documents is specifically required by any provision of this Indenture relating to such particular application or request, no additional certificate or opinion need be furnished. Page 17
Every certificate or opinion with respect to compliance with a condition or covenant provided for in this Indenture (except as otherwise expressly provided in this Indenture) shall include: (i) a statement that each individual signing such certificate or opinion has read such covenant or condition and the definitions herein relating thereto; (ii) a brief statement as to the nature and scope of the examination or investigation upon which the statements or opinions contained in such certificate or opinion are based; (iii) a statement that, in the opinion of each such individual, he has made such examination or investigation as is necessary to enable him to express an informed opinion as to whether or not such covenant or condition has been complied with; and (iv) a statement as to whether, in the opinion of each such individual, such condition or covenant has been complied with. SECTION 1.03. Form of Documents Delivered to Trustee. In any case where several matters are required to be certified by, or covered by an opinion of, any specified Person, it is not necessary that all such matters be certified by, or covered by the opinion of, only one such Person, or that they be so certified or covered by only one document, but one such Person may certify or give an opinion with respect to some matters and one or more other such Persons as to other matters, and any such Person may certify or give an opinion as to such matters in one or several documents. Any certificate or opinion of an officer of the Company may be based, insofar as it relates to legal matters, upon a certificate or opinion of, or representations by, counsel, unless such officer knows, or in the exercise of reasonable care should know, that the certificate or opinion or representations with respect to the matters upon which his certificate or opinion is based are erroneous. Any such certificate or Opinion of Counsel may be based, insofar as it relates to factual matters, upon a certificate or opinion of, or representations by, an officer or officers of the Company stating that the information with respect to such factual matters is in the possession of the Company, unless such counsel knows, or in the exercise of reasonable care should know, that the certificate or opinion or representations with respect to such matters are erroneous. Where any Person is required to make, give or execute two or more applications, requests, consents, certificates, statements, opinions or other instruments under this Indenture, they may, but need not, be consolidated and form one instrument. SECTION 1.04. Acts of Holders. (i) Any request, demand, authorization, direction, notice, consent, waiver or other action provided by this Indenture to be given or taken by Holders or Holders of any series may be embodied in and evidenced by one or more instruments of substantially similar tenor signed by such Holders in person or by an agent duly appointed in writing. If Securities of a series are issuable in whole or in part as Bearer Securities, any request, demand, authorization, direction, notice, consent, waiver or other action provided by this Indenture to be given or taken by Holders may, alternatively, be embodied in and evidenced by the record of Holders of Securities voting in favor thereof, either in person or by proxies duly appointed in writing, at any meeting of Holders of Securities duly called and held in accordance with the provisions of Article Sixteen or a combination of such instruments and any such record. Except as herein otherwise expressly provided, such action shall become effective when such instrument or instruments or record or both are delivered to the Trustee, and, where it is hereby expressly required, to the Company. Such instrument or instruments and any such record (and the action embodied therein and evidenced thereby) are herein sometimes referred to as the "Act" of the Holders signing such instrument or instruments and so voting at any such meeting. Proof of execution of any such instrument or of a writing appointing any such agent, or the holding by any Person of a Security, shall be sufficient for any purpose of this Indenture and (subject to Section 8.01) conclusive in favor of the Trustee and the Company, if made in the manner provided in this Section. The record of any meeting of Holders of Securities shall be proved in the manner provided in Section 16.06. (ii) The fact and date of the execution by any Person of any such instrument or writing may be proved by the affidavit of a witness of such execution or by the certificate of any notary public or other officer authorized by law to take acknowledgments of deeds, certifying that the individual signing such instrument or writing acknowledged to him the execution thereof. Where such execution is by or on behalf of any legal entity other than an individual, such certificate or affidavit shall also constitute proof of the authority of the Person executing the same. The fact and date of the execution of any such instrument or writing, or the authority of the Person executing the same, may also be proved in any other manner which the Trustee deems sufficient. (iii) The ownership of Registered Securities shall be proved by the Security Register. (iv) The principal amount and serial numbers of Bearer Securities held by any Person, and the date of holding the same, may be proved by the production of such Bearer Securities or by a certificate executed, as depositary, by any trust company, bank or other depositary, wherever situated, if such certificate shall be deemed by the Trustee to be satisfactory, showing that at the date therein mentioned such Person had on deposit with such depositary, or exhibited to it, the Bearer Securities therein described; or such facts may be proved by the certificate or affidavit of the Person holding such Bearer Securities, if such certificate or affidavit is deemed by the Trustee to be satisfactory. The Trustee and the Company may assume that such ownership of any Bearer Security continues until (1) another certificate or affidavit bearing a later date issued in respect of the same Bearer Security is produced, or (2) such Bearer Page 18
Security is produced to the Trustee by some other Person, or (3) such Bearer Security is surrendered in exchange for a Registered Security, or (4) such Bearer Security is no longer Outstanding. (v) The fact and date of execution of any such instrument or writing, the authority of the Person executing the same and the principal amount and serial numbers of Bearer Securities held by the Person so executing such instrument or writing and the date of holding the same may also be proved in any other manner which the Trustee deems sufficient; and the Trustee may in any instance require further proof with respect to any of the matters referred to in this Section. (vi) Any request, demand, authorization, direction, notice, consent, waiver or other action by the Holder of any Security shall bind every future Holder of the same Security and the Holder of every Security issued upon the registration of transfer thereof or in exchange therefor or in lieu thereof, in respect of any action taken, suffered or omitted by the Trustee or the Company in reliance thereon, whether or not notation of such action is made upon such Security. (vii) For purposes of determining the principal amount of Outstanding Securities of any series the Holders of which are required, requested or permitted to give any request, demand, authorization, direction, notice, consent, waiver or take any other Act under the Indenture, each Security denominated in a Foreign Currency or composite currency shall be deemed to have the principal amount determined by the Exchange Rate Agent by converting the principal amount of such Security in the currency in which such Security is denominated into Dollars at the Exchange Rate as of the date such Act is delivered to the Trustee and, where it is hereby expressly required, to the Company, by Holders of the required aggregate principal amount of the Outstanding Securities of such series (or, if there is no such rate on such date, such rate on the date determined as specified as contemplated in Section 3.01). (viii) The Company may, in the circumstances permitted by the Trust Indenture Act, set a record date for purposes of determining the identity of Holders of Securities of any series entitled to give any request, demand, authorization, direction, notice, consent, waiver or take any other Act, or to vote or consent to any action by vote or consent authorized or permitted to be given or taken by Holders of Securities of such series. If not set by the Company prior to the first solicitation of a Holder of Securities of such Series made by any Person in respect of any such action, or in the case of any such vote, prior to such vote, such record date shall be the later of 30 days prior to the first solicitation of such consent or the date of the most recent list of Holders of such Securities furnished to the Trustee pursuant to Section 6.01 prior to such solicitation. (ix) Without limiting the foregoing, a Holder entitled hereunder to take any action hereunder with regard to any particular Security may do so with regard to all or any part of the principal amount of such Security or by one or more duly appointed agents each of which may do so pursuant to such appointment with regard to all or any part of such principal amount. Any notice given or action taken by a Holder or its agents with regard to different parts of such principal amount pursuant to this paragraph shall have the same effect as if given or taken by separate Holders of each such different part. (x) Without limiting the generality of the foregoing, unless otherwise specified pursuant to Section 3.01 or pursuant to one or more indentures supplemental hereto, a Holder, including a Depositary that is the Holder of a Global Security, may make, give or take, by a proxy or proxies duly appointed in writing, any request, demand, authorization, direction, notice, consent, waiver or other action provided in this Indenture to be made, given or taken by Holders, and a Depositary that is the Holder of a Global Security may provide its proxy or proxies to the beneficial owners of interests in any such Global Security through such Depositary's standing instructions and customary practices. (xi) The Company may fix a record date for the purpose of determining the Persons who are beneficial owners of interests in any Global Security held by a Depositary entitled under the procedures of such Depositary to make, give or take, by a proxy or proxies duly appointed in writing, any request, demand, authorization, direction, notice, consent, waiver or other action provided in this Indenture to be made, given or taken by Holders. If such a record date is fixed, the Holders on such record date or their duly appointed proxy or proxies, and only such Persons, shall be entitled to make, give or take such request, demand, authorization, direction, notice, consent, waiver or other action, whether or not such Holders remain Holders after such record date. No such request, demand, authorization, direction, notice, consent, waiver or other action shall be valid or effective if made, given or taken more than 90 days after such record date. SECTION 1.05. Notices, etc., to Trustee and Company. Any request, demand, authorization, direction, notice, consent, waiver or Act of Holders or other document provided or permitted by this Indenture to be made upon, given or furnished to, or filed with, (i) the Trustee by any Holder or by the Company shall be sufficient for every purpose hereunder if made, given, furnished or filed in writing to or with the Trustee at its Principal Corporate Trust Office, Attention: Corporate Trustee Administration Department, or (ii) the Company by any Holder or by the Trustee shall be sufficient for every purpose hereunder (unless otherwise herein expressly provided) if in writing and mailed, first-class, postage prepaid, to the Company, to the attention of its Treasurer, addressed to it at the address of its principal office specified in the first paragraph of this Indenture or at any other address previously furnished in writing to the Trustee by the Company. SECTION 1.06. Notices to Holders; Waiver. Where this Indenture or any Security provides for notice to Holders of any event, Page 19
(1) such notice shall be sufficiently given (unless otherwise herein or in such Security expressly provided) if in writing and mailed, first-class, postage prepaid, to each Holder of Registered Securities affected by such event, at his address as it appears in the Security Register, not later than the latest date, and not earlier than the earliest date, prescribed for the giving of such notice. (2) such notice shall be sufficiently given to Holders of Bearer Securities if published in an Authorized Newspaper in The City of New York and, if the Securities of such series are then listed on The International Stock Exchange of the United Kingdom and the Republic of Ireland Limited and such stock exchange shall so require, in London and, if the Securities of such series are then listed on the Luxembourg Stock Exchange and such stock exchange shall so require, in Luxembourg and, if the Securities of such series are then listed on any other stock exchange and such stock exchange shall so require, in any other required city outside the United States, or, if not practicable, elsewhere in Europe on a Business Day at least twice, the first such publication to be not earlier than the earliest date, and not later than the latest date, prescribed for the giving of such notice. In case by reason of the suspension of regular mail service or by reason of any other cause it shall be impracticable to give such notice to Holders of Registered Securities by mail, then such notification as shall be made with the approval of the Trustee shall constitute a sufficient notification for every purpose hereunder. In any case where notice to Holders of Registered Securities is given by mail, neither the failure to mail such notice, nor any defect in any notice so mailed, to any particular Holder of Registered Securities shall affect the sufficiency of such notice with respect to other Holders of Registered Securities or the sufficiency of any notice by publication to Holders of Bearer Securities given as provided above. In case by reason of the suspension of publication of any Authorized Newspaper or Authorized Newspapers or by reason of any other cause it shall be impracticable to publish any notice to Holders of Bearer Securities as provided above, then such notification to Holders of Bearer Securities as shall be given with the approval of the Trustee shall constitute sufficient notice to such Holders for every purpose hereunder. Neither the failure to give notice by publication to Holders of Bearer Securities as provided above, nor any defect in any notice so published, shall affect the sufficiency of any notice mailed to Holders of Registered Securities as provided above. Where this Indenture provides for notice in any manner, such notice may be waived in writing by the Person entitled to receive such notice, either before or after the event, and such waiver shall be the equivalent of such notice. Waivers of notice by Holders shall be filed with the Trustee, but such filing shall not be a condition precedent to the validity of any action taken in reliance upon such waiver. SECTION 1.07. Language of Notices, Etc. Any request, demand, authorization, direction, notice, consent, or waiver required or permitted under this Indenture shall be in the English language, except that any published notice may be in an official language of the country of publication. SECTION 1.08. Conflict with Trust Indenture Act. If and to the extent that any provision of this Indenture limits, qualifies or conflicts with the duties imposed by, or with another provision (an "incorporated provision") included in this Indenture by operation of, Sections 310 and 318, inclusive, of the TIA, such imposed duties or incorporated provision shall control. SECTION 1.09. Effect of Headings and Table of Contents. The Article and Section headings herein and the Table of Contents are for convenience only and shall not affect the construction hereof. SECTION 1.10. Successors and Assigns. All covenants and agreements in this Indenture by the Company shall bind its successors and assigns, whether so expressed or not. SECTION 1.11. Separability Clause. In case any provision in this Indenture or in the Securities shall be invalid, illegal or unenforceable, the validity, legality and enforceability of the remaining provisions shall not in any way be affected or impaired thereby. SECTION 1.12. Benefits of Indenture. Nothing in this Indenture or in the Securities, express or implied, shall give to any Person, other than the parties hereto and their successors hereunder, the Holders and, to the extent provided in Article Fourteen hereof, the holders of Senior Indebtedness and creditors in respect of General Obligations, any benefit or any legal or equitable right, remedy or claim under this Indenture. SECTION 1.13. Legal Holidays. Unless otherwise provided as contemplated by Section 3.01 with respect to any series of Securities, in any case where any Interest Payment Date, Stated Maturity, Repayment Date or Redemption Date of any Security or any date on which any Defaulted Interest is proposed to be paid shall not be a Business Day at any Place of Payment, then (notwithstanding any other provisions of the Securities or this Indenture) payment of the principal of, premium, if any, or interest on any Securities need not be made at such Place of Payment on such date, but may be made on the next succeeding Business Day with the same force and effect as if made on the Interest Payment Date, Stated Maturity, Repayment or Redemption Date or on the date on which Defaulted Interest is proposed to be paid and, if such payment is made, no interest shall accrue on such payment for the period from and after any such Interest Payment Date, Stated Maturity, Repayment Date or Redemption Date or date on which Defaulted Interest is proposed to be paid, as the case may be. Page 20
SECTION 1.14. Governing Law. This Indenture and the Securities shall be construed in accordance with and governed by the laws of the State of New York. ARTICLE TWO SECURITY FORMS SECTION 2.01. Form Generally. All Securities and any related coupons shall have such appropriate insertions, omissions, substitutions and other variations as are required or permitted by this Indenture, and may have such letters, numbers or other marks of identification and such legends or endorsements placed thereon as may be required to comply with the rules of any securities exchange or as may, consistently herewith, be determined by the officers executing such Securities or coupons, as evidenced by their execution of the Securities or coupons. The Trustee's certificates of authentication shall be in substantially the form set forth in this Article. Unless otherwise provided as contemplated by Section 3.01 with respect to any series of Securities, the Securities of each series shall be issuable in registered form without coupons. If so provided as contemplated by Section 3.01, the Securities of a series shall be issuable solely in bearer form, or in both registered form and bearer form. Unless otherwise specified as contemplated by Section 3.01, Securities in bearer form shall have interest coupons attached. The definitive Securities and coupons shall be printed, lithographed or engraved or produced by any combination of these methods on a steel engraved border or steel engraved borders or may be produced in any other manner, all as determined by the officers executing such Securities or coupons, as evidenced by their execution of such Securities or coupons. SECTION 2.02. Form of Securities. Each Security and coupon shall be in one of the forms approved from time to time by or pursuant to a Board Resolution or an indenture supplemental hereto. Upon or prior to the delivery of a Security or coupons in any such form to the Trustee for authentication, the Company shall deliver to the Trustee the following: (i) such indenture supplemental hereto or the Board Resolution by or pursuant to which such form of Security or coupons has been approved, certified by the Secretary or an Assistant Secretary of the Company; (ii) the Officers' Certificate required by Section 3.01 of this Indenture; (iii) the Company Order required by Section 3.03 of this Indenture; and (iv) the Opinion of Counsel required by Section 3.03 of this Indenture. If temporary Securities of any series are issued in global form as permitted by Section 3.04, the form thereof shall be established as provided in Section 2.02. SECTION 2.03. Form of Trustee's Certificate of Authentication. TRUSTEE'S CERTIFICATE OF AUTHENTICATION This is one of the Securities of the series designated therein referred to in the within-mentioned Indenture. THE CHASE MANHATTAN BANK, AS TRUSTEE by_______________________ Authorized Officer SECTION 2.04. Global Securities. If Securities of a series are issuable in whole or in part in global form, as specified as contemplated by Section 3.01, then, notwithstanding clause (xii) of Section 3.01 and the provisions of Section 3.02, such Global Security shall represent such of the outstanding Securities of such series as shall be specified therein and may provide that it shall represent the aggregate amount of Outstanding Securities from time to time endorsed thereon and that the aggregate amount of Outstanding Securities represented thereby may from time to time be reduced or increased to reflect exchanges or increased to reflect the issuance of additional uncertificated securities of such series. Any endorsement of a Global Security to reflect the amount, or any increase or decrease in the amount, of Outstanding Securities represented thereby shall be made in such manner and upon instructions given by such Person or Persons as shall be specified therein or in the Company Order to be delivered to the Trustee pursuant to Section 3.03 or Section 3.04. Page 21
Global Securities may be issued in either registered or bearer form and in either temporary or permanent form. ARTICLE THREE THE SECURITIES SECTION 3.01. Title and Terms. The aggregate principal amount of Securities which may be authenticated and delivered under this Indenture is unlimited. The Securities may be issued up to the aggregate principal amount of Securities from time to time authorized by or pursuant to a Board Resolution. The Securities may be issued in one or more series. All Securities of each series issued under this Indenture shall in all respects be equally and ratably entitled to the benefits hereof with respect to such series without preference, priority or distinction on account of the actual time or times of the authentication and delivery or Maturity of the Securities of such series. There shall be established in or pursuant to a Board Resolution, and set forth in, or determined in the manner provided in, an Officers' Certificate, or established in one or more indentures supplemental hereto, prior to the issuance of Securities of any series, (i) the title of the Securities of the series (which shall distinguish the Securities of the series from all other Securities); (ii) any limit upon the aggregate principal amount or aggregate initial public offering price of the Securities of the series which may be authenticated and delivered under this Indenture (except for Securities authenticated and delivered upon registration of transfer of, or in exchange for, or in lieu of, other Securities of that series pursuant to this Article Three or Sections 4.07, 9.06 or 15.03); (iii) the priority of payment, if any, of the Securities; (iv) The price or prices (which may be expressed as a percentage of the aggregate principal amount thereof) at which the Securities will be issued; (v) the date or dates on which the principal and premium, if any, of the Securities of the series is payable; (vi) the rate or rates at which the Securities of the series shall bear interest, if any, or the method or methods by which such rates may be determined, if any, the date or dates from which such interest shall accrue, the Interest Payment Dates on which such interest shall be payable, the Regular Record Date for the interest payable on any Interest Payment Date and the basis upon which interest shall be calculated if other than that of a 360-day year consisting of twelve 30-day months; (vii) the extent to which any of the Securities will be issuable in temporary or permanent global form, and in such case, the Depositary for such Global Security or Securities, the terms and conditions, if any, upon which such Global Security may be exchanged in whole or in part for definitive securities, and the manner in which any interest payable on a temporary or permanent Global Security will be paid, whether or not consistent with Section 3.04 or 3.05; (viii) the office or offices or agency where, subject to Section 5.02, the Securities may be presented for registration of transfer or exchange; (ix) the place or places where, subject to the provisions of Section 5.02, the principal of (and premium, if any) and interest, if any, on Securities of the series shall be payable; (x) the period or periods within which, the price or prices at which and the terms and conditions upon which Securities of the series may be redeemed, in whole or in part, at the option of the Company; (xi) the obligation, if any, of the Company to redeem or purchase Securities of the series pursuant to any sinking fund or analogous provisions or at the option of a Holder thereof and the period or periods within which, the price or prices at which and the terms and conditions upon which Securities of the series shall be redeemed or purchased, in whole or in part, pursuant to such obligation; (xii) if other than denominations of $1,000 and any integral multiple thereof, the denominations in which Registered Securities of the series shall be issuable; and, if other than $5,000 or any integral multiple thereof, the denominations in which Bearer Securities of the series shall be issuable; (xiii) the currency or currencies of denominations of the Securities of any series, which may be in Dollars, any Foreign Currency or any composite currency, including but not limited to the ECU, and, if any such currency of denomination is a composite currency other than the ECU, the agency or organization, if any, responsible for overseeing such composite currency; (xiv) the currency or currencies in which payment of the principal of (and premium, if any) and interest on the Securities will be made, the currency or currencies, if any, in which payment of the principal of (and premium, if any) or the interest on Registered Securities, Page 22
at the election of each of the Holders thereof, may also be payable and the periods within which and the terms and conditions upon which such election is to be made and the Exchange Rate and the Exchange Rate Agent; (xv) if the amount of payments of principal of (and premium, if any) or any interest on Securities of the series may be determined with reference to an index, the method or methods by which such amounts shall be determined; (xvi) whether Securities of the series are to be issuable as Registered Securities, Bearer Securities or both, whether Securities of the series are to be issuable with or without coupons or both and, in the case of Bearer Securities, the date as of which such Bearer Securities shall be dated if other than the date of original issuance of the first Security of such series of like tenor and term to be issued; (xvii) whether, and under what conditions, additional amounts will be payable to Holders of Securities of the series pursuant to Section 5.04; (xviii) whether any of the Securities will be issued as Original Issue Discount Securities and the portion of the principal amount of such Securities which shall be payable upon declaration of acceleration of the Maturity thereof pursuant to Section 7.02; (xix) information with respect to book-entry procedures, if any; (xx) any addition to or change in the Events of Default or covenants of the Company pertaining to the Securities of the series; and (xxi) any other terms of the series. All Securities of any one series and the coupons appertaining to Bearer Securities of such series, if any, shall be substantially identical except, in the case of Registered Securities, as to denomination and except as may otherwise be provided in or pursuant to such Board Resolution and set forth, or determined in the manner provided in such Officers' Certificate or in any indenture supplement hereto. Securities of any particular series may be issued at various times, with different dates on which the principal or any installment of principal is payable, with different rates of interest, if any, or different methods by which rates of interest may be determined, with different dates on which such interest may be payable and with different Redemption Dates or Repayment Dates and may be denominated in different currencies or payable in different currencies. All Securities shall be subordinate and junior in right of payment to the obligations of the Company to holders of Senior Indebtedness and creditors in respect of General Obligations of the Company as provided in Article Fourteen. Notwithstanding Section 3.01(ii) and unless otherwise expressly provided with respect to a series of Securities, the aggregate principal amount of a series of Securities may be increased and additional Securities of such series may be issued up to the maximum aggregate principal amount authorized with respect to such series as increased. SECTION 3.02. Denominations. The Securities of each series shall be issuable in such form and denominations as shall be specified as contemplated by Section 3.01. In the absence of any specification with respect to the Securities of any series, the Registered Securities of each series shall be issuable only as Securities without coupons in denominations of $1,000 and any integral multiple thereof and the Bearer Securities of each series, if any, shall be issuable with coupons and in denominations of $5,000 and any integral multiple thereof. SECTION 3.03. Execution, Authentication, Delivery and Dating. The Securities shall be executed on behalf of the Company by its Chairman of the Board, its President, a Vice Chairman of the Board, or one of its Vice Presidents, or its Treasurer and by its Secretary or one of its Assistant Secretaries. The signatures of any or all of these officers on the Securities may be manual or facsimile. Coupons shall bear the facsimile signature of the Company's Chairman of the Board, its President, a Vice Chairman of the Board or one of its Vice Presidents, or its Treasurer. Securities and coupons bearing the manual or facsimile signatures of individuals who were at any time the proper officers of the Company shall bind the Company, notwithstanding that such individuals or any of them have ceased to hold such offices prior to the authentication and delivery of such Securities or did not hold such offices at the date of such Securities. At any time and from time to time after the execution and delivery of this Indenture, the Company may deliver Securities of any series, together with any coupons appertaining thereto, executed by the Company to the Trustee for authentication, together with a Company Order for the authentication and delivery of such Securities, and the Trustee shall, upon receipt of the Company Order, authenticate and deliver such Securities as in this Indenture provided and not otherwise; provided, however, that, in connection with its original issuance, no Bearer Security shall be mailed or otherwise delivered to any location in the United States; and provided further that a Bearer Security may be delivered in connection with its original issuance only if the Person entitled to receive such Bearer Security shall have delivered to the Trustee, or such other Person as shall be specified in a temporary Global Security delivered pursuant to Section 3.04, a certificate in the form required by Section 3.11(i). Page 23
If the Company shall establish pursuant to Section 3.01 that the Securities of a series are to be issued in whole or in part in the form of one or more Global Securities in registered or permanent bearer form, then the Company shall execute and the Trustee shall, in accordance with this Section and a Company Order for the authentication and delivery of such Global Securities with respect to such series, authenticate and deliver one or more Global Securities in permanent or temporary form that (i) shall represent and shall be denominated in an aggregate amount equal to the aggregate principal amount of the Outstanding Securities of such series to be represented by one or more Global Securities, (ii) shall be registered, if in registered form, in the name of the Depositary for such Global Security or Securities or the nominee of such Depositary and (iii) shall be delivered by the Trustee to such Depositary or pursuant to such Depositary's instructions. Each Depositary designated pursuant to Section 3.01 for a Global Security in registered form must, at the time of its designation and at all times while it serves as Depositary, be a clearing agency registered under the Exchange Act, and any other applicable statute or regulation. In authenticating such Securities, and accepting the additional responsibilities under this Indenture in relation to such Securities, the Trustee shall be entitled to receive, and (subject to Section 8.01) shall be fully protected in relying upon, an Opinion of Counsel complying with Section 1.02 and stating that, (i) the form of such Securities and coupons, if any, has been established in conformity with the provisions of this Indenture; (ii) the terms of such Securities and coupons, if any, or the manner of determining such terms have been established in conformity with the provisions of this Indenture; (iii) that such Securities and coupons, when authenticated and delivered by the Trustee and issued by the Company in the manner and subject to any conditions specified in such Opinion of Counsel, will constitute valid and legally binding obligations of the Company, enforceable against the Company in accordance with their terms, subject to bankruptcy, insolvency, fraudulent transfer, reorganization, moratorium and other laws of general applicability relating to or affecting the enforcement of creditors' rights and to general principles of equity; and (iv) such other matters as the Trustee may reasonably request. The Trustee shall not be required to authenticate such Securities if the issue thereof will adversely affect the Trustee's own rights, duties or immunities under the Securities and this Indenture or otherwise in a manner which is not reasonably acceptable to the Trustee. Notwithstanding the provisions of Section 3.01 and of this Section 3.03, if all Securities of a series are not to be originally issued at one time, it shall not be necessary to deliver the Board Resolution or Officers' Certificate otherwise required pursuant to Section 3.01 or the Company Order and Opinion of Counsel otherwise required pursuant to this Section 3.03 at or prior to the time of authentication of each Security of such series if such documents are delivered at or prior to the authentication upon original issuance of the first Security of such series to be issued and such documents reasonably contemplate the issuance of all Securities of such series; provided that any subsequent request by the Company to the Trustee to authenticate Securities of such series upon original issuance shall constitute a representation and warranty by the Company that as of the date of such request, the statements made in the Officers' Certificate or other certificates delivered pursuant to Sections 1.02 and 3.01 shall be true and correct as if made on such date. A Company Order, Officers' Certificate or Board Resolution or supplemental indenture delivered by the Company to the Trustee in the circumstances set forth in the preceding paragraph may provide that Securities which are the subject thereof will be authenticated and delivered by the Trustee or its agent on original issue from time to time in the aggregate principal amount, if any, established for such series pursuant to such procedures acceptable to the Trustee as may be specified from time to time by Company Order upon the telephonic (promptly confirmed in writing), electronic or written order of Persons designated in such Company Order, Officers' Certificate, supplemental indenture or Board Resolution and that such Persons are authorized to determine, consistent with such Company Order, Officers' Certificate, supplemental indenture or Board Resolution, such terms and conditions of said Securities as are specified in such Company Order, Officers' Certificate, supplemental indenture or Board Resolution. Each Registered Security shall be dated the date of its authentication; and unless otherwise specified as contemplated by Section 3.01, each Bearer Security and any temporary Global Security referred to in Section 3.04 shall be dated as of the date of original issuance of such Security. No Security or coupon appertaining thereto shall be entitled to any benefit under this Indenture or be valid or obligatory for any purpose, unless there appears on such Security a certificate of authentication substantially in the form provided for herein executed by the Trustee by manual signature of an authorized officer, and such certificate upon any Security shall be conclusive evidence, and the only evidence, that such Security has been duly authenticated and delivered hereunder. Except as permitted by Section 3.06, the Trustee shall not authenticate and deliver any Bearer Security unless all appurtenant coupons for interest then matured have been Page 24
detached and canceled. Notwithstanding the foregoing, if any Security or portion thereof shall have been duly authenticated and delivered hereunder but never issued and sold by the Company, and the Company shall deliver such Security to the Trustee for cancelation as provided in Section 3.09 together with a written statement (which need not comply with Section 1.02 and need not be accompanied by an Opinion of Counsel) stating that such Security or portion thereof has never been issued and sold by the Company, for all purposes of this Indenture such Security shall be deemed never to have been authenticated and delivered hereunder and shall never be entitled to the benefits of this Indenture. SECTION 3.04. Temporary Securities. (a) Pending the preparation of definitive Securities of any series, the Company may execute, and upon Company Order and the receipt of the certifications and opinions required under Sections 3.01 and 3.03, the Trustee shall authenticate and deliver, temporary Securities which are printed, lithographed, typewritten, mimeographed or otherwise produced, in any authorized denominations, substantially of the tenor of the definitive Securities in lieu of which they are issued in registered form or, if authorized, in bearer form with one or more coupons or without coupons, and with such appropriate insertions, omissions, substitutions and other variations as the officers executing such Securities may determine, as evidenced by their execution of such Securities. In the case of any series which may be issuable as Bearer Securities, such temporary Securities may be in global form, representing such of the Outstanding Securities of such series as shall be specified therein. (b) Unless otherwise provided pursuant to Section 3.01: (i) Except in the case of temporary Securities in global form, each of which shall be exchanged in accordance with the provisions of the following paragraphs, if temporary Securities of any series are issued, the Company will cause definitive Securities of such series to be prepared without unreasonable delay. After the preparation of definitive Securities, the temporary Securities of such series shall be exchangeable for definitive Securities of such series upon surrender of the temporary Securities of such series at the office or agency of the Company in a Place of Payment for that series, without charge to the Holder. Upon surrender for cancelation of any one or more temporary Securities of any series (accompanied, if applicable, by all unmatured coupons and all matured coupons in default appertaining thereto), the Company shall execute and the Trustee shall authenticate and deliver in exchange therefor a like principal amount of definitive Securities of such series of authorized denominations; provided, however, that no definitive Bearer Security shall be delivered in exchange for a temporary Registered Security; and provided further that a definitive Bearer Security shall be delivered in exchange for a temporary Bearer Security only in compliance with the conditions set forth in the provisos to the third paragraph of Section 3.03. Until so exchanged, the temporary Securities of any series shall in all respects be entitled to the same benefits under this Indenture as definitive Securities of such series. (ii) If temporary Securities of any series are issued in global form, any such temporary Global Security shall, unless otherwise provided in such temporary Global Security, be delivered to the London office of a depositary or common depositary (the "Common Depositary"), for the benefit of the operator of Euroclear and CEDEL S.A., for credit to the respective accounts of the beneficial owners of such Securities (or to such other accounts as they may direct). Upon receipt of written instructions (which need not comply with Section 1.02) signed on behalf of the Company by any Person authorized to give such instructions, the Trustee or any Authenticating Agent shall endorse such temporary Global Security to reflect the initial principal amount, or an increase in the principal amount, of Outstanding Securities represented thereby. Until such initial endorsement, such temporary Global Security shall not evidence any obligation of the Company. Such temporary Global Security shall at any time represent the aggregate principal amount of Outstanding Securities theretofore endorsed thereon as provided above, subject to reduction to reflect exchanges as described below. (iii) Unless otherwise specified in such temporary Global Security, and subject to the second proviso in the following paragraph, the interest of a beneficial owner of Securities of a series in a temporary Global Security shall be exchanged for definitive Securities (including a definitive Global Bearer Security) of such series and of like tenor following the Global Exchange Date (as defined below) when the account holder instructs Euroclear or CEDEL S.A., as the case may be, to request such exchange on his behalf and delivers to Euroclear or CEDEL S.A., as the case may be, a certificate in the form required by Section 3.11(i), dated no earlier than 15 days prior to the Global Exchange Date, copies of which certificate shall be available from the offices of Euroclear and CEDEL S.A., the Trustee, any Authenticating Agent appointed for such series of Securities and each Paying Agent. Unless otherwise specified in such temporary Global Security, any such exchange shall be made free of charge to the beneficial owners of such temporary Global Security, except that a Person receiving definitive Securities must bear the cost of insurance, postage, transportation and the like in the event that such Person does not take delivery of such definitive Securities in person at the offices of Euroclear or CEDEL S.A. Definitive Securities in bearer form to be delivered in exchange for any portion of a temporary Global Security shall be delivered only outside the United States. (iv) Without unnecessary delay but in any event not later than the date specified in, or determined pursuant to the terms of, any such temporary Global Security as the "Global Exchange Date" (the "Global Exchange Date"), the Company shall deliver to the Trustee, or, if the Trustee appoints an Authenticating Agent pursuant to Section 8.14, to any such Authenticating Agent, definitive Securities in aggregate principal amount equal to the principal amount of such temporary Global Security, executed by the Company. Unless otherwise specified as contemplated by Section 3.01, such definitive Securities shall be in the form of Bearer Securities or Registered Securities, or any combination thereof, as may be specified by the Company, the Trustee or any such Authenticating Agent, as may be Page 25
appropriate. On or after the Global Exchange Date, such temporary Global Security shall be surrendered by the Common Depositary to the Trustee or any such Authenticating Agent, as the Company's agent for such purpose, to be exchanged, in whole or from time to time in part, for definitive Securities without charge and the Trustee or any such Authenticating Agent shall authenticate and deliver, in exchange for each portion of such temporary Global Security, an equal aggregate principal amount of definitive Securities of the same series, of authorized denominations and of like tenor as the portion of such temporary Global Security to be exchanged, which, except as otherwise specified as contemplated by Section 3.01, shall be in the form of Bearer Securities or Registered Securities, or any combination thereof; provided, however, that unless otherwise specified in such temporary Global Security, upon such presentation by the Common Depositary, such temporary Global Security is accompanied by a certificate dated the Global Exchange Date or a subsequent date and signed by Euroclear as to the portion of such temporary Global Security held for its account then to be exchanged and a certificate dated the Global Exchange Date or a subsequent date and signed by CEDEL S.A., as to the portion of such temporary Global Security held for its account then to be exchanged, each in the form required by Section 3.11(ii); and provided further that a definitive Bearer Security (including a definitive global Bearer Security) shall be delivered in exchange for a portion of a temporary Global Security only in compliance with the conditions set forth in the provisos to the third paragraph of Section 3.03. (v) Upon any exchange of a portion of any such temporary Global Security, such temporary Global Security shall be endorsed by the Trustee or any such Authenticating Agent, as the case may be, to reflect the reduction of the principal amount evidenced thereby, whereupon its remaining principal amount shall be reduced for all purposes by the amount so exchanged. Until so exchanged in full, such temporary Global Security shall in all respects be entitled to the same benefits under this Indenture as definitive Securities of such series authenticated and delivered hereunder, except that, unless otherwise specified as contemplated by Section 3.01, interest payable on such temporary Global Security on an Interest Payment Date for Securities of such series occurring prior to the applicable Global Exchange Date shall be payable, without interest, to Euroclear and CEDEL S.A. on or after such Interest Payment Date upon delivery by Euroclear and CEDEL S.A. to the Trustee or the Paying Agent, as the case may be, of a certificate or certificates in the form required by Section 3.11(iii), for credit on or after such Interest Payment Date to the respective accounts of the Persons who are the beneficial owners of such temporary Global Security on such Interest Payment Date and who have each delivered to Euroclear or CEDEL S.A., as the case may be, a certificate in the form required by Section 3.11(iv). Any interest so received by Euroclear and CEDEL S.A. and not paid as herein provided prior to the Global Exchange Date shall be returned to the Trustee or Paying Agent, as the case may be, which, upon expiration of two years after such Interest Payment Date, shall repay such interest to the Company on Company Request in accordance with Section 5.03. SECTION 3.05. Registration, Registration of Transfer and Exchange. With respect to Registered Securities, the Company shall keep or cause to be kept a register (sometimes referred to as the "Security Register") in which, subject to such reasonable regulations as it may prescribe, the Company shall provide for the registration of Registered Securities and the registration of transfers of Registered Securities and the Company shall appoint a "Security Registrar", and may appoint any "Co-Security Registrar", as may be appropriate, to keep the Security Register. Such Security Register shall be in written form or in any other form capable of being converted into written form within a reasonable time. At all reasonable times the information contained in such Security Register shall be available for inspection by the Trustee at the office of the Security Registrar. In the event that any Registered Securities issued hereunder have the City of New York as a Place of Payment, the Company shall appoint either a Security Registrar or Co-Security Registrar located in the City of New York. Upon surrender for registration of transfer of any Registered Security of any series at the office or agency of the Company maintained pursuant to Section 5.02 for such purpose in a Place of Payment for such series, the Company shall execute, and the Trustee shall authenticate and deliver, in the name of the designated transferee or transferees, one or more new Registered Securities of such series of any authorized denominations and of a like aggregate principal amount, tenor and Stated Maturity. At the option of the Holder, Registered Securities of any series may be exchanged for other Registered Securities of such series, of any authorized denominations and of like aggregate principal amount, tenor and Stated Maturity, upon surrender of the Securities to be exchanged at such office or agency. Whenever any Securities are so surrendered for exchange, the Company shall execute, and the Trustee shall authenticate and deliver, the Securities which the Holder making the exchange is entitled to receive. Registered Securities may not be exchanged for Bearer Securities. At the option of the Holder, Bearer Securities of any series may be exchanged for Registered Securities of the same series of any authorized denominations and of a like aggregate principal amount and tenor, upon surrender of the Bearer Securities to be exchanged at any such office or agency, with all unmatured coupons and all matured coupons in default thereto appertaining. If the Holder of a Bearer Security is unable to produce any such unmatured coupon or coupons or matured coupon or coupons in default, such exchange may be effected if the Bearer Securities are accompanied by payment in funds acceptable to the Company in an amount equal to the face amount of such missing coupon or coupons, or the surrender of such missing coupon or coupons may be waived by the Company and the Trustee if there be furnished to them such security or indemnity as they may require to save each of them and any Paying Agent harmless. If thereafter the Holder of such Security shall surrender to any Paying Agent any such missing coupon in respect of which such a payment shall have been made, such Holder shall be entitled to receive the amount of any such payment from the Company; provided, however, that interest represented by coupons shall be payable only upon presentation and surrender of those Page 26
coupons at an office or agency of a Paying Agent, maintained pursuant to Section 5.02 for such purpose, located outside the United States. Notwithstanding the foregoing, in case a Bearer Security of any series is surrendered at any such office or agency in exchange for a Registered Security of the same series and like tenor after the close of business at such office or agency on (i) any Regular Record Date and before the opening of business at such office or agency on the relevant Interest Payment Date, or (ii) any Special Record Date and before the opening of business at such office or agency on the related date for payment of Defaulted Interest, such Bearer Security shall be surrendered without the coupon relating to such Interest Payment Date or proposed date for payment, as the case may be. Notwithstanding any other provision of this Section, unless and until it is exchanged in whole or in part for individual Securities represented thereby, a Global Security representing all or a portion of the Securities of a series may not be transferred except as a whole by the Depositary for such series to a nominee of such Depositary or by a nominee of such Depositary to such Depositary or another nominee of such Depositary or by such Depositary or any such nominee to a successor Depositary for such series or a nominee of such successor Depositary. Whenever any Securities are so surrendered for exchange, the Company shall execute, and the Trustee shall authenticate and deliver, the Securities which the Holder making the exchange is entitled to receive. If at any time the Depositary for the Securities of a series notifies the Company that it is unwilling or unable to continue as Depositary for the Securities of such series or if at any time the Depositary for the Securities of such series shall no longer be eligible under Section 3.03, the Company shall appoint a successor Depositary with respect to the Securities of such series. If a successor Depositary for the Securities of such series is not appointed by the Company within 90 days after the Company receives such notice or becomes aware of such ineligibility, the Company's election pursuant to Section 3.01(vii) shall no longer be effective with respect to the Securities of such series and the Company will execute, and the Trustee, upon receipt of a Company Order for the authentication and delivery of definitive Securities of such series, will authenticate and deliver Securities of such series of like tenor and terms in definitive form in an aggregate principal amount equal to the principal amount of the Global Security or Securities representing such series in exchange for such Global Security or Securities. The Company may at any time and in its sole discretion determine that the Securities of any series issued in the form of one or more Global Securities shall no longer be represented by such Global Security or Securities. In such event, the Company will execute, and the Trustee, upon receipt of a Company Order for the authentication and delivery of definitive Securities of such series, will authenticate and deliver, Securities of such series of like tenor and terms in definitive form in an aggregate principal amount equal to the principal amount of the Global Security or Securities representing such series in exchange for such Global Security or Securities. If specified by the Company pursuant to Section 3.01 with respect to a series of Securities, the Depositary for such series of Securities may surrender a Global Security for such series of Securities in exchange in whole or in part for Securities of such series of like tenor and terms and in definitive form on such terms as are acceptable to the Company, the Trustee and such Depositary. Thereupon, the Company shall execute, and the Trustee upon receipt of a Company Order for the authentication and delivery of definitive Securities of such series, shall authenticate and deliver, without service charge: (a) to the Depositary or to each Person specified by such Depositary a new Security or Securities of the same series, of like tenor and terms and of any authorized denomination as requested by such Person in aggregate principal amount equal to and in exchange for such Person's beneficial interest in the Global Security; and (b) to such Depositary a new Global Security of like tenor and terms and in an authorized denomination equal to the difference, if any, between the principal amount of the surrendered Global Security and the aggregate principal amount of Securities delivered to Holders thereof. In any exchange provided for in any of the preceding three paragraphs, the Company will execute and the Trustee, pursuant to a Company Order, will authenticate and deliver, Securities (a) in definitive registered form in authorized denominations, if the Securities of such series are issuable as Registered Securities, (b) in definitive bearer form in authorized denominations, with coupons attached, if the Securities of such series are issuable as Bearer Securities or (c) as either Registered or Bearer Securities, if the Securities of such series are issuable in either form; provided, however, that no definitive Bearer Security shall be delivered in exchange for a temporary Global Security other than in accordance with the provisions of Sections 3.03 and 3.04. Upon the exchange of Global Securities for Securities in definitive form, such Global Securities shall be canceled by the Trustee. Registered Securities issued in exchange for a Global Security pursuant to this Section 3.05 shall be registered in such names and in such authorized denominations, and delivered to such addresses, as the Depositary for such Global Security, pursuant to instructions from its direct or indirect participants or otherwise, shall instruct the Trustee in writing. The Trustee shall deliver such Registered Securities to the Persons in whose names such Securities are so registered or to the Depositary. The Trustee shall deliver Bearer Securities issued in exchange for a Global Security pursuant to this Section 3.05 to the Depositary or to the Persons at such addresses, and in such authorized denominations, as the Depositary for such Global Security, pursuant to instructions from its direct or indirect participants or otherwise, shall instruct the Trustee in writing; provided, however, that no definitive Bearer Security shall be delivered Page 27
in exchange for a temporary Global Security other than in accordance with the provisions of Sections 3.03 and 3.04. All Securities issued upon any registration of transfer or exchange of Securities shall be the valid obligations of the Company, evidencing the same debt, and entitled to the same benefits under this Indenture, as the Securities surrendered upon such registration of transfer or exchange. Every Security presented or surrendered for registration of transfer or exchange shall (if so required by the Company or the Security Registrar) be duly endorsed, or be accompanied by a written instrument of transfer in form satisfactory to the Company and the Security Registrar duly executed, by the Holder thereof or his attorney duly authorized in writing. Unless otherwise provided in the Securities to be registered for transfer or exchanged, no service charge shall be made for any registration of transfer or exchange of Securities, but the Company may (unless otherwise provided in such Securities) require payment of a sum sufficient to cover any tax or other governmental charge that may be imposed in connection with any registration of transfer or exchange of Securities, other than exchanges expressly provided in this Indenture to be made at the Company's own expense or without expense or without charge to Holders. Neither the Company, the Security Registrar nor any Co-Security Registrar shall be required (i) to issue, register the transfer of or exchange any Securities of any series during a period beginning at the opening of business 15 days before the day of selection of Securities of such series to be redeemed and ending at the close of business on (A) if Securities of the series are issuable only as Registered Securities, the day of the mailing of the relevant notice of redemption of Registered Securities of such series so selected for redemption or (B) if Securities of the series are issuable as Bearer Securities, the day of the first publication of the relevant notice of redemption or, if Securities of the series are also issuable as Registered Securities and there is no publication, the mailing of the relevant notice of redemption, or (ii) to register the transfer or exchange of any Securities or portions thereof so selected for redemption. Notwithstanding anything herein to the contrary, the exchange of Bearer Securities into Registered Securities shall be subject to applicable laws and regulations in effect at the time of exchange; none of the Company, the Trustee nor the Security Registrar shall exchange any Bearer Securities into Registered Securities if it has received an Opinion of Counsel that as a result of such exchanges the Company would suffer adverse consequences under the United States federal income tax laws and regulations then in effect and the Company has delivered to the Trustee a Company Order directing the Trustee not to make such exchanges unless and until the Trustee receives a subsequent Company Order to the contrary. The Company shall deliver copies of such Company Orders to the Security Registrar. SECTION 3.06. Mutilated, Destroyed, Lost and Stolen Securities. If (i) any mutilated Security or Security with a mutilated coupon is surrendered to the Trustee or the Security Registrar, or if the Company, the Trustee and the Security Registrar receive evidence to their satisfaction of the destruction, loss or theft of any Security or coupon and (ii) there is delivered to the Company, the Trustee and the Security Registrar such security or indemnity as may be required by them to save each of them harmless, then, in the absence of notice to the Company, the Trustee or the Security Registrar that such Security has been acquired by a bona fide purchaser, the Company shall execute and upon its request the Trustee shall authenticate and deliver, in lieu of any such mutilated, destroyed, lost or stolen Security or in exchange for the Security to which a mutilated, destroyed, lost or stolen coupon appertains (with all appurtenant coupons not mutilated, destroyed, lost or stolen), a new Security of the same series and Stated Maturity and of like tenor and principal amount, bearing a number not contemporaneously outstanding and, if applicable, with coupons corresponding to the coupons appertaining thereto; provided, however, that any new Bearer Security will be delivered only in compliance with the conditions set forth in Section 3.05. In case any such mutilated, destroyed, lost or stolen Security or coupon has become or is about to become due and payable, the Company in its discretion may, instead of issuing a new Security, pay such Security; provided, however, that payment of principal of (and premium, if any) and any interest on Bearer Securities shall be payable only at an office or agency located outside the United States, and, in the case of interest, unless otherwise specified as contemplated by Section 3.01, only upon presentation and surrender of the coupons appertaining thereto. Upon the issuance of any new Security under this Section, the Company may require the payment of a sum sufficient to cover any tax or other governmental charge that may be imposed in relation thereto and any other expenses (including the fees and expenses of the Trustee) connected therewith. Every new Security of any series, with its coupons, if any, issued pursuant to this Section in lieu of any destroyed, lost or stolen Security, or in exchange for a Security with a destroyed, lost or stolen coupon, shall constitute an original additional contractual obligation of the Company, whether or not the destroyed, lost or stolen Security and its coupons, if any, or the destroyed, lost or stolen coupon shall be at any time enforceable by anyone, and shall be entitled to all the benefits of this Indenture equally and proportionately with any and all other Securities of the same series and their coupons, if any, duly issued hereunder. The provisions of this Section are exclusive and shall preclude (to the extent lawful) all other rights and remedies with respect to the Page 28
replacement or payment of mutilated, destroyed, lost or stolen Securities or coupons. SECTION 3.07. Payment of Interest; Interest Rights Preserved. Unless otherwise provided as contemplated by Section 3.01, interest on any Registered Security which is payable, and is punctually paid or duly provided for, on any Interest Payment Date shall unless otherwise provided in such Security be paid to the Person in whose name that Security (or one or more Predecessor Securities) is registered at the close of business on the Regular Record Date for such interest. Unless otherwise specified as contemplated by Section 3.01, in case a Bearer Security of any series is surrendered in exchange for a Registered Security of such series after the close of business (at an office or agency referred to in Section 3.05) on any Regular Record Date and before the opening of business (at such office or agency) on the next succeeding Interest Payment Date, such Bearer Security shall be surrendered without the coupon relating to such Interest Payment Date and interest will not be payable on such Interest Payment Date in respect of the Registered Security issued in exchange for such Bearer Security, but will be payable only to the Holder of such coupon when due in accordance with the provisions of this Indenture. At the option of the Company, payment of interest on any Registered Security may be made by check in the currency designated for such payment pursuant to the terms of such Registered Security mailed to the address of the Person entitled thereto as such address shall appear in the Security Register or by wire transfer to an account in such currency designated by such Person in writing not later than ten days prior to the date of such payment. Any interest on any Registered Security which is payable, but is not punctually paid or duly provided for, on any Interest Payment Date (herein called "Defaulted Interest") shall forthwith cease to be payable to the Holder on the relevant Regular Record Date by virtue of his having been such Holder, and such Defaulted Interest may be paid by the Company, at its election in each case, as provided in clause (i) or clause (ii) below. (i) The Company may elect to make payments of any Defaulted Interest to the Persons in whose names any such Registered Securities (or their respective Predecessor Securities) are registered at the close of business on a Special Record Date for the payment of such Defaulted Interest, which shall be fixed in the following manner. The Company shall notify the Trustee in writing of the amount of Defaulted Interest proposed to be paid on each Registered Security and the date of the proposed payment, and at the same time the Company shall deposit with the Trustee an amount of money equal to the aggregate amount proposed to be paid in respect of such Defaulted Interest or shall make arrangements satisfactory to the Trustee for such deposit prior to the date of the proposed payment, such money when deposited to be held in trust for the benefit of the Persons entitled to such Defaulted Interest as in this clause provided. Thereupon the Trustee shall fix a Special Record Date for the payment of such Defaulted Interest which shall be not more than 15 nor less than 10 days prior to the date of the proposed payment and not less than 10 days after the receipt by the Trustee of the notice of the proposed payment. The Trustee shall promptly notify the Company of such Special Record Date and, in the name and at the expense of the Company, shall cause notice of the proposed payment of such Defaulted Interest and the Special Record Date therefor to be mailed, first class, postage prepaid, to each Holder at his address as it appears in the Security Register, not less than 10 days prior to such Special Record Date. Notice of the proposed payment of such Defaulted Interest and the Special Record Date therefor having been mailed as aforesaid, such Defaulted Interest shall be paid to the Persons in whose names such Registered Securities (or their respective Predecessor Securities) are registered on such Special Record Date and shall no longer be payable pursuant to the following clause (ii). In case a Bearer Security of any series is surrendered at the office or agency in a Place of Payment for such series in exchange for a Registered Security of such series after the close of business at such office or agency on any Special Record Date and before the opening of business at such office or agency on the related proposed date of payment of Defaulted Interest, such Bearer Security shall be surrendered without the coupon relating to such proposed date for payment and Defaulted Interest will not be payable on such proposed date for payment in respect of the Registered Security issued in exchange for such Bearer Security, but will be payable only to the Holder of such coupon when due in accordance with the provisions of this Indenture. (ii) The Company may make payment of any Defaulted Interest in any other lawful manner not inconsistent with the requirements of any securities exchange on which the Securities with respect to which there exists such default may be listed, and upon such notice as may be required by such exchange, if, after notice given by the Company to the Trustee of the proposed payment pursuant to this clause, such payment shall be deemed practicable by the Trustee. Subject to the foregoing provisions of this Section, each Security delivered under this Indenture upon registration of transfer of, or in exchange for, or in lieu of, any other Security shall carry the rights to interest accrued and unpaid, and to accrue, which were carried by such other Security. Subject to the limitations set forth in Section 5.02, the Holder of any coupon appertaining to a Bearer Security shall be entitled to receive the interest payable on such coupon upon presentation and surrender of such coupon on or after the Interest Payment Date of such coupon at an office or agency maintained for such purpose pursuant to Section 5.02. SECTION 3.08. Persons Deemed Owners. Title to any Bearer Security, any coupons appertaining thereto and any temporary Global Security shall pass by delivery. Prior to due presentment for registration of transfer of any Registered Security, the Company, the Trustee and any agent of the Company or the Trustee may treat the Person in whose name such Security is registered as the owner of such Security for the purpose of receiving payment of principal of, premium, if any, and (subject to Section 3.07) interest on such Security, and for all purposes Page 29
whatsoever, whether or not such Security be overdue, and neither the Company, the Trustee nor any agent of the Company or the Trustee shall be affected by notice to the contrary. The Company, the Trustee and any agent of the Company or the Trustee may treat the bearer of any Bearer Security and the bearer of any coupon as the absolute owner of such Security or coupon for the purpose of receiving payment thereof or on account thereof and for all other purposes whatsoever whether or not such Security or coupon be overdue, and neither the Company, the Trustee nor any agent of the Company or the Trustee shall be affected by notice to the contrary. None of the Company, the Trustee, any Paying Agent, any Authenticating Agent or the Security Registrar will have the responsibility or liability for any aspect of the records relating to or payments made on account of beneficial ownership interest of a Global Security or for maintaining, supervising or reviewing any records relating to such beneficial ownership interest, and they shall be fully protected in acting or refraining from acting on any such information provided by the Depositary. SECTION 3.09. Cancellation. Unless otherwise provided with respect to a series of Securities, all Securities and coupons surrendered for payment, registration of transfer, exchange, repayment or redemption shall, if surrendered to any Person other than the Trustee, be delivered to the Trustee. All Securities so delivered or surrendered directly to the Trustee for any such purpose shall be promptly cancelled by it. The Company may at any time deliver to the Trustee for cancellation any Securities previously authenticated and delivered hereunder which the Company may have acquired in any manner whatsoever, and all Securities so delivered shall be promptly cancelled by the Trustee. No Securities shall be authenticated in lieu of or in exchange for any Securities cancelled as provided in this Section, except as expressly permitted by this Indenture or such Securities. All cancelled Securities or coupons held by the Trustee shall be disposed of by the Trustee in accordance with its customary procedures and the Trustee shall deliver a certificate of such disposition to the Company. SECTION 3.10. Computation of Interest. Interest on the Securities of each series shall be computed as shall be specified as contemplated by Section 3.01. SECTION 3.11. Form of Certification. Unless otherwise provided pursuant to Section 3.01: (i) Whenever any provision of this Indenture or the forms of Securities contemplate that certification be given by a Person entitled to receive a Bearer Security, such certification shall be provided substantially in the form of Exhibit A hereto, with only such changes as shall be approved by the Company. (ii) Whenever any provision of this Indenture or the forms of Securities contemplate that certification be given by Euroclear and CEDEL S.A. in connection with the exchange of a portion of a temporary Global Security, such certification shall be provided substantially in the form of Exhibit B hereto, with only such changes as shall be approved by the Company. (iii) Whenever any provision of the Indenture or the forms of Securities contemplate that certification be given by Euroclear and CEDEL S.A. in connection with payment of interest with respect to a temporary Global Security prior to the related Global Exchange Date, such certification shall be provided substantially in the form of Exhibit C hereto, with only such changes as shall be approved by the Company. (iv) Whenever any provision of the Indenture or the forms of Securities contemplate that certification be given by a beneficial owner of a portion of a temporary Global Security in connection with payment of interest with respect to a temporary Global Security prior to the related Global Exchange Date, such certification shall be provided substantially in the form of Exhibit D hereto, with only such changes as shall be approved by the Company. SECTION 3.12. Judgments. The Company may provide, pursuant to Section 3.01, for the Securities of any series that, to the fullest extent possible under applicable law and except as may otherwise be specified as contemplated in Section 3.01, (a) the obligation, if any, of the Company to pay the principal of (and premium, if any) and interest on the Securities of any series and any appurtenant coupons in a Foreign Currency, composite currency or Dollars (the "Designated Currency") as may be specified pursuant to Section 3.01 is of the essence and agrees that judgments in respect of such Securities shall be given in the Designated Currency; (b) the obligation of the Company to make payments in the Designated Currency of the principal of (and premium, if any) and interest on such Securities and any appurtenant coupons shall, notwithstanding any payment in any other currency (whether pursuant to a judgment or otherwise), be discharged only to the extent of the amount in the Designated Currency that the Holder receiving such payment may, in accordance with normal banking procedures, purchase with the sum paid in such other currency (after any premium and cost of exchange) in the country of issue of the Designated Currency in the case of Foreign Currency or Dollars or in the international banking community in the case of a composite currency on the Business Day immediately following the day on which such Holder receives such payment; (c) if the amount in the Designated Currency that may be so purchased for any reason falls short of the amount originally due, the Company shall pay such additional amounts as may be necessary to compensate for such shortfall; and (d) any obligation of the Company not discharged by such payment shall be due as a separate and independent obligation and, until discharged as provided herein, shall continue in full force and effect. Page 30
SECTION 3.13 CUSIP Numbers. The Company in issuing the Securities may use "CUSIP" numbers or Euroclear or CEDEL reference numbers (if then generally in use), and if, so, the Trustee shall use such numbers in notices of redemption or other related material as a convenience to Holders; provided that any such notice or other related material may state that no representation is made as to the correctness of such numbers either as printed on the Securities or as contained in any notice of redemption or other related material and that reliance may be placed only on the other identification numbers printed on the Securities, and any such redemption shall not be affected by any defect in or omission of such numbers. ARTICLE FOUR REDEMPTION OF SECURITIES SECTION 4.01. Applicability of Article. Securities of any series which are redeemable before their Stated Maturity shall be redeemable in accordance with their terms and, except as otherwise specified as contemplated by Section 3.01 for Securities of any series, in accordance with this Article. SECTION 4.02. Election To Redeem; Notice to Trustee. The election of the Company to redeem any Securities redeemable at the option of the Company shall be evidenced by an Officers' Certificate. In case of any redemption at the election of the Company of the Securities of any series, the Company shall, at least 60 days prior to the Redemption Date fixed by the Company (unless a shorter notice shall be satisfactory to the Trustee), notify the Trustee and the Security Registrar of such Redemption Date and of the principal amount of Securities of such series to be redeemed. In the case of any redemption of Securities (i) prior to the expiration of any restriction on such redemption provided in the terms of such Securities or elsewhere in this Indenture, or (ii) pursuant to an election of the Company which is subject to a condition specified in the terms of such Securities, the Company shall furnish the Trustee with an Officers' Certificate evidencing compliance with such restriction or condition. SECTION 4.03. Selection by Security Registrar of Securities To Be Redeemed. If less than all the Securities of any series with the same terms are to be redeemed, the particular Securities to be redeemed shall be selected not more than 60 days prior to the Redemption Date by the Security Registrar from the Outstanding Securities of such series having such terms not previously called for redemption, by such method as the Security Registrar shall deem fair and appropriate and which may provide for the selection for redemption of portions of the principal amount of Securities of such series of a denomination equal to or larger than the minimum authorized denomination for Securities of such series. Unless otherwise provided by the terms of the Securities of any series so selected for partial redemption, the portions of the principal of Securities of such series so selected for partial redemption shall be, in the case of Registered Securities, equal to $1,000 or an integral multiple thereof or, in the case of Bearer Securities, equal to $5,000 or an integral multiple thereof, and the principal amount of any such Security which remains outstanding shall not be less than the minimum authorized denomination for Securities of such series. The Security Registrar shall promptly notify the Company, the Trustee and the Co-Security Registrar, if any, in writing of the Securities selected for redemption and, in the case of any Security selected for partial redemption, the principal amount thereof to be redeemed. For all purposes of this Indenture, unless the context otherwise requires, all provisions relating to the redemption of Securities shall relate, in the case of any Security redeemed or to be redeemed only in part, to the portion of the principal of such Security which has been or is to be redeemed. SECTION 4.04. Notice of Redemption. Notice of redemption shall be given in the manner provided in Section 1.06, not less than 30 nor more than 60 days prior to the Redemption Date, to each Holder of Securities to be redeemed. All notices of redemption shall state: (i) the Redemption Date; (ii) the Redemption Price; (iii) if less than all Outstanding Securities of any series having the same terms are to be redeemed, the identification (and, in the case of partial redemption, the respective principal amounts) of the particular Securities to be redeemed; (iv) that on the Redemption Date the Redemption Price will become due and payable upon each such Security to be redeemed, and that interest, if any, thereon shall cease to accrue on and after said date; (v) the place or places where such Securities, together in the case of Bearer Securities with all remaining coupons appertaining thereto, if any, maturing after the Redemption Date, are to be surrendered for payment of the Redemption Price; (vi) that the redemption is for a sinking fund, if such is the case; and Page 31
(vii) the CUSIP number or the Euroclear or the CEDEL reference number (or any other number used by a Depositary to identify such Securities), if any, of the Securities to be redeemed. A notice of redemption published as contemplated by Section 1.06(2) need not identify particular Registered Securities to be redeemed. Notice of redemption of Securities to be redeemed at the election of the Company shall be given by the Company or, on Company Request, by the Trustee in the name and at the expense of the Company. SECTION 4.05. Deposit of Redemption Price. At or prior to the opening of business on any Redemption Date, the Company shall deposit or cause to be deposited with the Trustee or with a Paying Agent (or, if the Company is acting as its own Paying Agent, segregate and hold in trust as provided in Section 5.03) an amount of money sufficient to pay the Redemption Price of all the Securities which are to be redeemed on that date; provided, however, that deposits with respect to Bearer Securities shall be made with a Paying Agent or Paying Agents located outside the United States except as otherwise provided in Section 5.02, unless otherwise specified as contemplated by Section 3.01. SECTION 4.06. Securities Payable on Redemption Date. Notice of redemption having been given as aforesaid, the Securities so to be redeemed shall, on the Redemption Date, become due and payable at the Redemption Price therein specified and from and after such date (unless the Company shall default in the payment of the Redemption Price) such Securities shall cease to bear interest and the coupons for such interest appertaining to any Bearer Securities so to be redeemed, except to the extent provided below, shall be void. Upon surrender of any such Securities for redemption in accordance with said notice, such Securities shall be paid by the Company at the Redemption Price; provided, however, that installments of interest on Bearer Securities whose Stated Maturity is on or prior to the Redemption Date shall be payable only at an office or agency located outside the United States and, unless otherwise specified as contemplated by Section 3.01, only upon presentation and surrender of coupons for such interest. Installments of interest on Registered Securities whose Stated Maturity is on or prior to the Redemption Date shall be payable to the Holders of such Securities, or one or more Predecessor Securities, registered as such on the close of business on the relevant Regular Record Dates according to their terms and the provisions of Section 3.07. If any Bearer Security surrendered for redemption shall not be accompanied by all appurtenant coupons maturing after the Redemption Date, such Security may be paid after deducting from the Redemption Price an amount equal to the face amount of all such missing coupons, or the surrender of such missing coupon or coupons may be waived by the Company and the Trustee if there be furnished to them such security or indemnity as they may require to save each of them and any Paying Agent harmless. If thereafter the Holder of such Security shall surrender to the Trustee or any Paying Agent any such missing coupon in respect of which a deduction shall have been made from the Redemption Price, such Holder shall be entitled to receive the amount so deducted; provided, however, that interest represented by coupons shall be payable only at an office or agency located outside the United States and, unless otherwise specified as contemplated by Section 3.01, only upon presentation and surrender of those coupons. If any Security called for redemption shall not be paid upon surrender thereof for redemption, the principal shall, until paid, bear interest from the Redemption Date at the rate borne by such Security, or as otherwise provided in such Security. SECTION 4.07. Securities Redeemed in Part. Any Security which is to be redeemed only in part shall be surrendered at the office or agency of the Company in a Place of Payment therefor (with, if the Company or the Security Registrar so requires, due endorsement by, or a written instrument of transfer in form satisfactory to the Company and the Security Registrar duly executed by, the Holder of such Security or his attorney duly authorized in writing), and the Company shall execute, and the Trustee shall authenticate and deliver to the Holder of such Security without service charge, a new Security or Securities of the same series and Stated Maturity, containing identical terms and conditions, of any authorized denominations as requested by such Holder, in aggregate principal amount equal to and in exchange for the unredeemed portion of the principal of the Security so surrendered. SECTION 4.08. Redemption Suspended During Event of Default. The Trustee shall not redeem any Securities (unless all Securities then Outstanding are to be redeemed) or commence the giving of any notice of redemption of Securities during the continuance of any Event of Default known to the Trustee, except that where the giving of notice of redemption of any Securities shall theretofore have been made, the Trustee shall, subject to the provisions of Section 14.04, redeem such Securities, provided funds are deposited with it for such purpose. Subject to the rights of the holders of Senior Indebtedness and creditors in respect of General Obligations, except as aforesaid, any moneys theretofore or thereafter received by the Trustee shall, during the continuance of such Event of Default, be held in trust for the benefit of the Holders and applied in the manner set forth in Section 7.06; provided, however, that in case such Event of Default shall have been waived as provided herein or otherwise cured, such moneys shall thereafter be held and applied in accordance with the provisions of this Article. Page 32
ARTICLE FIVE COVENANTS SECTION 5.01. Payment of Principal, Premium and Interest. The Company covenants and agrees for the benefit of each series of Securities that it will duly and punctually pay the principal of, premium, if any, and interest on the Securities of such series in accordance with the terms of the Securities of such series, any coupons appertaining thereto and this Indenture. Unless otherwise specified as contemplated by Section 3.01 with respect to any series of Securities, any interest due on Bearer Securities on or before Maturity shall be payable only outside the United States upon presentation and surrender of the several coupons for such interest installments as are evidenced thereby as they severally mature. SECTION 5.02. Maintenance of Office or Agency. If Securities of a series are issuable only as Registered Securities, the Company will maintain in each Place of Payment for any series of Securities an office or agency where Securities of that series may be presented or surrendered for payment, where Securities of that series may be surrendered for registration of transfer or exchange and where notices and demands to or upon the Company in respect of the Securities of that series and this Indenture may be served. The Company will give prompt written notice to the Trustee of the location, and of any change in the location, of such office or agency. If Securities of a series may be issuable as Bearer Securities, the Company will maintain (A) in the Borough of Manhattan, the City of New York an office or agency where any Registered Securities of that series may be presented or surrendered for payment, where any Registered Securities of that series may be surrendered for registration of transfer, where Securities of that series may be surrendered for exchange and where notices and demands to or upon the Company in respect of the Securities of that series and this Indenture may be served, (B) subject to any laws or regulations applicable thereto, in a Place of Payment for that series which is located outside the United States, an office or agency where Securities of that series and related coupons may be presented and surrendered for payment (including payment of any additional amounts payable on Securities of that series pursuant to Section 5.04); provided, however, that if the Securities of that series are listed on The International Stock Exchange of the United Kingdom and the Republic of Ireland Limited or the Luxembourg Stock Exchange or any other stock exchange located outside the United States and such stock exchange shall so require, the Company will maintain a Paying Agent for the Securities of that series in London or Luxembourg or any other required city located outside the United States, as the case may be, so long as the Securities of that series are listed on such exchange, and (C) subject to any laws or regulations applicable thereto, in a Place of Payment for such series located outside the United States an office or agency where any Registered Securities of that series may be surrendered for registration of transfer, where Securities of that series may be surrendered for exchange and where notices and demands to or upon the Company in respect of the Securities of that series and this Indenture may be served. The Company will give prompt written notice to the Trustee of the location, and any change in the location, of any such office or agency. If at any time the Company shall fail to maintain any such required office or agency in respect of any series of Securities or shall fail to furnish the Trustee with the address thereof, such presentations, and surrenders of Securities of that series may be made and notices and demands may be made or served at the Principal Corporate Trust Office of the Trustee, except that Bearer Securities of that series and the related coupons may be presented and surrendered for payment (including payment of any additional amounts payable on Bearer Securities of that series pursuant to Section 5.04) at the place specified for the purpose as contemplated by Section 3.01, and the Company hereby appoints the Trustee as its agent to receive such respective presentations, surrenders, notices and demands. Except as otherwise provided in the form of Bearer Security of any particular series pursuant to the provisions of this Indenture, no payment of principal, premium or interest on Bearer Securities shall be made at any office or agency of the Company in the United States or by check mailed to any address in the United States or by transfer to an account maintained with a bank located in the United States; provided, however, payment of principal of and any premium and interest denominated in Dollars (including additional amounts payable in respect thereof) on any Bearer Security may be made at an office or agency of, and designated by, the Company located in the United States if (but only if) payment of the full amount of such principal, premium, interest or additional amounts in Dollars at all offices outside the United States maintained for the purpose by the Company in accordance with this Indenture is illegal or effectively precluded by exchange controls or similar restrictions and the Trustee receives an Opinion of Counsel that such payment within the United States is legal. Unless otherwise provided as contemplated by Section 3.01 with respect to any series of Securities, at the option of the Holder of any Bearer Security or related coupon, payment may be made by check in the currency designated for such payment pursuant to the terms of such Bearer Security presented or mailed to an address outside the United States or by transfer to an account in such currency maintained by the payee with a bank located outside the United States. The Company may also from time to time designate one or more other offices or agencies where the Securities of one or more series may be presented or surrendered for any or all of such purposes specified above in this Section and may constitute and appoint one or more Paying Agents for the payment of such Securities, in one or more other cities, and may from time to time rescind such designations and appointments; provided, however, that no such designation, appointment or rescission shall in any manner relieve the Company of its obligation to maintain an office or agency in each Place of Payment for Securities of any series for such purposes. The Company will give prompt written notice to the Trustee of any such designation or rescission and of any change in the location of any such other office or agency. Unless and until the Company rescinds one or more such appointments, the Company hereby appoints The Chase Manhattan Bank, as its Paying Agent in the City of New York with respect to all series of Securities having a Place of Payment in the City of New York. Page 33
SECTION 5.03. Money for Security Payments To Be Held in Trust. If the Company shall at any time act as its own Paying Agent for any series of Securities, it will, on or before each due date of the principal of, premium, if any, or interest on any of the Securities of such series and any appurtenant coupons, segregate and hold in trust for the benefit of the Persons entitled thereto a sum sufficient to pay the principal, premium or interest so becoming due until such sums shall be paid to such Persons or otherwise disposed of as herein provided, and will promptly notify the Trustee of its action or failure so to act. Whenever the Company shall have one or more Paying Agents for any series of Securities, it will, at or prior to the opening of business on each due date of the principal of, premium, if any, or interest on any Securities of such series and any appurtenant coupons, deposit with a Paying Agent a sum sufficient to pay the principal, premium or interest so becoming due, such sum to be held in trust for the benefit of the Persons entitled to such principal, premium or interest, and (unless such Paying Agent is the Trustee) the Company will promptly notify the Trustee of its action or failure so to act. The Company will cause each Paying Agent other than the Trustee for any series of Securities to execute and deliver to the Trustee an instrument in which such Paying Agent shall agree with the Trustee subject to the provisions of this Section, that such Paying Agent will: (i) hold all sums held by it for the payment of principal of, premium, if any, or interest on Securities of such series and any appurtenant coupons in trust for the benefit of the Persons entitled thereto until such sums shall be paid to such Persons or otherwise disposed of as herein provided; (ii) give the Trustee notice of any default by the Company (or any other obligor upon the Securities of such series) in the making of any payment of principal, premium or interest on the Securities of such series or any appurtenant coupons; and (iii) at any time during the continuance of any such default, upon the written request of the Trustee, forthwith pay to the Trustee all sums so held in trust by such Paying Agent. The Company may at any time, for the purpose of obtaining the satisfaction and discharge of this Indenture or for any other purpose, pay, or by Company Order direct any Paying Agent to pay, to the Trustee all sums held in trust by the Company or such Paying Agent, such sums to be held by the Trustee upon the same trusts as those upon which such sums were held by the Company or such Paying Agent, and, upon such payments by any Paying Agent to the Trustee, such Paying Agent shall be released from all further liability with respect to such money. Any money deposited with the Trustee or any Paying Agent, or then held by the Company, in trust for the payment of the principal of, premium, if any, or interest on any Security of any series or any appurtenant coupons and remaining unclaimed for two years after such principal, premium or interest has become due and payable shall be paid to the Company on Company Request, or (if then held by the Company) shall be discharged from such trust, and the Holder of such Security or any coupon appertaining thereto shall thereafter, as an unsecured general creditor, look only to the Company for payment thereof, and all liability of the Trustee or such Paying Agent with respect to such trust money, and all liability of the Company as trustee thereof, shall thereupon cease; provided, however, that the Trustee or such Paying Agent, before being required to make any such repayment, may at the expense of the Company cause to be published once, in an Authorized Newspaper in each Place of Payment, notice that such money remains unclaimed and that, after a date specified therein, which shall not be less than 30 days from the date of such publication, any unclaimed balance of such money then remaining will be repaid to the Company. SECTION 5.04. Additional Amounts. If the Securities of a series provide for the payment of additional amounts, the Company will pay to the Holder of any Security of any series or any coupon appertaining thereto additional amounts as provided therein. Whenever in this Indenture there is mentioned, in any context, the payment of the principal of (or premium, if any) or interest on, or in respect of, any Security of any series or payment of any related coupon or the net proceeds received on the sale or exchange of any Security of any series, such mention shall be deemed to include mention of the payment of additional amounts provided for in this Section to the extent that, in such context, additional amounts are, were or would be payable in respect thereof pursuant to the provisions of this Section and express mention of the payment of additional amounts (if applicable) in any provisions hereof shall not be construed as excluding additional amounts in those provisions hereof where such express mention is not made. If the Securities of a series provide for the payment of additional amounts, at least 10 days prior to the first Interest Payment Date with respect to that series of Securities (or if the Securities of that series will not bear interest prior to Maturity, the first day on which a payment of principal (and premium, if any) is made), and at least 10 days prior to each date of payment of principal (and premium, if any) or interest if there has been any change with respect to the matters set forth in the below- mentioned Officers' Certificate, the Company will furnish the Trustee and the Company's Principal Paying Agent or Paying Agents, if other than the Trustee, with an Officers' Certificate instructing the Trustee and such Paying Agent or Paying Agents whether such payment of principal of (and premium, if any) or interest on the Securities of that series shall be made to Holders of Securities of that series or any related coupons who are United States Aliens without withholding for or on account of any tax, assessment or other governmental charge described in the Securities of that series. If any such withholding shall be required, then such Officers' Certificate shall specify by country the amount, if any, required to be withheld on such payments to such Holders of Securities or coupons and the Company will pay to the Page 34
Trustee or such Paying Agent the additional amounts required by this Section. The Company covenants to indemnify the Trustee and any Paying Agent for, and to hold them harmless against, any loss, liability or expense reasonably incurred without negligence or bad faith on their part arising out of or in connection with actions taken or omitted by any of them in reliance on any Officers' Certificate furnished pursuant to this Section. SECTION 5.05. Statement as to Compliance. The Company will deliver to the Trustee, within 120 days after the end of each fiscal year of the Company, an Officers' Certificate (which need not comply with Section 1.02) (provided, however, that one of the signatories of which shall be the Company's principal executive officer, principal financial officer or principal accounting officer) stating, as to each signer thereof, that: (i) a review of the activities of the Company during such year and of performance under this Indenture and under the terms of the Securities has been made under his supervision; and (ii) to the best of his knowledge, based on such review, (a) the Company has fulfilled all its obligations and complied with all conditions and covenants under this Indenture and under the terms of the Securities throughout such year, or, if there has been a default in the fulfillment of any such obligation, condition or covenant specifying each such default known to him and the nature and status thereof, and (b) no event has occurred and is occurring which is, or after notice or lapse of time or both would become, a Default, or if such an event has occurred and is continuing, specifying such event known to him and the nature and status thereof. For purposes of this Section, compliance or default shall be determined without regard to any period of grace or requirement of notice provided for herein. SECTION 5.06. Maintenance of Corporate Existence, Rights and Franchises. So long as any of the Securities shall be Outstanding, the Company will do or cause to be done all things necessary to preserve and keep in full force and effect its corporate existence, rights and franchises to carry on its business; provided, however, that nothing in this Section 5.06 shall (i) require the Company to preserve any such right or franchise if the Board of Directors shall determine that the preservation thereof is no longer desirable in the conduct of the business of the Company and that the loss thereof is not disadvantageous in any material respect to the Holders, (ii) prevent any consolidation or merger of the Company, or any conveyance or transfer of its property and assets substantially as an entirety to any person, permitted by Article Ten, (iii) prevent the liquidation or dissolution of the Company after any conveyance or transfer of its property and assets substantially as an entirety to any person permitted by Article Ten. ARTICLE SIX HOLDERS' LISTS AND REPORTS BY TRUSTEE AND COMPANY SECTION 6.01. Company To Furnish Trustee Names and Addresses of Holders. The Company will furnish or cause to be furnished to the Trustee (i) semiannually, not more than 10 days after each March 1 and September 1, a list, in such form as the Trustee may reasonably require, containing all the information in the possession or control of the Company, any of its Paying Agents (other than the Trustee) or the Security Registrar, if other than the Trustee, as to the names and addresses of the Holders of Securities as of such March 1 and September 1, as the case may be, and (ii) at such other times as the Trustee may request in writing, within 30 days after receipt by the Company of any such request, a list of similar form and content as of a date not more than 15 days prior to the time such list is requested to be furnished; provided, however, that if and so long as the Trustee is the Security Registrar for Securities of a series, no such list need be furnished with respect to such series of Securities. SECTION 6.02. Preservation of Information; Communications to Holders. (i) The Trustee shall preserve, in as current a form as is reasonably practicable, the names and addresses of Holders of Securities contained in the most recent list furnished to the Trustee as provided in Section 6.01 and the names and addresses of Holders of Securities received by the Trustee in its capacity as the Security Registrar, if so acting. The Trustee may destroy any list furnished to it as provided in Section 6.01 upon receipt of a new list so furnished. (ii) If three or more Holders of Securities of any series (hereinafter referred to as "applicants") apply in writing to the Trustee, and furnish to the Trustee reasonable proof that each such applicant has owned a Security of such series for a period of at least six months preceding the date of such application, and such application states that the applicants desire to communicate with other Holders of Securities of such series or with the Holders of all Securities with respect to their rights under this Indenture or under such Securities and is accompanied by a copy of the form of proxy or other communication which such applicants propose to transmit, then the Trustee shall, within five Business Days after the receipt of such application, at its election, either: (a) afford such applicants access to the information preserved at the time by the Trustee in accordance with Section 6.02(i); or (b) inform such applicants as to the approximate number of Holders of Securities of such series or all Securities, as the case may be, whose names and addresses appear in the information preserved at the time by the Trustee in accordance with Section 6.02(i), and as to the approximate cost of mailing to such Holders the form of proxy or other communication, if any, specified in such application. Page 35
If the Trustee shall elect not to afford such applicants access to such information, the Trustee shall, upon the written request of such applicants, mail to each Holder of a Security of such series or all Holders of Securities, as the case may be, whose names and addresses appear in the information preserved at the time by the Trustee in accordance with Section 6.02(i), a copy of the form of proxy or other communication which is specified in such request, with reasonable promptness after a tender to the Trustee of the material to be mailed and of payment, or provision for the payment, of the reasonable expenses of mailing, unless, within five days after such tender, the Trustee shall mail to such applicants and file with the Commission, together with a copy of the material to be mailed, a written statement to the effect that, in the opinion of the Trustee, such mailing would be contrary to the best interests of the Holders of Securities of such series or all Securities, as the case may be, or would be in violation of applicable law. Such written statement shall specify the basis of such opinion. If the Commission, after opportunity for a hearing upon the objections specified in the written statement so filed, shall enter an order refusing to sustain any of such objections or if, after the entry of an order sustaining one or more of such objections, the Commission shall find, after notice and opportunity for hearing, that all the objections so sustained have been met and shall enter an order so declaring, the Trustee shall mail copies of such material to all such Holders of Securities with reasonable promptness after the entry of such order and the renewal of such tender; otherwise, the Trustee shall be relieved of any obligation or duty to such applicants respecting their application. (iii) Every Holder of Securities, by receiving and holding the same, agrees with the Company and the Trustee that neither the Company nor the Trustee shall be held accountable by reason of the disclosure of any such information as to the names and addresses of the Holders of Securities in accordance with Section 6.02(ii), regardless of the source from which such information was derived, and that the Trustee shall not be held accountable by reason of mailing any material pursuant to a request made under Section 6.02(ii). SECTION 6.03. Reports by Trustee. (i) Within 60 days after May l5 of each year commencing with the year 1997, the Trustee shall mail to each Holder reports concerning the Trustee and its action under the Indenture as may be required pursuant to Section 313(a) of the Trust Indenture Act if and to the extent and in the manner provided pursuant thereto. The Trustee shall also comply with the other provisions of Section 313 of the Trust Indenture Act. (ii) Reports pursuant to this Section shall be transmitted by mail (1) to all Holders of Registered Securities, as their names and addresses appear in the Security Register and (2) to such Holders of Bearer Securities as have, within the two years preceding such transmission, filed their names and addresses with the Trustee for that purpose, and (3) except in the cases of reports under Section 313(b)(2) of the Trust Indenture Act, to each Holder of a Security of any series whose name and address appear in the information preserved at the time by the Trustee in accordance with Section 6.02(i). (iii) A copy of each such report shall, at the time of such transmission to Holders, be filed by the Trustee with each securities exchange upon which any Securities are listed, and also with the Commission. The Company will notify the Trustee when any Securities are listed on any securities exchange. SECTION 6.04. Reports by Company. The Company will: (i) file with the Trustee, within 15 days after the Company is required to file the same with the Commission, copies of the annual reports and of the information, documents and other reports (or copies of such portions of any of the foregoing as the Commission may from time to time by rules and regulations prescribe) which the Company may be required to file with the Commission pursuant to Section 13 or Section 15(d) of the Exchange Act; or, if the Company is not required to file information, documents or reports pursuant to either of said Sections, then it will file with the Trustee and the Commission, in accordance with rules and regulations prescribed from time to time by the Commission, such of the supplementary and periodic information, documents and reports which may be required pursuant to Section 13 of the Exchange Act in respect of a security listed and registered on a national securities exchange as may be prescribed from time to time in such rules and regulations; (ii) file with the Trustee and the Commission, in accordance with rules and regulations prescribed from time to time by the Commission, such additional information, documents and reports with respect to compliance by the Company with the conditions and covenants of this Indenture as may be required from time to time by such rules and regulations; and (iii) transmit by mail to Holders of Securities, in the manner and to the extent provided in Section 6.03(ii), within 30 days after the filing thereof with the Trustee, such summaries of any information, documents and reports required to be filed by the Company pursuant to paragraphs (i) and (ii) of this Section as may be required by rules and regulations prescribed from time to time by the Commission. Page 36
ARTICLE SEVEN REMEDIES SECTION 7.01. Events of Default. "Event of Default", with respect to any series of Securities, wherever used herein, means any one of the following events (whatever the reason for such Event of Default and whether it shall be voluntary or involuntary or be effected by operation of law or pursuant to any judgment, decree or order of any court or any order, rule or regulation of any administrative or governmental body), unless it is either inapplicable to a particular series or it is specifically deleted or modified in the supplemental indenture or Board Resolution under which such series of Securities is issued or in the form of Security for such series: (i) the entry of a decree or order by a court having jurisdiction in the premises granting relief in respect of the Company in an involuntary case under the Federal Bankruptcy Code, adjudging the Company a bankrupt, or approving as properly filed a petition seeking reorganization, arrangement, adjustment or composition of or in respect of the Company under the Federal Bankruptcy Code or any other applicable Federal or State bankruptcy, insolvency or similar law, or appointing a receiver, liquidator, custodian, assignee, trustee, sequestrator (or other similar official) of the Company, or of substantially all of its properties, or ordering the winding up or liquidation of its affairs under any such law, and the continuance of any such decree or order unstayed and in effect for a period of 60 consecutive days; or (ii) the institution by the Company of proceedings to be adjudicated a bankrupt, or the consent of the Company to the institution of bankruptcy proceedings against it, or the filing by the Company of a petition or answer or consent seeking reorganization or relief under the Federal Bankruptcy Code or any other applicable Federal or State bankruptcy, insolvency or similar law, or the consent by the Company to the filing of any such petition or to the appointment of a receiver, liquidator, custodian, assignee, trustee, sequestrator (or other similar official) of the Company, or of substantially all of its properties under any such law; or (iii) any other Event of Default provided with respect to Securities of that series. SECTION 7.02. Acceleration of Maturity; Rescission and Annulment. If an Event of Default with respect to any series of Securities for which there are Securities Outstanding occurs and is continuing, then, and in every such case, the Trustee or the Holders of not less than 25% in principal amount of the Outstanding Securities of such series may declare the principal of all the Securities of such series (or, if the Securities of that series are Original Issue Discount Securities, such portion of the principal amount as may be specified in the terms of that series) to be immediately due and payable, by a notice in writing to the Company (and to the Trustee if given by Holders), and upon any such declaration the same shall become immediately due and payable. At any time after such a declaration of acceleration with respect to Securities of any series has been made and before a judgment or decree for payment of the money due has been obtained by the Trustee as hereinafter in this Article provided, the Holders of a majority in principal amount of the Outstanding Securities of such series, by written notice to the Company and the Trustee, may rescind and annul such declaration and its consequences, and any Event of Default giving rise to such declaration shall not be deemed to have occurred, if: (i) the Company has paid or deposited with the Trustee a sum sufficient to pay: (a) all overdue installments of interest on all Securities of such series; (b) the principal of and premium, if any, on any Securities of such series which have become due otherwise than by such declaration of acceleration and interest thereon at the rate or rates prescribed therefor by the terms of the Securities of such series; (c) to the extent that payment of such interest is lawful, interest upon overdue installments of interest at the rate or rates prescribed therefor by the terms of the Securities of such series; and (d) all sums paid or advanced by the Trustee hereunder and the reasonable compensation, expenses, disbursements and advances of the Trustee, the Security Registrar, any Paying Agent, and their agents and counsel and all other amounts due the Trustee under Section 8.07. (ii) all other Defaults with respect to Securities of that series, other than the nonpayment of the principal of Securities of that series which have become due solely by such declaration of acceleration, have been cured or waived as provided in Section 7.13. No such recession shall affect any subsequent default or impair any right consequent thereon. SECTION 7.03. Collection of Indebtedness and Suits for Enforcement by Trustee. The Company covenants that if: (i) default is made in the payment of any installment of interest on any Security of any series when such interest becomes due and Page 37
payable and such default continues for a period of 30 days, or (ii) default is made in the payment of the principal of or premium, if any, on any Security of any series at the Maturity thereof, the Company will, upon demand of the Trustee, pay to it, for the benefit of the Holder of any such Security or coupon appertaining thereto, if any, the whole amount then due and payable on any such Security or coupon for principal, premium, if any, and interest, with interest upon the overdue principal and premium, if any, and (to the extent that payment of such interest shall be lawful) upon overdue installments of interest, at the rate or rates prescribed therefor by the terms of any such Security; and, in addition thereto, such further amount as shall be sufficient to cover the reasonable costs and expenses of collection, including the reasonable compensation, expenses, disbursements and advances of the Trustee, its agents and counsel and any other amounts due the Trustee under Section 8.07. If the Company fails to pay such amounts forthwith upon such demand, the Trustee, in its own name and as trustee of an express trust, may institute a judicial proceeding for the collection of the sums so due and unpaid, and may prosecute such proceeding to judgment or final decree, and may enforce the same against the Company or any other obligor upon such Securities and collect the moneys adjudged or decreed to be payable in the manner provided by law out of the property of the Company or any other obligor upon such Securities, wherever situated. If a Default with respect to any series of Securities occurs and is continuing, the Trustee may in its discretion proceed to protect and enforce its rights and the rights of the Holders of Securities of such series by such appropriate judicial proceedings as the Trustee shall deem most effectual to protect and enforce any such rights, whether for the specific enforcement of any covenant or agreement in this Indenture or in aid of the exercise of any power granted herein, or to enforce any other proper remedy. SECTION 7.04. Trustee May File Proofs of Claim. In case of the pendency of any receivership, insolvency, liquidation, bankruptcy, reorganization, arrangement, adjustment, composition or other judicial proceeding relative to the Company or any other obligor upon the Securities or the property of the Company or of such other obligor or their creditors, the Trustee (irrespective of whether the principal of any Securities shall then be due and payable as therein expressed or by declaration or otherwise and irrespective of whether the Trustee shall have made any demand on the Company for the payment of overdue principal, premium, if any, or interest) shall be entitled and empowered, by intervention in such proceeding or otherwise: (i) to file and prove a claim for the whole amount of principal, premium, if any, and interest owing and unpaid in respect of the Securities and to file such other papers or documents as may be necessary or advisable in order to have the claims of the Trustee (including any claim for the reasonable compensation, expenses, disbursements and advances of the Trustee, its agents and counsel and any other amounts due the Trustee under Section 8.07) and of the Holders allowed in such judicial proceeding; and (ii) to collect and receive any moneys or other property payable or deliverable on any such claims and to distribute the same, and any receiver, assignee, trustee, liquidator, sequestrator or other similar official in any such judicial proceeding is hereby authorized by each Holder to make such payments to the Trustee, and in the event that the Trustee shall consent to the making of such payments directly to the Holders, to pay to the Trustee any amount due to it for the reasonable compensation, expenses, disbursements and advances of the Trustee, its agents and counsel, and any other amounts due the Trustee under Section 8.07. Nothing herein contained shall be deemed to authorize the Trustee to authorize or consent to or accept or adopt on behalf of any Holder of a Security or coupon any plan of reorganization, arrangement, adjustment or composition affecting the Securities or the rights of any Holder thereof, or to authorize the Trustee to vote in respect of the claim of any Holder of a Security or coupon in any such proceeding. SECTION 7.05. Trustee May Enforce Claims Without Possession of Securities. All rights of action and claims under this Indenture or under the Securities of any series, or coupons (if any) appertaining thereto, may be prosecuted and enforced by the Trustee without the possession of any of the Securities of such series or coupons appertaining thereto or the production thereof in any proceeding relating thereto, and any such proceeding instituted by the Trustee shall be brought in its own name as trustee of an express trust, and any recovery of judgment shall, after provision for the payment of the reasonable compensation, expenses, disbursements and advances of the Trustee, its agents and counsel and any other amounts due the Trustee under Section 8.07, be for the ratable benefit of the Holders of the Securities of such series and coupons appertaining thereto in respect of which such judgment has been recovered. SECTION 7.06. Application of Money Collected. Any money collected by the Trustee with respect to a series of Securities pursuant to this Article shall be applied in the following order, at the date or dates fixed by the Trustee, and, in case of the distribution of such money on account of principal, premium, if any, or interest, upon presentation of the Securities of such series or coupons appertaining thereto, if any, or both, as the case may be, and the notation thereon of the payment if only partially paid and upon surrender thereof if fully paid: FIRST: To the payment of all amounts due the Trustee under Section 8.07; Page 38
SECOND: Subject to Article Fourteen, to the payment of the amounts then due and unpaid upon the Securities of such series and coupons for principal, premium, if any, and interest, in respect of which or for the benefit of which such money has been collected, ratably, without preference or priority of any kind, according to the amounts due and payable on Securities of such series and coupons, if any, for principal, premium, if any, and interest, respectively. The Holders of each series of Securities denominated in ECU, any other composite currency or a Foreign Currency and any matured coupons relating thereto shall be entitled to receive a ratable portion of the amount determined by the Exchange Rate Agent by converting the principal amount Outstanding of such series of Securities and matured but unpaid interest on such series of Securities in the currency in which such series of Securities is denominated into Dollars at the Exchange Rate as of the Business Day immediately preceding the date of payment; and THIRD: The balance, if any, to the Person or Persons entitled thereto. SECTION 7.07. Limitation on Suits. No Holder of any Security of any series or any related coupons shall have any right to institute any proceeding, judicial or otherwise, with respect to this Indenture, or for the appointment of a receiver or trustee, or for any other remedy hereunder, unless: (i) such Holder has previously given written notice to the Trustee of a continuing Default with respect to Securities of such series; (ii) the Holders of not less than a majority in principal amount of the Outstanding Securities of such series shall have made written request to the Trustee to institute proceedings in respect of such Default in its own name as Trustee hereunder; (iii) such Holder or Holders have offered to the Trustee reasonable indemnity against the costs, expenses and liabilities to be incurred in compliance with such request; (iv) the Trustee for 60 days after its receipt of such notice, request and offer of indemnity has failed to institute any such proceeding; and (v) no direction inconsistent with such written request has been given to the Trustee during such 60-day period by the Holders of a majority in principal amount of the Outstanding Securities of such series; it being understood and intended that no one or more Holders of Securities of such series shall have any right in any manner whatever by virtue of, or by availing of, any provision of this Indenture to affect, disturb or prejudice the rights of any other Holders of Securities of such series or to obtain or to seek to obtain priority or preference over any other such Holders or to enforce any right under this Indenture, except in the manner herein provided and for the equal and ratable benefit of all the Holders of Securities of such series. The following events shall be "Defaults" with respect to any series of Securities under this Indenture: (a) an Event of Default with respect to such series specified in Section 7.01; or (b) default in the payment of the principal of or premium, if any, on any Security of such series at its Maturity; or (c) default in the payment of any interest upon any Security of such series as and when the same shall become due and payable, and continuance of such default for a period of 30 days; or (d) failure on the part of the Company duly to observe or perform any of the other covenants or agreements on its part in the Securities of such series or in this Indenture (other than a covenant or warranty a default in whose performance or whose breach is elsewhere in this Section specifically dealt with or which has expressly been included in this Indenture solely for the benefit of series of Securities other than that series) and continuance of such failure for a period of 90 days after the date on which written notice of such failure, requiring the Company to remedy the same and stating that such notice is a "Notice of Default" hereunder, shall have been given by registered mail to the Company by the Trustee, or to the Company and the Trustee by the holders of at least 25% in aggregate principal amount of the Securities of such series at the time Outstanding; or (e) any other Default provided with respect to Securities of that Series. SECTION 7.08. Unconditional Right of Holders To Receive Principal, Premium and Interest. Notwithstanding any other provision in this Indenture, the Holder of any Security or coupon shall have the right, which is absolute and unconditional, to receive payment of the principal of, premium, if any, and (subject to Section 3.07) interest on such Security or payment of such coupon on the respective Stated Maturities expressed in such Security or coupon (or, in the case of redemption or repayment on the Redemption Date or Repayment Date) and to institute suit for the enforcement of such payment, and such rights shall not be impaired without the consent of such Holder. SECTION 7.09. Restoration of Rights and Remedies. If the Trustee or any Holder of a Security or coupon has instituted any proceeding to enforce any right or remedy under this Indenture and such proceeding has been discontinued or abandoned for any Page 39
reason, or has been determined adversely to the Trustee or to such Holder, then and in every such case the Company, the Trustee and the Holders shall, subject to any determination in such proceeding, be restored severally and respectively to their former positions hereunder, and thereafter all rights and remedies of the Trustee and the Holders shall continue as though no such proceeding had been instituted. SECTION 7.10. Rights and Remedies Cumulative. Except as otherwise provided with respect to the replacement or payment of mutilated, lost, destroyed or stolen Securities or coupons in the last paragraph of Section 3.06, no right or remedy herein conferred upon or reserved to the Trustee or to the Holders is intended to be exclusive of any other right or remedy, and every right and remedy shall, to the extent permitted by law, be cumulative and in addition to every other right and remedy given hereunder or now or hereafter existing at law or in equity or otherwise. The assertion or employment of any right or remedy hereunder, or otherwise, shall not prevent the concurrent assertion or employment of any other appropriate right or remedy. SECTION 7.11. Delay or Omission Not Waiver. No delay or omission of the Trustee or of any Holder of any Security or coupon to exercise any right or remedy accruing upon any Default shall impair any such right or remedy or constitute a waiver of any such Default or an acquiescence therein. Every right and remedy given by this Article or by law to the Trustee or to the Holders may be exercised from time to time, and as often as may be deemed expedient, by the Trustee or by the Holders, as the case may be. SECTION 7.12. Control by Holders. The Holders of a majority in principal amount of the Outstanding Securities of any series shall have the right to direct the time, method and place of conducting any proceeding for any remedy available to the Trustee or exercising any trust or power conferred on the Trustee with respect to the Securities of such series; provided that (i) such direction shall not be in conflict with any rule of law or with this Indenture, (ii) the Trustee shall not determine that the action so directed would be unjustly prejudicial to the Holders not taking part in such direction, (iii) subject to the provisions of Section 8.01, the Trustee shall have the right to decline to follow any such direction if the Trustee in good faith shall, by a Responsible Officer or Officers of the Trustee, determine that the proceeding so directed would involve the Trustee in personal liability, and (iv) the Trustee may take any other action deemed proper by the Trustee which is not inconsistent with such direction. SECTION 7.13. Waiver of Past Defaults. The Holders of a majority in principal amount of the Outstanding Securities of any series may on behalf of the Holders of all the Securities of such series waive any past default hereunder and its consequences, except a default not theretofore cured (i) in the payment of the principal of, premium, if any, or interest on any Security of such series, or (ii) in respect of a covenant or provision hereof which under Article Nine cannot be modified or amended without the consent of the Holder of each Outstanding Security of such series affected. Upon any such waiver, such default shall cease to exist, and any Default or Event of Default arising therefrom shall be deemed to have been cured, for every purpose of the Securities of such series under this Indenture; but no such waiver shall extend to any subsequent or other default or impair any right consequent thereon. SECTION 7.14. Undertaking for Costs. All parties to this Indenture agree, and each Holder of any Security by his acceptance thereof shall be deemed to have agreed, that any court may in its discretion require, in any suit for the enforcement of any right or remedy under this Indenture, or in any suit against the Trustee for any action taken, suffered or omitted by it as Trustee, the filing by any party litigant in such suit of an undertaking to pay the costs of such suit, and that such court may in its discretion assess reasonable costs, including reasonable attorneys' fees, against any party litigant in such suit, having due regard to the merits and good faith of the claims or defenses made by such party litigant; but the provisions of this Section shall not apply to any suit instituted by the Company, to any suit instituted by the Trustee, to any suit instituted by any Holder, or group of Holders, holding in the aggregate more than 10% in principal amount of the Outstanding Securities of any series, or to any suit instituted by any Holder of Securities or coupons for the enforcement of the payment of the principal of, premium, if any, or interest on any Security or payment of any coupon on or after the respective Stated Maturities expressed in such Security or coupon (or, in the case of redemption or repayment, on or after the Redemption Date or Repayment Date). SECTION 7.15. Waiver of Stay or Extension Laws. The Company covenants (to the extent that it may lawfully do so) that it will not at any time insist upon, or plead, or in any manner whatsoever claim or take the benefit or advantage of, any stay or extension law wherever enacted, now or at any time hereafter in force, which may affect the covenants or the performance of this Indenture; and the Company (to the extent that it may lawfully do so) hereby expressly waives all benefit or advantage of any such law, and covenants that it will not hinder, delay or impede the execution of any power herein granted to the Trustee, but will suffer and permit the execution of every such power as though no such law had been enacted. Page 40
ARTICLE EIGHT THE TRUSTEE SECTION 8.01. Certain Duties and Responsibilities. (i) Except during the continuance of a Default with respect to any series of Securities: (a) the Trustee undertakes to perform such duties and only such duties as are specifically set forth in this Indenture with respect to Securities of such series, and no implied covenants or obligations shall be read into this Indenture against the Trustee with respect to such series; and (b) in the absence of bad faith on its part, the Trustee may conclusively rely with respect to such series, as to the truth of the statements and the correctness of the opinions expressed therein, upon certificates or opinions furnished to the Trustee and conforming to the requirements of this Indenture; but in the case of any such certificate or opinions which by any provision hereof are specifically required to be furnished to the Trustee, the Trustee shall be under a duty to examine the same to determine whether or not they conform as to form to the requirements of the Indenture. (ii) In case a Default with respect to any series of Securities has occurred and is continuing, the Trustee shall exercise such of the rights and powers vested in it by this Indenture with respect to such series, and use the same degree of care and skill in their exercise, as a prudent person would exercise or use under the circumstances in the conduct of his or her own affairs. (iii) No provision of this Indenture shall be construed to relieve the Trustee from liability for its own negligent action, its own negligent failure to act, or its own wilful misconduct, except that (a) this Subsection shall not be construed to limit the effect of Subsection (i) of this Section; (b) the Trustee shall not be liable for any error or judgment made in good faith by a Responsible Officer, unless it shall be proved that the Trustee was negligent in ascertaining the pertinent facts; and (c) the Trustee shall not be liable with respect to any action taken, suffered or omitted to be taken by it in good faith in accordance with the direction of the Holders of a majority in principal amount of the Outstanding Securities of any series relating to the time, method and place of conducting any proceeding for any remedy available to the Trustee, or exercising any trust or power conferred upon the Trustee, under this Indenture with respect to Securities of such series. (d) No provision of this Indenture shall require the Trustee to expend or risk its own funds or otherwise incur any financial liability in the performance of any of its duties hereunder, or in the exercise of any of its rights or powers, if it shall have reasonable grounds for believing that repayment of such funds or adequate indemnity against such risk or liability is not reasonably assured to it. (iv) Whether or not therein expressly so provided, every provision of this Indenture relating to the conduct or affecting the liability of or affording protection to the Trustee shall be subject to the provisions of this Section. SECTION 8.02. Notice of Default. Within 90 days after the occurrence of any Default hereunder with respect to Securities of any series, the Trustee shall transmit by mail to all Holders of Securities of such series entitled to receive reports pursuant to Section 6.03(ii) notice of such default hereunder known to the Trustee, unless such default shall have been cured or waived; provided, however, that, except in the case of a default in the payment of the principal of, premium, if any, or interest on any Security of such series, or any related coupons or in the payment of any sinking fund installment with respect to Securities of such series the Trustee shall be protected in withholding such notice if and so long as the board of directors, the executive committee or a trust committee of directors and/or Responsible Officers of the Trustee in good faith determines that the withholding of such notice is in the interests of the Holders of Securities of such series; and provided further that in the case of any default of the character specified in Section 7.07(d) with respect to Securities of such series, no such notice to Holders of Securities of such series shall be given until at least 90 days after the occurrence thereof. For the purpose of this Section, the term "default", with respect to Securities of any series, means any event which is, or after notice or lapse of time, or both, would become, a Default or an Event of Default with respect to Securities of such series. SECTION 8.03. Certain Rights of Trustee. Except as otherwise provided in Section 8.01: (i) the Trustee may rely and shall be protected in acting or refraining from acting upon any resolution, certificate, statement, instrument, opinion, report, notice, request, direction, consent, order, bond, note or other paper or document believed by it to be genuine and to have been signed or presented by the proper party or parties; (ii) any request or direction of the Company mentioned herein shall be sufficiently evidenced by a Company Request or Company Order and any resolution of the Board of Directors may be sufficiently evidenced by a Board Resolution; Page 41
(iii) whenever in the administration of this Indenture the Trustee shall deem it desirable that a matter be proved or established prior to taking, suffering or omitting any action hereunder, the Trustee (unless other evidence be herein specifically prescribed) may, in the absence of bad faith on its part, rely upon an Officers' Certificate; (iv) the Trustee may consult with counsel and the advice of such counsel or any Opinion of Counsel shall be full and complete authorization and protection in respect of any action taken, suffered or omitted by it hereunder in good faith and in reliance thereon; (v) the Trustee shall be under no obligation to exercise any of the rights or powers vested in it by this Indenture at the request or direction of any of the Holders pursuant to this Indenture, unless such Holders shall have offered to the Trustee reasonable security or indemnity against the costs, expenses and liabilities which might be incurred by it in compliance with such request or direction; (vi) the Trustee shall not be bound to make any investigation into the facts or matters stated in any resolution, certificate, statement, instrument, opinion, report, notice, request, direction, consent, order, bond, security or other paper or document, but the Trustee, in its discretion, may make further inquiry or investigation into such facts or matters as it may see fit, and, if the Trustee shall determine to make such further inquiry or investigation, it shall be entitled to examine the books, records and premises of the Company, personally or by agent or attorney and, if so requested to do so by any of the Holders, at the sole cost and expense of the Holders; (vii) the Trustee may execute any of the trusts or powers hereunder or perform any duties hereunder either directly or by or through agents or attorneys and the Trustee shall not be responsible for any misconduct or negligence on the part of any agent or attorney appointed with due care by it hereunder; (viii) in the event that the Trustee is also acting as Paying Agent, Authenticating Agent or Security Registrar hereunder, the rights and protections afforded to the Trustee pursuant to this Article Eight shall also be afforded to such Paying Agent, Authenticating Agent or Security Registrar; (ix) the Trustee shall not be charged with knowledge of any Default unless either (1) a Responsible Officer of the Trustee shall have actual knowledge of such Default or (2) written notice of such Default shall have been given to the Trustee by the Company or any Holder; and (x) the Trustee shall not be liable for any action taken, suffered or omitted by it in good faith and reasonably believed by it to be authorized or within the discretion or rights or powers conferred upon it by this Indenture. SECTION 8.04. Not Responsible for Recitals or Issuance of Securities. The recitals contained herein and in the Securities, except the Trustee's certificates of authentication, shall be taken as the statements of the Company, and neither the Trustee nor any Authenticating Agent assumes responsibility for their correctness. The Trustee makes no representations as to the validity or sufficiency of this Indenture or of the Securities. The Trustee shall not be accountable for the use or application by the Company of Securities or the proceeds thereof. SECTION 8.05. May Hold Securities. The Trustee, any Authenticating Agent, any Paying Agent, the Security Registrar or any other agent of the Company, in its individual or any other capacity, may become the owner or pledgee of Securities and, subject to Sections 8.08 and 8.13, may otherwise deal with the Company with the same rights it would have if it were not Trustee, Authenticating Agent, Paying Agent, Security Registrar or such other agent. SECTION 8.06. Money Held in Trust. Money held by the Trustee in trust hereunder need not be segregated from other funds except to the extent required by law. The Trustee shall be under no liability for interest on any money received by it hereunder except as otherwise agreed in writing with the Company. SECTION 8.07. Compensation and Reimbursement. The Company agrees (i) to pay to the Trustee from time to time reasonable compensation for all services rendered by it hereunder (which compensation shall not be limited by any provision of law in regard to the compensation of a trustee of an express trust); (ii) except as otherwise expressly provided herein, to reimburse the Trustee upon its request for all reasonable expenses, disbursements and advances incurred or made by the Trustee in accordance with any provision of this Indenture (including the reasonable compensation and the expenses and disbursements of its agents and counsel), except any such expense, disbursement or advance as may be attributable to its negligence or bad faith; and (iii) to indemnify the Trustee for, and to hold it harmless against, any loss, liability or expense incurred without negligence or bad faith on its part, arising out of or in connection with the acceptance or administration of this trust, including the costs and expenses of defending itself against any claim or liability in connection with the exercise or performance of any of its powers or duties hereunder. As security for the performance of the obligations of the Company under this Section the Trustee shall have a lien prior to the Page 42
Securities upon all property and funds held or collected by the Trustee as such, except funds held in trust for the payment of principal of, premium, if any, or interest on particular Securities. Without prejudice to any other rights available to the Trustee under applicable law, when the Trustee incurs expenses or renders services in connection with an Event of Default specified in 7.01, the expenses (including the reasonable fees and expenses of its counsel) and the compensation for the services are intended to constitute expenses of administration under any applicable bankruptcy, insolvency or other similar law. The obligations of the Company set forth in this Section 8.07 and any lien arising hereunder shall survive the resignation or removal of any Trustee, the discharge of the Company's obligations pursuant to Article Eleven of this Indenture and the termination of this Indenture and the repayment of the Securities whether at the Stated Maturity or otherwise. SECTION 8.08. Disqualification; Conflicting Interests. If the Trustee has or shall acquire a conflicting interest within the meaning of Section 310 of the Trust Indenture Act, the Trustee shall either eliminate such conflicting interest or resign, to the extent and in the manner provided by, and subject to the provisions of, the Trust Indenture Act and this Indenture. To the extent permitted by the Trust Indenture Act, the Trustee shall not be deemed to have a conflicting interest with respect to the indentures relating to Existing Subordinated Indebtedness or to the Securities of any series by virtue of being Trustee with respect to the Securities of any particular series of Securities other than that series. SECTION 8.09. Corporate Trustee Required; Eligibility. There shall at all times be a Trustee with respect to each series of Securities hereunder which shall be a corporation organized and doing business under the laws of the United States of America, any State thereof or the District of Columbia, authorized under such laws to exercise corporate trust powers, having a combined capital and surplus of at least $5,000,000, subject to supervision or examination by Federal or State authority; provided, however, that if Section 310(a) of the Trust Indenture Act or the rules and regulations of the Commission under the Trust Indenture Act at any time permit a corporation organized and doing business under the laws of any other jurisdiction to serve as trustee of an indenture qualified under the Trust Indenture Act, this Section 8.09 shall be automatically deemed amended to permit a corporation organized and doing business under the laws of any such jurisdiction to serve as Trustee hereunder. If such corporation publishes reports of condition at least annually, pursuant to law or to the requirements of the aforesaid supervising or examining authority, then for the purposes of this Section, the combined capital and surplus of such corporation shall be deemed to be its combined capital and surplus as set forth in its most recent report of condition so published. Neither the Company nor any person directly or indirectly controlling, controlled by or under common control with the Company may serve as Trustee. If at any time the Trustee with respect to any series of Securities shall cease to be eligible in accordance with the provisions of this Section, it shall resign immediately in the manner and with the effect hereinafter specified in this Article. SECTION 8.10. Resignation and Removal; Appointment of Successor. (i) No resignation or removal of the Trustee and no appointment of a successor Trustee pursuant to this Article shall become effective until the acceptance of appointment by the successor Trustee under Section 8.11. (ii) The Trustee may resign with respect to any series of Securities at any time by giving written notice thereof to the Company. If an instrument of acceptance by a successor Trustee shall not have been delivered to the resigning Trustee within 30 days after the giving of such notice of resignation, the resigning Trustee may petition any court of competent jurisdiction for the appointment of a successor Trustee with respect to Securities of such series. (iii) The Trustee may be removed with respect to any series of Securities at any time by Act of the Holders of a majority in principal amount of the Outstanding Securities of such series, delivered to the Trustee and to the Company. (iv) If at any time: (a) the Trustee shall fail to comply with Section 8.08 with respect to any series of Securities after written request therefor by the Company or by any Holder who has been a bona fide Holder of a Security of such series for at least six months, or (b) the Trustee shall cease to be eligible under Section 8.09 with respect to any series of Securities and shall fail to resign after written request therefor by the Company or by any Holder of Securities of such series, or (c) the Trustee shall become incapable of acting with respect to any series of Securities or shall be adjudged a bankrupt or insolvent or a receiver of the Trustee or of its property shall be appointed or any public officer shall take charge or control of the Trustee or of its property or affairs for the purpose of rehabilitation, conservation or liquidation, then, in any such case, (1) the Company by a Board Resolution may remove the Trustee with respect to such series, or (2) subject to Section 7.14, any Holder who has been a bona fide Holder of a Security of such series for at least six months may, on behalf of himself and all others similarly situated, petition any court of competent jurisdiction for the removal of the Trustee and the appointment of a successor Trustee with respect to such series. Page 43
(v) If the Trustee shall resign, be removed or become incapable of acting with respect to any series of Securities, or if a vacancy shall occur in the office of Trustee with respect to any series of Securities for any cause, the Company, by a Board Resolution, shall promptly appoint a successor Trustee or Trustees with respect to the Securities of that or those series (it being understood that any such successor Trustee may be appointed with respect to the Securities of one or more or all of such series and that at any time there shall be only one Trustee with respect to the Securities of any particular series) and shall comply with the applicable requirements of Section 8.11. If, within one year after such resignation, removal or incapability, or the occurrence of such vacancy, a successor Trustee with respect to such series of Securities shall be appointed by the Act of the Holders of a majority in principal amount of the Outstanding Securities of such series delivered to the Company and the retiring Trustee with respect to such series, the successor Trustee so appointed shall, forthwith upon its acceptance of such appointment, become the successor Trustee with respect to such series and to that extent supersede the successor Trustee appointed by the Company with respect to such series. If no successor Trustee with respect to such series shall have been so appointed by the Company or the Holders of Securities of such series and accepted appointment in the manner hereinafter provided, any Holder who has been A bona fide Holder of a Security of such series for at least six months may, on behalf of himself and all others similarly situated, petition any court of competent jurisdiction for the appointment of a successor Trustee with respect to such series. (vi) The Company shall give notice of each resignation and each removal of the Trustee with respect to the Securities of any series and each appointment of a successor Trustee with respect to the Securities of any series by mailing written notice of such event by first-class mail, postage prepaid, to the Holders of Registered Securities of such series as their names and addresses appear in the Security Register and, if Securities of such series are issuable as Bearer Securities, by publishing notice of such event once in an Authorized Newspaper in each Place of Payment for the Securities of such series located outside the United States. Each notice shall include the name of the successor Trustee with respect to the Securities of such series and the address of its Principal Corporate Trust Office. SECTION 8.11. Acceptance of Appointment by Successor. (i) In the case of the appointment hereunder of a successor Trustee with respect to any series of Securities, every such successor Trustee so appointed shall execute, acknowledge and deliver to the Company and to the retiring Trustee an instrument accepting such appointment, and thereupon the resignation or removal of the retiring Trustee shall become effective with respect to all or any series as to which it is resigning as Trustee, and such successor Trustee, without any further act, deed or conveyance, shall become vested with all the rights, powers, trusts and duties of the retiring Trustee with respect to all or any such series; but, on request of the Company or such successor Trustee, such retiring Trustee shall upon payment of its charges, execute and deliver an instrument transferring to such successor Trustee all the rights, powers and trusts of such retiring Trustee with respect to all or any such series; and shall duly assign, transfer and deliver to such successor Trustee all property and money held by such retiring Trustee hereunder with respect to all or any such series, subject nevertheless to its lien, if any, provided in Section 8.07. (ii) In case of the appointment hereunder of a successor Trustee with respect to the Securities of one or more (but not all) series, the Company, the retiring Trustee and each successor Trustee with respect to the Securities of one or more series shall execute and deliver an indenture supplemental hereto wherein each successor Trustee shall accept such appointment and which (a) shall contain such provisions as shall be necessary or desirable to transfer and confirm to, and to vest in, each successor Trustee all the rights, powers, trusts and duties of the retiring Trustee with respect to the Securities of that or those series to which the appointment of such successor Trustee relates, (b) if the retiring Trustee is not retiring with respect to all Securities, shall contain such provisions as shall be deemed necessary or desirable to confirm that all the rights, powers, trusts and duties of the retiring Trustee with respect to the Securities of that or those series as to which the retiring Trustee is not retiring shall continue to be vested in the retiring Trustee, and (c) shall add to or change any of the provisions of this Indenture as shall be necessary to provide for or facilitate the administration of the trusts hereunder by more than one Trustee, it being understood that nothing herein or in such supplemental indenture shall constitute such Trustees co-trustees of the same trust and that each such Trustee shall be Trustee of a trust or trusts hereunder separate and apart from any trust or trusts hereunder administered by any other such Trustee; and upon the execution and delivery of such supplemental indenture the resignation or removal of the retiring Trustee shall become effective to the extent provided therein and each such successor Trustee, without any further act, deed or conveyance, shall become vested with all the rights, powers, trusts and duties of the retiring Trustee with respect to the Securities of that or those series to which the appointment of such successor Trustee relates; but, on request of the Company or any successor Trustee, such retiring Trustee shall duly assign, transfer and deliver to such successor Trustee all property and money held by such retiring Trustee hereunder with respect to the Securities of that or those series to which the appointment of such successor Trustee relates, subject nevertheless to its lien, if any, provided for in Section 8.07. (iii) Upon request of any such successor Trustee, the Company shall execute any and all instruments for more fully and certainly vesting in and confirming to such successor Trustee all such rights, powers and trusts referred to in paragraph (i) or (ii) of this Section, as the case may be. (iv) No successor Trustee with respect to a series of Securities shall accept its appointment unless at the time of such acceptance such successor Trustee shall be qualified and eligible with respect to such series under this Article. SECTION 8.12. Merger, Conversion, Consolidation or Succession to Business of Trustee. Any corporation into which the Trustee may be merged or converted or with which it may be consolidated, or any corporation resulting from any merger, conversion or Page 44
consolidation to which the Trustee shall be a party, or any corporation succeeding to all or substantially all of the corporate trust business of the Trustee, shall be the successor of the Trustee hereunder, provided that such corporation shall be otherwise qualified and eligible under this Article, without the execution or filing of any paper or any further act on the part of any of the parties hereto. In case any Securities shall have been authenticated, but not delivered, by the Trustee then in office, any successor by merger, conversion or consolidation to such authenticating Trustee may adopt such authentication and deliver the Securities so authenticated with the same effect as if such successor Trustee had itself authenticated such Securities. SECTION 8.13. Preferential Collection of Claims against Company. If and when the Trustee shall be or become a creditor of the Company (or any other obligor upon the Securities), the Trustee shall be subject to the provisions of Section 311 of the Trust Indenture Act regarding the collection of any claim as a creditor against the Company (or any such other obligor). A Trustee that has resigned or been removed shall be subject to and comply with said Section 311 to the extent required thereby. SECTION 8.14. Appointment of Authenticating Agents. The Trustee may appoint an Authenticating Agent or Agents, which may include any Affiliate of the Company, with respect to one or more series of Securities. Such Authenticating Agent or Agents at the option of the Trustee shall be authorized to act on behalf of the Trustee to authenticate Securities of such series issued upon original issuance, exchange, registration of transfer or partial redemption thereof or pursuant to Section 3.06, and Securities so authenticated shall be entitled to the benefits of this Indenture and shall be valid and obligatory for all purposes as if authenticated by the Trustee hereunder. Whenever reference is made in this Indenture to the authentication and delivery of Securities by the Trustee or the Trustee's certificate of authentication or the delivery of Securities to the Trustee for authentication, such reference shall be deemed to include authentication and delivery on behalf of the Trustee by an Authenticating Agent, a certificate of authentication executed on behalf of the Trustee by an Authenticating Agent and delivery of Securities to the Authenticating Agent on behalf of the Trustee. Each Authenticating Agent shall be acceptable to the Company and shall at all times be a corporation organized and doing business under the laws of the United States of America, any State thereof or the District of Columbia, authorized under such laws to act as Authenticating Agent, having a combined capital and surplus of not less than $5,000,000 and subject to supervision or examination by Federal or State authority. Notwithstanding the foregoing, an Authenticating Agent located outside the United States may be appointed by the Trustee if previously approved in writing by the Company and if such Authenticating Agent meets the minimum capitalization requirements of this Section 8.14. If such Authenticating Agent publishes reports of condition at least annually, pursuant to law or to the requirements of said supervising or examining authority, then for the purposes of this Section, the combined capital and surplus of such Authenticating Agent shall be deemed to be its combined capital and surplus as set forth in its most recent report of condition so published. If at any time an Authenticating Agent shall cease to be eligible in accordance with the provisions of this Section, such Authenticating Agent shall resign immediately in the manner and with the effect specified in this Section. Any corporation into which an Authenticating Agent may be merged or converted or with which it may be consolidated, or any corporation resulting from any merger, conversion or consolidation to which such Authenticating Agent shall be a party, or any corporation succeeding to the corporate agency or corporate trust business of an Authenticating Agent, shall continue to be an Authenticating Agent, provided such corporation shall be otherwise eligible under this Section, without the execution or filing of any paper or any further act on the part of the Trustee or the Authenticating Agent. An Authenticating Agent may resign at any time by giving written notice thereof to the Trustee and to the Company. The Trustee may at any time (and upon request by the Company shall) terminate the agency of an Authenticating Agent by giving written notice thereof to such Authenticating Agent and to the Company. Upon receiving such a notice of resignation or upon such termination, or in case at any time such Authenticating Agent shall cease to be eligible in accordance with the provisions of this Section, the Trustee may appoint a successor Authenticating Agent which shall be acceptable to the Company. Any successor Authenticating Agent upon acceptance of its appointment hereunder shall become vested with all the rights, powers and duties of its predecessor hereunder, with like effect as if originally named as an Authenticating Agent. No successor Authenticating Agent shall be appointed unless eligible under the provisions of this Section. If an appointment with respect to one or more series is made pursuant to this Section, the Securities of such series may have endorsed thereon, in addition to the Trustee's certificate of authentication, an alternate certificate of authentication in the following form: This is one of the Securities of the series designated therein referred to in the within-mentioned Indenture. THE CHASE MANHATTAN BANK, AS Trustee, by____________________________ As Authenticating Agent by AUTHORIZED OFFICER Page 45
ARTICLE NINE SUPPLEMENTAL INDENTURES SECTION 9.01. Supplemental Indentures Without Consent of Holders. Without the consent of any Holder of any Securities or coupons, the Company, when authorized by a Board Resolution, and the Trustee, at any time and from time to time, may enter into one or more indentures supplemental hereto, in form satisfactory to the Trustee, for any of the following purposes: (i) to evidence the succession of another corporation or Person to the Company, and the assumption by any such successor of the covenants of the Company herein and in the Securities contained; or (ii) to evidence and provide for the acceptance of appointment by another corporation as a successor Trustee hereunder with respect to one or more series of Securities and to add to or change any of the provisions of this Indenture as shall be necessary to provide for or facilitate the administration of the trusts hereunder by more than one Trustee, pursuant to Section 8.11; or (iii) to add to the covenants of the Company, for the benefit of the Holders of Securities of all or any series of Securities or coupons (and if such covenants are to be for the benefit of less than all series of Securities or coupons, stating that such covenants are expressly being included solely for the benefit of such series), or to surrender any right or power herein conferred upon the Company; or (iv) to cure any ambiguity, to correct or supplement any provision herein which may be inconsistent with any other provision herein, or to make any other provisions with respect to matters or questions arising under the Indenture; provided that such action shall not adversely affect the interests of the Holders of Securities of any series or any related coupons in any material respect, or (v) to add any additional Defaults or Events of Default with respect to all or any series of the Securities (and, if such Default or Event of Default is applicable to less than all series of Securities, specifying the series to which such Default or Event of Default is applicable); or (vi) to add to, change or eliminate any of the provisions of this Indenture to provide that Bearer Securities may be registrable as to principal, to change or eliminate any restrictions on the payment of principal of (or premium, if any) or any interest on Bearer Securities, to permit Bearer Securities to be issued in exchange for Registered Securities, to permit Bearer Securities to be issued in exchange for Bearer Securities of other authorized denominations or to permit or facilitate the issuance of Securities in uncertificated form; provided any such action shall not adversely affect the interests of the Holders of Securities of any series or any related coupons in any material respect; or (vii) to add to, change or eliminate any of the provisions of this Indenture, provided that any such addition, change or elimination (a) shall become effective only when there is no Security Outstanding of any series created prior to the execution of such supplemental indenture which is adversely affected by such change in or elimination of such provision or (b) shall not apply to any Securities Outstanding; or (viii) to establish the form or terms of Securities of any series as permitted by Sections 2.02 and 3.01, or (ix) to add to or change any provisions of this Indenture to such extent as shall be necessary to permit or facilitate the issuance of Securities convertible into other securities; or (x) to evidence any changes to Section 8.09 as permitted by the terms thereof; or (xi) to add to or change or eliminate any provision of this Indenture as shall be necessary or desirable in accordance with any amendments to the Trust Indenture Act, provided such action shall not adversely affect the interest of Holders of Securities of any series or any appurtenant coupons in any material respect. SECTION 9.02. Supplemental Indentures With Consent of Holders. With the consent of the Holders of not less than a majority in aggregate principal amount of the Outstanding Securities of all series affected by such supplemental indenture or indentures (acting as one class), by Act of said Holders delivered to the Company and the Trustee, the Company, when authorized by a Board Resolution, and the Trustee may enter into an indenture or indentures supplemental hereto for the purpose of adding any provisions to or changing in any manner or eliminating any of the provisions of this Indenture or of modifying in any manner the rights of the Holders of Securities of each such series and any related coupons under this Indenture; provided, however, that no such supplemental indenture shall, without the consent of the Holder of each Outstanding Security affected thereby; (i) change the Maturity of the principal of, or the Stated Maturity of any installment of interest (or premium, if any) on, any Security, or reduce the principal amount thereof or any premium thereon or the rate of interest thereon, or change the obligation of the Company to pay additional amounts pursuant to Section 5.04 (except as contemplated by Section 10.01(i) and permitted by Section 9.01), or Page 46
reduce the amount of the principal of an Original Issue Discount Security that would be due and payable upon a declaration of acceleration of the Maturity thereof pursuant to Section 7.02, or change the method of calculating interest thereon or the coin or currency in which any Security (or premium, if any, thereon) or the interest thereon is payable, or reduce the minimum rate of interest thereon, or impair the right to institute suit for the enforcement of any such payment on or after the Stated Maturity thereof (or, in the case of redemption or repayment, on or after the Redemption Date or Repayment Date); (ii) reduce the percentage in principal amount of the Outstanding Securities of any series, the consent of whose Holders is required for any such supplemental indenture or the consent of whose Holders is required for any waiver of certain defaults hereunder and their consequences provided for in this Indenture or reduce the requirements of Section 16.04 for a quorum; (iii) change any obligation of the Company to maintain an office or agency in the places and for the purposes specified in Section 5.02; or (iv) modify any of the provisions of this Section or Section 7.13, except to increase any such percentage or to provide that certain other provisions of this Indenture cannot be modified or waived. A supplemental indenture which changes or eliminates any covenant or other provision of this Indenture which has expressly been included solely for the benefit of one or more particular series of Securities, or which modifies the rights of the Holders of Securities of such series with respect to such covenant or other provision, shall be deemed not to affect the rights under this Indenture of the Holders of Securities of any other series. It shall not be necessary for any Act of Holders under this Section to approve the particular form of any proposed supplemental indenture, but it shall be sufficient if such Act shall approve the substance thereof. SECTION 9.03. Execution of Supplemental Indentures. In executing, or accepting the additional trusts created by, any supplemental indenture permitted by this Article or the modifications thereby of the trusts created by this Indenture, the Trustee shall be entitled to receive, and (subject to Section 8.01) shall be fully protected in relying upon, an Opinion of Counsel stating that the execution of such supplemental indenture is authorized or permitted by and complies with this Indenture. The Trustee may, but shall not be obligated to, enter into any such supplemental indenture which affects the Trustee's own rights, liabilities, duties or immunities under this Indenture or otherwise. SECTION 9.04. Effect of Supplemental Indentures. Upon the execution of any supplemental indenture under this Article, this Indenture shall be modified in accordance therewith, and such supplemental indenture shall form a part of this Indenture for all purposes; and every Holder of Securities theretofore or thereafter authenticated and delivered hereunder shall be bound thereby. SECTION 9.05. Conformity with Trust Indenture Act. Every supplemental indenture executed pursuant to this Article shall conform to the requirements of the TIA as then in effect. SECTION 9.06. Reference in Securities to Supplemental Indentures. Securities authenticated and delivered after the execution of any supplemental indenture pursuant to this Article may, and shall, if required by the Trustee, bear a notation in form approved by the Trustee as to any matter provided for in such supplemental indenture. If the Company shall so determine, new Securities so modified as to conform, in the opinion of the Trustee and the Company, to any such supplemental indenture may be prepared and executed by the Company and authenticated and delivered by the Trustee in exchange for Outstanding Securities. SECTION 9.07. Subordination Unimpaired. No supplemental indenture executed pursuant to this Article shall directly or indirectly modify the provisions of Article Fourteen in any manner which might alter the subordination of the Securities. ARTICLE TEN CONSOLIDATION, MERGER, CONVEYANCE OR TRANSFER SECTION 10.01. Company May Consolidate, etc., Only on Certain Terms. The Company shall not consolidate with or merge into any other corporation or convey or transfer its properties and assets substantially as an entirety to any Person, unless (i) the Person formed by such consolidation or into which the Company is merged or the Person which acquires by conveyance or transfer the properties and assets of the Company substantially as an entirety shall expressly assume, by an indenture supplemental hereto, executed and delivered to the Trustee, in form satisfactory to the Trustee, the due and punctual payment of the principal of, premium, if any, and interest (including all additional amounts, if any, payable pursuant to Section 5.04) on all the Securities and the performance of every covenant of this Indenture on the part of the Company to be performed or observed; (ii) immediately after giving effect to such transaction, no Default, and no event which, after notice or lapse of time, or both, would Page 47
become a Default, shall have happened and be continuing; and (iii) the Company has delivered to the Trustee an Officers' Certificate and an Opinion of Counsel each stating that such consolidation, merger, conveyance or transfer and such supplemental indenture comply with this Article and that all conditions precedent herein provided for relating to such transaction have been complied with. SECTION 10.02. Successor Corporation Substituted. Upon any consolidation or merger, or any conveyance or transfer of the properties and assets of the Company substantially as an entirety in accordance with Section 10.01, the successor Person formed by such consolidation or into which the Company is merged or to which such conveyance or transfer is made shall succeed to, and be substituted for, and may exercise every right and power of, the Company under this Indenture with the same effect as if such successor Person had been named as the Company herein. In the event of any such conveyance or transfer, the Company as the predecessor corporation shall be relieved of all obligations and covenants under this Indenture and may be dissolved, wound up and liquidated at any time thereafter. ARTICLE ELEVEN SATISFACTION AND DISCHARGE SECTION 11.01. Satisfaction and Discharge of Indenture. This Indenture shall cease to be of further effect (except as to any surviving rights of registration of transfer or exchange of Securities herein expressly provided for and rights to receive payments thereon and any right to receive additional amounts, as provided in Section 5.04), and the Trustee, on receipt of a Company Request and at the expense of the Company, shall execute proper instruments acknowledging satisfaction and discharge of this Indenture, when (i) either (a) all Securities theretofore authenticated and delivered (other than (1) coupons appertaining to Bearer Securities surrendered for exchange for Registered Securities and maturing after such exchange, whose surrender is not required or has not been waived as provided in Section 3.05, (2) coupons appertaining to Bearer Securities called for redemption and maturing after the relevant Redemption Date, whose surrender has been waived as provided in Section 4.06, (3) coupons appertaining to Bearer Securities surrendered for repayment pursuant to Section 15.03 and maturing after the Repayment Date, whose surrender has been waived as provided in Section 15.03, (4) Securities and coupons which have been destroyed, lost or stolen and which have been replaced or paid as provided in Section 3.06, and (5) Securities for whose payment money has theretofore been deposited in trust or segregated and held in trust by the Company and thereafter repaid to the Company or discharged from such trust, as provided in Section 5.03) have been delivered to the Trustee for cancelation; or (b) all such Securities not theretofore delivered to the Trustee for cancelation (1) have become due and payable, or (2) will become due and payable at their Maturity within one year, or (3) are to be called for redemption within one year under arrangements satisfactory to the Trustee for the giving of notice of redemption by the Trustee in the name, and at the expense, of the Company, and the Company, in the case of (b) (1), (2) or (3) above, has deposited or caused to be deposited with the Trustee, as trust funds in trust for the purpose, an amount (said amount to be immediately due and payable to the Holders) sufficient to pay and discharge the entire indebtedness on such Securities and coupons not theretofore delivered to the Trustee for cancelation, for principal, premium, if any, and interest to the date of such deposit (in the case of Securities which have become due and payable), or to the Maturity or Redemption Date, as the case may be; (ii) the Company has paid or caused to be paid all other sums payable hereunder by the Company; and (iii) the Company has delivered to the Trustee an Officers' Certificate and an Opinion of Counsel each stating that all conditions precedent herein provided for relating to the satisfaction and discharge of this Indenture have been complied with. Notwithstanding the satisfaction and discharge of this Indenture, the obligations of the Company to the Trustee under Section 8.07 and, if money shall have been deposited with the Trustee pursuant to subclause (b) of clause (i) of this Section, the obligations of the Trustee under Section 11.02 and the last paragraph of Section 5.03 shall survive. The Trustee may give notice at the Company's expense to the Holders of Securities Outstanding of the immediate availability of the amount referred to in clause (i) of this Section 11.01. Funds held pursuant to this Section shall not be subject to the provisions of Article Fourteen. Page 48
SECTION 11.02. Application of Trust Money. Subject to the provisions of the last paragraph of Section 5.03, all money deposited with the Trustee pursuant to Section 11.01 shall be held in trust and applied by it, in accordance with the provisions of the Securities, the coupons, if any, and this Indenture, to the payment, either directly or through any Paying Agent (including the Company acting as its own Paying Agent), as the Trustee may determine, to the Persons entitled thereto, of the principal, premium, if any, and interest for whose payment such money has been deposited with the Trustee; but such money need not be segregated from other funds except to the extent required by law. SECTION 11.03. Reinstatement. If the Trustee or any Paying Agent is unable to apply any money in accordance with Section 11.02 by reason of any legal proceeding or by reason of any order or judgment of any court or governmental authority enjoining, restraining or otherwise prohibiting such application, the Company's obligations under this Indenture and the Securities shall be revived and reinstated as though no deposit had occurred pursuant to Section 11.01 until such time as the Trustee or any Paying Agent is permitted to apply all such money in accordance with Section 11.02. ARTICLE TWELVE Immunity of Incorporators, Stockholders, Officers and Directors SECTION 12.01. Exemption from Individual Liability. No recourse under or upon any obligation, covenant or agreement of this Indenture, or of any Security or coupon, or for any claim based thereon or otherwise in respect thereof, shall be had against any incorporator, stockholder, officer or director, as such, past, present or future, of the Company or of any successor corporation, either directly or through the Company, whether by virtue of any constitution, statute or rule of law, or by the enforcement of any assessment or penalty or otherwise; it being expressly understood that this Indenture and the obligations issued hereunder are solely corporate obligations of the Company, and that no such personal liability whatever shall attach to, or is or shall be incurred by, the incorporators, stockholders, officers or directors, as such, of the Company or of any successor corporation, or any of them, because of the creation of the indebtedness hereby authorized, or under or by reason of the obligations, covenants or agreements contained in this Indenture or in any of the Securities or coupons or implied therefrom; and that any and all such personal liability, either at common law or in equity or by constitution or statute, of, and any and all such rights and claims against, every such incorporator, stockholder, officer or director, as such, because of the creation of the indebtedness hereby authorized, or under or by reason of the obligations, covenants or agreements contained in this Indenture or in any of the Securities or coupons or implied therefrom, are hereby expressly waived and released as a condition of, and as a consideration for, the execution of this Indenture and the issuance of the Securities. ARTICLE THIRTEEN SINKING FUNDS SECTION 13.01. Applicability of Article. The provisions of this Article shall be applicable to any sinking fund for the retirement of Securities of a series except as otherwise specified as contemplated by Section 3.01 for Securities of such series. The minimum amount of any sinking fund payment provided for by the terms of Securities of any series is herein referred to as a "mandatory sinking fund payment", and any payment in excess of such minimum amount provided for by the terms of Securities of any series is herein referred to as an "optional sinking fund payment". If provided for by the terms of Securities of any series, the cash amount of any sinking fund payment may be subject to reduction as provided in Section 13.02. Each sinking fund payment shall be applied to the redemption of Securities of any series as provided for by the terms of Securities of such series. SECTION 13.02. Satisfaction of Sinking Fund Payments with Securities. The Company (i) may deliver Outstanding Securities of a series (other than any previously called for redemption), together in the case of any Bearer Securities of such series with all unmatured coupons appertaining thereto and (ii) may apply as a credit Securities of a series which have been redeemed either at the election of the Company pursuant to the terms of such Securities or through the application of permitted optional sinking fund payments pursuant to the terms of such Securities, in each case in satisfaction of all or any part of any sinking fund payment with respect to the Securities of such series required to be made pursuant to the terms of such Securities as provided for by the terms of such series; provided that such Securities have not been previously so credited. Such Securities shall be received and credited for such purpose by the Trustee at the Redemption Price specified in such Securities for redemption through operation of the sinking fund and the amount of such sinking fund payment shall be reduced accordingly. SECTION 13.03. Redemption of Securities for Sinking Fund. Not less than 60 days prior to each sinking fund payment date for any series of Securities, the Company will deliver to the Trustee and the Security Registrar an Officers' Certificate specifying (i) the amount of the next ensuing sinking fund payment for that series pursuant to the terms of that series, (ii) the portion thereof, if any, which is to be satisfied by payment of cash and the portion thereof, if any, which is to be satisfied by delivering and crediting Securities of that series pursuant to Section 13.02, and (iii) that none of such Securities has theretofore been so credited and stating the basis for such credit, and will also deliver to the Trustee any Securities to be so delivered. Not less than 30 days before each sinking Page 49
fund payment date the Security Registrar shall select the Securities to be redeemed upon such sinking fund payment date in the manner specified in Section 4.03 and cause notice of the redemption thereof to be given in the name of and at the expense of the Company in the manner provided in Section 4.04. Such notice having been duly given, the redemption of such Securities shall be made upon the terms and in the manner stated in Sections 4.06 and 4.07 and shall be subject to Section 4.08. ARTICLE FOURTEEN SUBORDINATION OF SECURITIES SECTION 14.01. Agreement To Subordinate. The Company, for itself, its successors and assigns, covenants and agrees, and each Holder of a Security by his acceptance thereof, likewise covenants and agrees, that the payment of the principal and premium, if any, and interest on each and all of the Securities is hereby expressly subordinated, to the extent and in the manner hereinafter set forth, in right of payment to the prior payment in full of all Senior Indebtedness and, subject to the provisions of Section 14.09, General Obligations of the Company. SECTION 14.02. Distribution on Dissolution, Liquidation and Reorganization; Subrogation of Securities. Upon any distribution of assets of the Company upon any dissolution, winding up, liquidation or reorganization of the Company, whether in bankruptcy, insolvency, reorganization or receivership proceedings or upon an assignment for the benefit of creditors or any other marshalling of the assets and liabilities of the Company or otherwise (subject to the power of a court of competent jurisdiction to make other equitable provision reflecting the rights conferred in this Indenture upon the Senior Indebtedness and the holders thereof with respect to the Securities and the Holders thereof (and, upon the General Obligations and the creditors in respect thereof with respect to the Securities and the Holders thereof) by a lawful plan of reorganization under applicable bankruptcy law); (i) the holders of all Senior Indebtedness shall first be entitled to receive payment in full in accordance with the terms of such Senior Indebtedness of the principal thereof, premium, if any, and the interest due thereon (including interest accruing subsequent to the commencement of any proceeding for the bankruptcy or reorganization of the Company under any applicable bankruptcy, insolvency, or similar law now or hereafter in effect) before the Holders of the Securities are entitled to receive any payment upon the principal of or premium, if any, or interest on indebtedness evidenced by the Securities; (ii) any payment or distribution of assets of the Company of any kind or character, whether in cash, property or securities, to which the Holders of the Securities or the Trustee would be entitled except for the provisions of this Article Fourteen, including any such payment or distribution which may be payable or deliverable by reason of the payment of any other indebtedness of the Company being subordinated to the payment of the Securities, shall be paid by the liquidating trustee or agent or other person making such payment or distribution, whether a trustee in bankruptcy, a receiver or liquidating trustee or otherwise, directly to the holders of Senior Indebtedness or their representative or representatives or to the trustee or trustees under any indenture under which any instruments evidencing any of such Senior Indebtedness may have been issued, in accordance with the priorities then existing among holders of Senior Indebtedness for payment of the aggregate amounts remaining unpaid on account of the principal of and premium, if any, and interest (including interest accruing subsequent to the commencement of any proceeding for the bankruptcy or reorganization of the Company under any applicable bankruptcy, insolvency or similar law now or hereafter in effect) on the Senior Indebtedness held or represented by each, to the extent necessary to make payment in full of all Senior Indebtedness remaining unpaid, after giving effect to any concurrent payment or distribution to the holders of such Senior Indebtedness; it being understood that if the Holders of Securities shall fail to file a proper claim in the form required by any proceeding referred to in this subparagraph (ii) prior to 30 days before the expiration of the time to file such claim or claims, then the holders of Senior Indebtedness are hereby authorized to file an appropriate claim or claims for and on behalf of the Holders of Securities in the form required in any such proceeding (as are the creditors in respect of General Obligations in the event Section 14.09 is applicable); and (iii) in the event that, notwithstanding the foregoing, any payment or distribution of assets of the Company of any kind or character, whether in cash, property or securities, including any such payment or distribution which may be payable or deliverable by reason of the payment of any other indebtedness of the Company being subordinate to the payment of the Securities, shall be received by the Trustee or Holders of the Securities before all Senior Indebtedness is paid in full, such payment or distribution shall be held in trust for the benefit of and shall be paid over to the holders of such Senior Indebtedness or their representative or representatives or to the trustee or trustees under any indenture under which any instruments evidencing any of such Senior Indebtedness may have been issued, ratably as aforesaid, for application to the payment of all Senior Indebtedness remaining unpaid until all such Senior Indebtedness shall have been paid in full, after giving effect to any concurrent payment or distribution to the holders of such Senior Indebtedness. Subject to the payment in full of all Senior Indebtedness, the Holders of the Securities shall be subrogated (equally and ratably with the holders of all indebtedness of the Company which by its express terms is subordinated to indebtedness of the Company to substantially the same extent as the Securities are subordinated and is entitled to like rights of subrogation) to the rights of the holders of Senior Indebtedness to receive payments or distributions of cash, property or securities of the Company applicable to the Senior Indebtedness until the principal of and premium, if any, and interest on the Securities shall be paid in full and no such payments or distributions to holders of such Senior Indebtedness to which the Holders of the Securities would be entitled except for the provisions Page 50
hereof of cash, property or securities otherwise distributable to the Senior Indebtedness shall, as between the Company, its creditors, other than the holders of Senior Indebtedness and the Holders of the Securities, be deemed to be a payment by the Company to or on account of the Securities. It is understood that the provisions of this Article Fourteen are and are intended solely for the purpose of defining the relative rights of the Holders of the Securities, on the one hand, and the holders of Senior Indebtedness (and, in the case of Section 14.09, the Holders of the Securities, on the one hand, and creditors in respect of General Obligations) on the other hand. Nothing contained in this Article Fourteen or elsewhere in this Indenture or in the Securities is intended to or shall impair, as between the Company, its creditors, other than the holders of Senior Indebtedness, and the Holders of the Securities, the obligation of the Company, which is unconditional and absolute (and which, subject to the rights under this Article Fourteen of the holders of the Senior Indebtedness and the rights under Section 14.09 of creditors in respect of General Obligations, is intended to rank equally with all other general obligations of the Company), to pay to the Holders of the Securities the principal of, premium, if any, and interest on the Securities as and when the same shall become due and payable in accordance with their terms or to affect the relative rights of the Holders of the Securities and creditors of the Company, other than the holders of the Senior Indebtedness and creditors in respect of General Obligations, nor shall anything herein or in the Securities prevent the Trustee or the Holder of any Security from exercising all remedies otherwise permitted by applicable law upon Default under this Indenture, subject to the rights, if any, under this Article Fourteen of the holders of Senior Indebtedness and under Section 14.09 of creditors in respect of General Obligations in respect of cash, property or securities of the Company received upon the exercise of any such remedy. Upon any payment or distribution of assets of the Company referred to in this Article Fourteen, the Trustee, subject to the provisions of Section 8.01, and the Holders of the Securities shall be entitled to rely upon any order or decree of a court of competent jurisdiction in which such dissolution, winding up, liquidation or reorganization proceedings are pending or upon a certificate of the liquidating trustee or agent or other person making any distribution to the Trustee or to the Holders of the Securities for the purpose of ascertaining the persons entitled to participate in such distribution, the holders of the Senior Indebtedness and other indebtedness of the Company and the creditors in respect of General Obligations, the amount thereof or payable thereon, the amount or amounts paid or distributed thereon and all other facts pertinent thereto or to this Article Fourteen. In the absence of any such liquidating trustee, agent or other person, the Trustee shall be entitled to rely upon a written notice by a Person representing himself to be a holder of Senior Indebtedness (or a trustee or representative on behalf of such holder) or a creditor in respect of General Obligations as evidence that such Person is a holder of Senior Indebtedness (or is such a trustee or representative) or a creditor in respect of General Obligations, as the case may be. In the event that the Trustee determines, in good faith, that further evidence is required with respect to the right of any Person, as a holder of Senior Indebtedness or a creditor in respect of General Obligations, to participate in any payment or distribution pursuant to this Section or Section 14.09, the Trustee may request such Person to furnish evidence to the reasonable satisfaction of the Trustee as to the amount of Senior Indebtedness or General Obligations held by such Person, as to the extent to which such Person is entitled to participation in such payment or distribution, and as to other facts pertinent to the rights of such Person under this Section or Section 14.09, and if such evidence is not furnished, the Trustee may defer any payment to such Person pending judicial determination as to the right of such Person to receive such payment. The obligations of the Company in respect of the Securities shall rank on a parity with the Existing Subordinated Indebtedness and any other obligations of the Company ranking on a parity with the Securities. With respect to the holders of Senior Indebtedness or creditors in respect of General Obligations, the Trustee undertakes to perform or to observe only such of its covenants and obligations as are specifically set forth in this Article, and no implied covenants or obligations with respect to the holders of Senior Indebtedness or creditors in respect of General Obligations shall be read into this Indenture against the Trustee. The Trustee, however, shall not be deemed to owe any fiduciary duty to the holders of Senior Indebtedness or creditors in respect of General Obligations, and shall not be liable to any such holders or creditors if it shall mistakenly pay over or distribute to or on behalf of Holders of Securities or the Company moneys or assets to which any holders of Senior Indebtedness or creditors in respect of General Obligations shall be entitled by virtue of this Article Fourteen. SECTION 14.03. Payments on Securities Prohibited During Event of Default under Senior Indebtedness. In the event and during the continuation of any default in the payment of principal of, or premium, if any, or interest on, any Senior Indebtedness beyond any applicable period of grace, or in the event that any event of default with respect to any Senior Indebtedness shall have occurred and be continuing, or would occur as a result of the payment referred to hereinafter, permitting the holders of such Senior Indebtedness (or a trustee on behalf of the holders thereof) to accelerate the maturity thereof, then, unless and until such default or event of default shall have been cured or waived or shall have ceased to exist, no payment of principal of, or premium or interest on the Securities, or in respect of any redemption, retirement, purchase or other acquisition of any of the Securities, shall be made by the Company. SECTION 14.04. Payments on Securities Permitted. Nothing contained in this Indenture or in any of the Securities shall (i) impair, as between the Company and Holders of Securities, the obligation of the Company to make, or prevent the Company from making, at any time except as provided in Sections 14.02, 14.03, 14.08 and 14.09, payments of principal of or premium, if any, or interest (including interest accruing subsequent to the commencement of any proceeding for the bankruptcy or reorganization of the Company under any applicable bankruptcy, insolvency or similar law now or hereafter in effect) on the Securities, as and when the same shall become due and payable in accordance with the terms of the Securities, (ii) affect the relative rights of the Holders of the Securities and creditors of the Company other than the holders of the Senior Indebtedness of the Company and the creditors in respect of General Obligations, (iii) prevent the Trustee or the Holder of any Security from exercising all remedies otherwise permitted by applicable law upon default thereunder, subject to the rights, if any, under Article Fourteen of the holders of Senior Indebtedness and the creditors in Page 51
respect of General Obligations in respect of cash, property or securities of the Company received upon the exercise of such remedy, or (iv) prevent the application by the Trustee or any Paying Agent of any moneys deposited with it hereunder to the payment of or on account of the principal of or premium, if any, or interest on the Securities or prevent the receipt by the Trustee or any Paying Agent of such moneys, if, prior to the second Business Day prior to such deposit, the Trustee or such Paying Agent did not have written notice of any event prohibiting the making of such deposit by the Company. SECTION 14.05. Authorization of Holders to Trustee To Effect Subordination. Each Holder of a Security by his acceptance thereof authorizes and directs the Trustee in his behalf to take such action as may be necessary or appropriate to effectuate the subordination as provided in this Article Fourteen and appoints the Trustee his attorney-in-fact for any and all such purposes. SECTION 14.06. Notice to Trustee. Notwithstanding the provisions of this Article or any other provisions of this Indenture, but subject to Section 14.04 hereof, neither the Trustee nor any Paying Agent shall be charged with knowledge of the existence of any Senior Indebtedness or General Obligations or of any event which would prohibit the making of any payment of moneys to or by the Trustee or such Paying Agent, unless and until the Trustee or such Paying Agent shall have received written notice thereof from the Company or from the holder of any Senior Indebtedness or from the representative of any such holder or from any creditor in respect of General Obligations. SECTION 14.07. Right of Trustee To Hold Senior Indebtedness or General Obligations. The Trustee shall be entitled to all of the rights set forth in this Article in respect of any Senior Indebtedness or General Obligation at any time held by it in its individual capacity to the same extent as any other holder of such Senior Indebtedness or creditor in respect of such General Obligation and nothing in this Indenture shall be construed to deprive the Trustee of any of its rights as such holder or creditor. Nothing in this Article shall apply to claims of, or payments to, the Trustee under or pursuant to Section 8.07. SECTION 14.08. Article Fourteen Not To Prevent Defaults or Events of Default. The failure to make a payment pursuant to the Securities by reason of any provision in this Article shall not be construed as preventing the occurrence of a Default or an Event of Default. SECTION 14.09. Securities To Rank Pari Passu with Existing Subordinated Indebtedness; Payment of Proceeds in Certain Cases. (i) Subject to the provisions of this Section and to any provisions established or determined with respect to Securities of any series pursuant to Section 3.01, the Securities shall rank pari passu in right of payment with the Existing Subordinated Indebtedness. (ii) Upon the occurrence of any of the events specified in the first paragraph of Section 14.02, the provisions of that Section and the corresponding provisions of each indenture or other instrument or document establishing or governing the terms of any Existing Subordinated Indebtedness shall be given effect on a pro rata basis to determine the amount of cash, property or securities which may be payable or deliverable as between the holders of Senior Indebtedness, on the one hand, and the Holders of the Securities and holders of Existing Subordinated Indebtedness, on the other hand. (iii) If, after giving effect to the provisions of Section 14.02, and the respective corresponding provisions of each indenture or other instrument or document establishing or governing the terms of any Existing Subordinated Indebtedness on such pro rata basis, any amount of cash, property or securities shall be available for payment or distribution in respect of the Securities ("Excess Proceeds"), and any creditors in respect of General Obligations shall not have received payment in full of all amounts due or to become due on or in respect of such General Obligations (and provision shall not have been made for such payment in money or money's worth), then such Excess Proceeds shall first be applied (ratably with any amount of cash, property or securities available for payment or distribution in respect of any other indebtedness of the Company that by its express terms provides for the payment over of amounts corresponding to Excess Proceeds to creditors in respect of General Obligations) to pay or provide for the payment of the General Obligations remaining unpaid, to the extent necessary to pay all General Obligations in full, after giving effect to any concurrent payment or distribution to or for creditors in respect of General Obligations. Any Excess Proceeds remaining after payment (or provision for payment) in full of all General Obligations shall be available for payment or distribution in respect of the Securities. (iv) In the event that, notwithstanding the foregoing provisions of subsection (iii) of this Section, the Trustee or Holder of any Security shall, in the circumstances contemplated by such subsection, have received any payment or distribution of assets of the Company of any kind or character, whether in cash, property or securities, before all General Obligations are paid in full or payment thereof duly provided for, and if such fact shall, at or prior to the time of such payment or distribution have been made known to the Trustee or, as the case may be, such Holder, then and in such event, subject to any obligation that the Trustee or such Holder may have pursuant to Section 14.02, such payment or distribution shall be paid over or delivered forthwith to the trustee in bankruptcy, receiver, liquidating trustee, custodian, assignee, agent or other Person making payment or distribution of assets of the Company for payment in accordance with subsection (iii). (v) Subject to the payment in full of all General Obligations, the Holder of the Securities shall be subrogated (equally and ratably with the holders of all indebtedness of the Company that by its express terms provides for the payment over of amounts corresponding to Excess Proceeds to creditors in respect of General Obligations and is entitled to like rights of subrogation) to the rights of the creditors Page 52
in respect of General Obligations to receive payments or distributions of cash, property or securities applicable to the General Obligations until the principal of and interest on the Securities shall be paid in full. For purposes of such subrogation, no payments or distributions to creditors in respect of General Obligations of any cash, property or securities to which Holders of the Securities or the Trustee would be entitled except for the provisions of this Section, and no payments over pursuant to the provisions of this Section to creditors in respect of General Obligations by Holders of Securities or the Trustee, shall, as among the Company, its creditors (other than creditors in respect of General Obligations) and the Holders of Securities be deemed to be a payment or distribution by the Company to or on account of the Securities. (vi) The provisions of subsections (iii), (iv) and (v) of this Section are and are intended solely for the purpose of defining the relative rights of the Holders of the Securities, on the one hand, and the creditors in respect of General Obligations, on the other hand, after giving effect to the rights of the holders of Senior Indebtedness, as provided in this Article. Nothing contained in subsections (iii), (iv) and (v) of this Section is intended to or shall affect the relative rights against the Company of the Holders of the Securities and (a) the holders of Senior Indebtedness, (b) the holders of Existing Subordinated Indebtedness or (c) other creditors of the Company other than creditors in respect of General Obligations. ARTICLE FIFTEEN REPAYMENT AT THE OPTION OF HOLDERS SECTION 15.01. Applicability of Article. Securities of any series which are repayable at the option of the Holders thereof before their Stated Maturity shall be repaid in accordance with their terms and (except as otherwise specified pursuant to Section 3.01 for Securities of such series) in accordance with this Article. SECTION 15.02. Repayment of Securities. Each Security which is subject to repayment in whole or in part at the option of the Holder thereof on a Repayment Date shall be repaid at the applicable Repayment Price together with interest accrued to such Repayment Date as specified pursuant to Section 3.01. SECTION 15.03. Exercise of Option; Notice. Each Holder desiring to exercise such Holder's option for repayment shall, as conditions to such repayment, surrender the Security to be repaid in whole or in part together with written notice of the exercise of such option at any office or agency of the Company in a Place of Payment, not less than 30 nor more than 45 days prior to the Repayment Date; provided, however, that surrender of Bearer Securities together with written notice of exercise of such option shall be made at an office or agency located outside the United States except as otherwise provided in Section 5.02. Such notice, which shall be irrevocable, shall specify the principal amount of such Security to be repaid, which shall be equal to the minimum authorized denomination for such Security or an integral multiple thereof, and shall identify the Security to be repaid and, in the case of a partial repayment of the Security, shall specify the denomination or denominations of the Security or Securities of the same series to be issued to the Holder for the portion of the principal of the Security surrendered which is not to be repaid. If any Bearer Security surrendered for repayment shall not be accompanied by all unmatured coupons and all matured coupons in default, such Bearer Security may be paid after deducting from the Repayment Price an amount equal to the face amount of all such missing coupons, or the surrender of such missing coupon or coupons may be waived by the Company and the Trustee if there be furnished to them such security or indemnity as they may require to save each of them and any Paying Agent harmless. If thereafter the Holder of such Bearer Security shall surrender to the Trustee or any Paying Agent any such missing coupon in respect of which a deduction shall have been made from the Repayment Price, such Holder shall be entitled to receive the amount so deducted without interest thereon; provided, however, that interest represented by coupons shall be payable only at an office or agency located outside the United States except as otherwise provided in Section 5.02. The Company shall execute and the Trustee shall authenticate and deliver without service charge to the Holder of any Registered Security so surrendered a new Registered Security or Securities of the same series and tenor of any authorized denomination specified in the foregoing notice, in an aggregate principal amount equal to any portion of the principal of the Registered Security so surrendered which is not to be repaid. The Company shall execute and the Trustee shall authenticate and deliver without service charge to the Holder of any Bearer Security so surrendered a new Registered Security or Securities or new Bearer Security or Securities (and all appurtenant unmatured coupons and matured coupons in default) or any combination thereof of the same series and tenor of any authorized denomination or denominations specified in the foregoing notice, in an aggregate principal amount equal to any portion of the principal of the Security so surrendered which is not to be repaid; provided, however, that the issuance of a Registered Security therefor shall be subject to applicable laws and regulations, including provisions of the United States federal income tax laws and regulations in effect at the time of the exchange; neither the Company, the Trustee nor the Security Registrar shall issue Registered Securities for Bearer Securities if it has received an Opinion of Counsel that as a result of such issuance the Company would suffer adverse consequences under the United States federal income tax laws then in effect and the Company has delivered to the Trustee a Company Order directing the Trustee not to make such issuances thereafter unless and until the Trustee receives a subsequent Company Order to the contrary. The Company shall deliver copies of such Company Order to the Security Registrar. Page 53
For all purposes of this Indenture, unless the context otherwise requires, all provisions relating to the repayment of Securities shall relate, in the case of any Security repaid or to be repaid only in part, to the portion of the principal of such Security which has been or is to be repaid. SECTION 15.04. Election of Repayment by Remarketing Entities. The Company may elect, with respect to Securities of any series which are repayable at the option of the Holders thereof before their Stated Maturity, at any time prior to any Repayment Date to designate one or more Remarketing Entities to purchase, at a price equal to the Repayment Price, Securities of such series from the Holders thereof who give notice and surrender their Securities in accordance with Section 15.03. SECTION 15.05. Securities Payable on the Repayment Date. Notice of exercise of the option of repayment having been given and the Securities so to be repaid having been surrendered as aforesaid, such Securities shall, unless purchased in accordance with Section 15.04, on the Repayment Date become due and payable at the price therein specified and from and after the Repayment Date such Securities shall cease to bear interest and shall be paid on the Repayment Date, and the coupons for such interest appertaining to Bearer Securities so to be repaid, except to the extent provided above, shall be void, unless the Company shall default in the payment of such price, in which case the Company shall continue to be obligated for the principal amount of such Securities and shall be obligated to pay interest on such principal amount at the rate prescribed therefor by such Securities from time to time until payment in full of such principal amount. ARTICLE SIXTEEN MEETINGS OF HOLDERS OF SECURITIES SECTION 16.01. Purposes for Which Meetings May Be Called. If Securities of a series are issuable in whole or in part as Bearer Securities, a meeting of Holders of Securities of such series may be called at any time and from time to time pursuant to this Article to make, give or take any request, demand, authorization, direction, notice, consent, waiver or other Act provided by this Indenture to be made, given or taken by Holders of Securities of such series. SECTION 16.02. Call, Notice and Place of Meetings. (i) The Trustee may at any time call a meeting of Holders of Securities of any series issuable in whole or in part as Bearer Securities for any purpose specified in Section 16.01, to be held at such time and at such place in the City of Columbus, Ohio, the Borough of Manhattan, The City of New York, or in London as the Trustee shall determine. Notice of every meeting of Holders of Securities of any series, setting forth the time and the place of such meeting and in general terms the action proposed to be taken at such meeting, shall be given, in the manner provided in Section 1.06, not less than 21 nor more than 180 days prior to the date fixed for the meeting. (ii) In case at any time the Company, pursuant to a Board Resolution, or the Holders of at least 10% in principal amount of the Outstanding Securities of any such series shall have requested the Trustee to call a meeting of the Holders of Securities of such series for any purpose specified in Section 16.01, by written request setting forth in reasonable detail the action proposed to be taken at the meeting, and the Trustee shall not have made the first publication of the notice of such meeting within 21 days after receipt of such request or shall not thereafter proceed to cause the meeting to be held as provided herein, then the Company or the Holders of Securities of such series in the amount above specified, as the case may be, may determine the time and the place in the City of Columbus, Ohio, the Borough of Manhattan, The City of New York, or in London for such meeting and may call such meeting for such purposes by giving notice thereof as provided in subsection (i) of this Section. SECTION 16.03. Persons Entitled To Vote at Meetings. To be entitled to vote at any meeting of Holders of Securities of any series, a Person shall be (1) a Holder of one or more Outstanding Securities of such series, or (2) a Person appointed by an instrument in writing as proxy for a Holder or Holders of one or more Outstanding Securities of such series by such Holder or Holders. The only Persons who shall be entitled to be present or to speak at any meeting of Holders of Securities of any series shall be the Persons entitled to vote at such meeting and their counsel, any representatives of the Trustee and its counsel and any representatives of the Company and its counsel. SECTION 16.04. Quorum, Action. The Persons entitled to vote a majority in principal amount of the Outstanding Securities of a series shall constitute a quorum for a meeting of Holders of Securities of such series; provided, however, that if any action is to be taken at such meeting with respect to a consent or waiver which this Indenture expressly provides may be given by the Holders of a greater percentage in principal amount of the Outstanding Securities of a series, the Persons entitled to vote such greater percentage in principal amount of the Outstanding Securities of such series shall constitute a quorum. In the absence of a quorum within 30 minutes of the time appointed for any such meeting, the meeting shall, if convened at the request of Holders of Securities of such series, be dissolved. In the absence of a quorum in any other case the meeting may be adjourned for a period of not less than 10 days as determined by the chairperson of the meeting prior to the adjournment of such meeting. In the absence of a quorum at any such adjourned meeting, such adjourned meeting may be further adjourned for a period of not less than 10 days as determined by the chairperson of the meeting prior to the adjournment of such adjourned meeting. Notice of the reconvening of any adjourned meeting shall be given as provided in Section 16.02(i), except that such notice need be given only once not less than five days prior to the date Page 54
on which the meeting is scheduled to be reconvened. Notice of the reconvening of an adjourned meeting shall state expressly the percentage, as provided above, of the principal amount of the Outstanding Securities of such series which shall constitute a quorum. Except as limited by the provisos to Section 9.02, any resolution presented to a meeting or adjourned meeting duly reconvened at which a quorum is present as aforesaid may be adopted only by the affirmative vote of the Holders of a majority in principal amount of the Outstanding Securities of the series; provided, however, that, except as limited by the provisos to Section 9.02, any resolution with respect to any consent or waiver which this Indenture expressly provides may be given by the Holders of a greater percentage in principal amount of the Outstanding Securities of a series may be adopted at a meeting or an adjourned meeting duly reconvened and at which a quorum is present as aforesaid only by the affirmative vote of the Holders of such greater percentage in principal amount of the Outstanding Securities of that series; and provided further that, except as limited by the provisos to Section 9.02, any resolution with respect to any request, demand, authorization, direction, notice, consent, waiver or other Act which this Indenture expressly provides may be made, given or taken by the Holders of a specified percentage, which is less than a majority in principal amount of the Outstanding Securities of a series may be adopted at a meeting or an adjourned meeting duly reconvened and at which a quorum is present as aforesaid by the affirmative vote of the Holders of such specified percentage in principal amount of the Outstanding Securities of that series. Any resolution passed or decision taken at any meeting of Holders of Securities of any series duly held in accordance with this Section shall be binding on all the Holders of Securities of such series and the related coupons, whether or not present or represented at the meeting. SECTION 16.05. Determination of Voting Rights; Conduct and Adjournment of Meetings. (a) Notwithstanding any other provisions of this Indenture, the Trustee may make such reasonable regulations as it may deem advisable for any meeting of Holders of Securities of such series in regard to proof of the holding of Securities of such series and of the appointment of proxies and in regard to the appointment and duties of inspectors of votes, the submission and examination of proxies, certificates and other evidence of the right to vote, and such other matters concerning the conduct of the meeting as it shall deem appropriate. Except as otherwise permitted or required by any such regulations, the holding of Securities shall be proved in the manner specified in Section 1.04 and the appointment of any proxy shall be proved in the manner specified in Section 1.04 or, in the case of Bearer Securities, by having the signature of the person executing the proxy witnessed or guaranteed by any trust company, bank or banker authorized by Section 1.04 to certify to the holding of Bearer Securities. Such regulations may provide that written instruments appointing proxies, regular on their face, may be presumed valid and genuine without the proof specified in Section 1.04 or other proof. (b) The Trustee shall, by an instrument in writing, appoint a temporary chairperson of the meeting, unless the meeting shall have been called by the Company or by Holders of Securities as provided in Section 16.02(ii), in which case the Company or the Holders of Securities of the series calling the meeting, as the case may be, shall in like manner appoint a temporary chairperson. A permanent chairperson and a permanent secretary of the meeting shall be elected by vote of the Persons entitled to vote a majority in principal amount of the Outstanding Securities of such series represented at the meeting. (c) At any meeting each Holder of a Security of such series or proxy shall be entitled to one vote for each $1,000 principal amount (or the equivalent in ECU, any other composite currency or a Foreign Currency) of Securities of such series held or represented by him; provided, however, that no vote shall be cast or counted at any meeting in respect of any Security challenged as not Outstanding and ruled by the chairperson of the meeting not to be Outstanding. The chairperson of the meeting shall have no right to vote, except as a Holder of a Security of such series or proxy. (d) Any meeting of Holders of Securities of any series duly called pursuant to Section 16.02 at which a quorum is present may be adjourned from time to time by Persons entitled to vote a majority in principal amount of the Outstanding Securities of such series represented at the meeting; and the meeting may be held as so adjourned without further notice. SECTION 16.06. Counting Votes and Recording Action of Meetings. The vote upon any resolution submitted to any meeting of Holders of Securities of any series shall be by written ballots on which shall be subscribed the signatures of the Holders of Securities of such series or of their representatives by proxy and the principal amounts and serial numbers of the Outstanding Securities of such series held or represented by them. The permanent chairperson of the meeting shall appoint two inspectors of votes who shall count all votes cast at the meeting for or against any resolution and who shall make and file with the secretary of the meeting their verified written reports in triplicate of all votes cast at the meeting. A record, at least in triplicate, of the proceedings of each meeting of Holders of Securities of any series shall be prepared by the secretary of the meeting and there shall be attached to said record the original reports of the inspectors of votes on any vote by ballot taken thereat and affidavits by one or more persons having knowledge of the facts setting forth a copy of the notice of the meeting and showing that said notice was given as provided in Section 16.02 and, if applicable, Section 16.04. Each copy shall be signed and verified by the affidavits of the permanent chairperson and secretary of the meeting and one such copy shall be delivered to the Company, and another to the Trustee to be preserved by the Trustee, the latter to have attached thereto the ballots voted at the meeting. Any record so signed and verified shall be conclusive evidence of the matters therein stated. Page 55
ARTICLE SEVENTEEN MISCELLANEOUS SECTION 17.01. Counterparts. This Indenture may be executed in any number of counterparts, each of which shall be an original; but such counterparts shall together constitute but one and the same instrument. The Chase Manhattan Bank hereby accepts the trusts in this Indenture declared and provided, upon the terms and conditions hereinabove set forth. IN WITNESS WHEREOF, the parties hereto have caused this Indenture to be duly executed, and their respective corporate seals to be hereunto affixed and attested, all as of the day and year first above written. BANC ONE CORPORATION, by________________________________ Attest: ________________________ [CORPORATE SEAL] THE CHASE MANHATTAN BANK, Trustee, by__________________________________ Attest: ________________________ [CORPORATE SEAL] STATE OF OHIO, ) ) ss.: COUNTY OF FRANKLIN ) On this day of February, 1997, before me personally came to me known, , who, being by me duly sworn, did depose and say that he resides at ; that he is Treasurer of BANC ONE CORPORATION, one of the corporations described in and which executed the foregoing instrument; that he knows the corporate seal of said corporation; that the seal affixed to said instrument is such corporate seal; that it was so affixed by authority of the Board of Directors of said corporation; and that he signed his name thereto by like authority. Notary Public [Notarial Seal] STATE OF NEW YORK, )) ss.: COUNTY OF NEW YORK,) On this day of February, 1997 before me personally appeared , to me known, who, being by me duly sworn, did depose and say that he resides at ; that he is a of THE CHASE MANHATTAN BANK, one of the parties described in and which executed the foregoing instrument; that he knows the corporate seal of said corporation; that the seal affixed to said instrument is such corporate seal; that it was so affixed by authority of the Board of Directors of said corporation; and that he signed his name thereto by like authority. Notary Public [Notarial Seal] Page 56
Exhibit 4.10(b) FIRST SUPPLEMENTAL INDENTURE, dated as of October 2, 1998, between BANK ONE CORPORATION, a corporation duly organized and existing under the laws of the State of Delaware ("ONE"), having its principal offices at One First National Plaza, Chicago, Illinois 60670 and THE CHASE MANHATTAN BANK, a banking corporation duly organized and existing under the laws of the State of New York, as trustee (the "Trustee"). WHEREAS, BANC ONE CORPORATION ("BANC ONE") has heretofore executed and delivered to the Trustee an Indenture, dated as of March 3, 1997 (the "Indenture"), providing for the issuance from time to time of Subordinated Debt Securities (herein and therein called the "Securities"); and WHEREAS, effective as of October 2, 1998, BANC ONE merged with and into ONE, a wholly owned subsidiary of BANC ONE; and WHEREAS, Section 10.1 of the Indenture provides for the execution of an indenture supplemental to the Indenture, in form satisfactory to the Trustee, to evidence the succession of any successor corporation to BANC ONE under the Indenture and the assumption of such successor corporation of the covenants of BANC ONE in the Indenture and in the Securities pursuant to such Indenture; and WHEREAS, all things necessary to make this First Supplemental Indenture a valid agreement of ONE, as the successor corporation to BANC ONE, under the Indenture, in accordance with its terms, have been done. NOW, THEREFORE, ONE and the Trustee hereby agree as follows: 1. From and after the date of this First Supplemental Indenture, ONE shall for all purposes be deemed to be the "Company", as such term is defined in the Indenture and the Securities, as if ONE was originally so named in the Indenture and the Securities, and, as such, ONE hereby expressly assumes, from and after the date of this First Supplemental Indenture, the due and punctual payment of the principal
of, premium, if any, and interest on all of the Securities and the performance of every covenant of the Indenture, as supplemented by this First Supplemental Indenture, on the part of the ONE to be performed or observed. 2. All provisions of this First Supplemental Indenture shall be deemed to be incorporated in, and made a part of, the Indenture; and the Indenture, as supplemented by this First Supplemental Indenture, shall be read, taken and construed as one and the same instrument. 3. The Trustee accepts the trusts created by the Indenture, as supplemented by this First Supplemental Indenture, and agrees to perform the same upon the terms and conditions in the Indenture, as supplemented by this First Supplemental Indenture. 4. The recitals contained in this First Supplemental Indenture shall be taken as statements of ONE, and the Trustee assumes no responsibility for their correctness. The Trustee makes no representations as to the validity or sufficiency of this First Supplemental Indenture. 5. All capitalized terms used and not defined herein shall have the respective meanings assigned to them in the Indenture. 6. This First Supplemental Indenture shall be governed by and construed in accordance with the laws of the State of New York. 7. This First Supplemental Indenture may be executed in any number of counterparts, each of which when so executed shall be deemed to be an original, but all such counterparts shall together constitute but one and the same instrument. -2-
IN WITNESS WHEREOF, the parties hereto have caused the First Supplemental Indenture to be duly executed, and their respective seals to be hereunto affixed and attested, all as of the date first above written. BANK ONE CORPORATION ATTEST: ____________________________ By: _____________________________ Title: _____________________ Title: Chief Financial Officer [Corporate Seal] THE CHASE MANHATTAN BANK, as Trustee ATTEST: ______________________________ By: _____________________________ Title: _______________________ Title: __________________________ [Corporate Seal] -3-
STATE OF ILLINOIS ) ) ss: COUNTY OF COOK ) On the 2nd day of October, 1998, before me personally came Robert A. Rosholt, to me known, who, being duly sworn, did depose and say that he is the Chief Financial Officer of BANK ONE CORPORATION, one of the corporations described in and which executed the foregoing instrument; that he knows the seal of said corporation; that the seal affixed to said instrument is such corporate seal; that it was so affixed by authority of the Board of Directors of said corporation; and that he signed his name thereto by like authority. ____________________________ Notary Public My Commission Expires:__________ -4-
STATE OF ) ) ss: COUNTY OF ) On the ___________ day of ___________ before me personally came __________________ , to me known, who, being duly sworn, did depose and say that he is a _____________________of THE CHASE MANHATTAN BANK, one of the corporations described in and which executed the foregoing instrument; that he knows the seal of said corporation; that the seal affixed to said instrument is such corporate seal; that it was so affixed by authority of the Board of Directors of said corporation; and that he signed his name thereto by like authority. ______________________________ Notary Public My Commission Expires:__________ -5-
Exhibit 4.11(a) BANC ONE CORPORATION AND CITIBANK, N.A. TRUSTEE INDENTURE DATED AS OF JULY 1, 1995 SUBORDINATED DEBT SECURITIES 1
TABLE OF CONTENTS 1/ Page ---- ARTICLE ONE Definitions and Other Provisions of General Application SECTION 1.01. Definitions.............................................. 1 "this Indenture" and certain other terms.................................................. 1 "Act".................................................... 2 "Affiliate".............................................. 2 "Authenticating Agent"................................... 3 "Authorized Newspaper"................................... 3 "Authorized Officer"..................................... 3 "Bearer Security"........................................ 3 "Board of Directors"..................................... 3 "Board Resolution"....................................... 3 "Business Day"........................................... 3 "CEDEL; CEDEL S.A."...................................... 3 "Commission"............................................. 3 "Common Depositary"...................................... 4 "Company"................................................ 4 "Company Request" and "Company Order"................................................. 4 "corporation"............................................ 4 "coupon"................................................. 4 "Default"................................................ 4 "Defaulted Interest"..................................... 4 "Depositary"............................................. 4 "Designated Currency".................................... 4 "Dollar"................................................. 5 "ECU".................................................... 5 "Euroclear".............................................. 5 "European Communities"................................... 5 "Event of Default"....................................... 5 "Exchange Act"........................................... 5 "Exchange Rate".......................................... 5 "Exchange Rate Officer's Certificate"........................................... 5 "Existing Subordinated Indebtedness"..................... 6 "Foreign Currency"....................................... 6 "General Obligations".................................... 6 "Global Exchange Rate"................................... 6 1/ THIS TABLE OF CONTENTS IS NOT PART OF THE INDENTURE. 2
CONTENTS, P. 2 Page ---- "Global Security"........................................ 6 "Holder"................................................. 7 "interest"............................................... 7 "Interest Payment Date".................................. 7 "Maturity"............................................... 7 "Officers' Certificate".................................. 7 "Opinion of Counsel"..................................... 7 "Original Issue Discount Security"....................... 7 "Outstanding"............................................ 7 "Paying Agent"........................................... 8 "Person"................................................. 9 "Place of Payment"....................................... 9 "Predecessor Security"................................... 9 "Principal Corporate Trust Office"....................... 9 "Principal Paying Agent"................................. 9 "Redemption Date"........................................ 9 "Redemption Price"....................................... 9 "Registered Security".................................... 9 "Regular Record Date".................................... 9 "Remarketing Entity"..................................... 10 "Repayment Date"......................................... 10 "Repayment Price"........................................ 10 "Responsible Officer".................................... 10 "Security"; "Securities"................................. 10 "Security Register"...................................... 10 "Security Registrar"..................................... 10 "Senior Indebtedness".................................... 10 "Special Record Date".................................... 11 "Stated Maturity"........................................ 11 "Subsidiary of the Company" or "Subsidiary"........................................... 11 "Trustee"................................................ 11 "Trust Indenture Act" or "TIA"........................... 12 "United States".......................................... 12 "United States Alien".................................... 12 "vice president"......................................... 12 SECTION 1.02. Compliance Certificates and Opinions..................... 12 SECTION 1.03. Form of Documents Delivered to Trustee................................................ 13 SECTION 1.04. Acts of Holders.......................................... 14 SECTION 1.05. Notices, etc., to Trustee and Company................................................ 17 SECTION 1.06. Notices to Holders; Waiver............................... 18 SECTION 1.07. Language of Notices, Etc................................. 19 SECTION 1.08. Conflict with Trust Indenture Act........................ 19 3
CONTENTS, P. 3 Page ---- SECTION 1.09. Effect of Headings and Table of Contents............................................... 19 SECTION 1.10. Successors and Assigns................................... 19 SECTION 1.11. Separability Clause...................................... 20 SECTION 1.12. Benefits of Indenture.................................... 20 SECTION 1.13. Legal Holidays........................................... 20 SECTION 1.14. Governing Law............................................ 20 ARTICLE TWO Security Forms SECTION 2.01. Form Generally........................................... 20 SECTION 2.02. Form of Securities....................................... 21 SECTION 2.03. Form of Trustee's Certificate of Authentication......................................... 22 SECTION 2.04. Global Securities........................................ 22 ARTICLE THREE The Securities SECTION 3.01. Title and Terms.......................................... 23 SECTION 3.02. Denominations............................................ 26 SECTION 3.03. Execution, Authentication, Delivery and Dating............................................. 26 SECTION 3.04. Temporary Securities..................................... 30 SECTION 3.05. Registration, Registration of Transfer and Exchange.................................. 34 SECTION 3.06. Mutilated, Destroyed, Lost and Stolen Securities............................................. 39 SECTION 3.07. Payment of Interest; Interest Rights Preserved....................................... 41 SECTION 3.08. Persons Deemed Owners.................................... 43 SECTION 3.09. Cancellation............................................. 44 SECTION 3.10. Computation of Interest.................................. 44 SECTION 3.11. Forms of Certification................................... 44 SECTION 3.12. Judgments................................................ 45 4
CONTENTS, P. 4 Page ---- ARTICLE FOUR Redemption of Securities SECTION 4.01. Applicability of Article................................ 46 SECTION 4.02. Election to Redeem; Notice to Trustee............................................... 46 SECTION 4.03. Selection by Security Registrar of Securities to be Redeemed............................. 46 SECTION 4.04. Notice of Redemption.................................... 47 SECTION 4.05. Deposit of Redemption Price............................. 48 SECTION 4.06. Securities Payable on Redemption Date.................................................. 48 SECTION 4.07. Securities Redeemed in Part............................. 49 SECTION 4.08. Redemption Suspended During Event of Default............................................... 50 ARTICLE FIVE Covenants SECTION 5.01. Payment of Principal, Premium and Interest.............................................. 50 SECTION 5.02. Maintenance of Office or Agency......................... 51 SECTION 5.03. Money for Security Payments to Be Held in Trust......................................... 53 SECTION 5.04. Additional Amounts...................................... 55 SECTION 5.05. Statement as to Compliance.............................. 56 SECTION 5.06. Maintenance of Corporate Existence, Rights and Franchises................................. 56 ARTICLE SIX Holder's Lists and Reports by Trustee and Company SECTION 6.01. Company to Furnish Trustee Names and Addresses of Holders.............................. 57 SECTION 6.02. Preservation of Information; Communications to Holders............................. 57 SECTION 6.03. Reports by Trustee...................................... 59 SECTION 6.04. Reports by Company...................................... 60 5
CONTENTS, P. 5 Page ---- ARTICLE SEVEN Remedies SECTION 7.01. Events of Default....................................... 61 SECTION 7.02. Acceleration of Maturity; Rescission and Annulment......................................... 62 SECTION 7.03. Collection of Indebtedness and Suits for Enforcement by Trustee............................ 63 SECTION 7.04. Trustee May File Proofs of Claim........................ 64 SECTION 7.05. Trustee May Enforce Claims Without Possession of Securities.............................. 65 SECTION 7.06. Application of Money Collected.......................... 65 SECTION 7.07. Limitation on Suits..................................... 66 SECTION 7.08. Unconditional Right of Holders to Receive Principal, Premium and Interest.......................................... 68 SECTION 7.09. Restoration of Rights and Remedies...................... 68 SECTION 7.10. Rights and Remedies Cumulative.......................... 68 SECTION 7.11. Delay or Omission Not Waiver............................ 68 SECTION 7.12. Control by Noteholders.................................. 69 SECTION 7.13. Waiver of Past Defaults................................. 69 SECTION 7.14. Undertaking for Costs................................... 70 SECTION 7.15. Waiver of Stay or Extension Laws........................ 70 ARTICLE EIGHT The Trustee SECTION 8.01. Certain Duties and Responsibilities..................... 71 SECTION 8.02. Notice of Default....................................... 72 SECTION 8.03. Certain Rights of Trustee............................... 73 SECTION 8.04. Not Responsible for Recitals or Issuance of Notes..................................... 74 SECTION 8.05. May Hold Securities..................................... 74 SECTION 8.06. Money Held in Trust..................................... 74 SECTION 8.07. Compensation and Reimbursement.......................... 75 SECTION 8.08. Disqualification; Conflicting Interests............................................. 76 SECTION 8.09. Corporate Trustee Required; Eligibility........................................... 76 SECTION 8.10. Resignation and Removal; Appointment of Successor.......................................... 77 SECTION 8.11. Acceptance of Appointment by Successor............................................. 79 6
CONTENTS, P. 6 Page ---- SECTION 8.12. Merger, Conversion, Consolidation or Succession to Business of Trustee............................................... 80 SECTION 8.13. Preferential Collection of Claims against Company....................................... 81 SECTION 8.14. Appointment of Authenticating Agents.................... 81 ARTICLE NINE Supplemental Indentures SECTION 9.01. Supplemental Indentures Without Consent of Holders.................................... 83 SECTION 9.02. Supplemental Indentures With Consent of Holders.................................... 85 SECTION 9.03. Execution of Supplemental Indentures.................... 87 SECTION 9.04. Effect of Supplemental Indentures....................... 87 SECTION 9.05. Conformity with Trust Indenture Act..................... 87 SECTION 9.06. Reference in Securities to Supplemental Indentures............................... 87 SECTION 9.07. Subordination Unimpaired................................ 87 ARTICLE TEN Consolidation, Merger, Conveyance or Transfer SECTION 10.01. Company May Consolidate, etc., Only on Certain Terms...................................... 88 SECTION 10.02. Successor Corporation Substituted....................... 88 ARTICLE ELEVEN Satisfaction and Discharge SECTION 11.01. Satisfaction and Discharge of Indenture............................................. 89 SECTION 11.02. Application of Trust Money.............................. 90 SECTION 11.03. Reinstatement........................................... 91 7
CONTENTS, P. 7 Page ---- ARTICLE TWELVE Immunity of Incorporations, Stockholders, Officers and Directors SECTION 12.01. Exemption from Individual Liability.................... 91 ARTICLE THIRTEEN Sinking Funds SECTION 13.01. Applicability of Article................................ 92 SECTION 13.02. Satisfaction of Sinking Fund Payments with Securities.............................. 92 SECTION 13.03. Redemption of Securities for Sinking Fund.......................................... 93 ARTICLE FOURTEEN Subordination of Securities SECTION 14.01. Agreement to Subordinate................................ 93 SECTION 14.02. Distribution on Dissolution, Liquidation and Reorganization; Subrogation of Securities............................. 93 SECTION 14.03. Payments on Securities Prohibited During Event of Default under Senior Indebtedness................................... 98 SECTION 14.04. Payments on Securities Permitted........................ 98 SECTION 14.05. Authorization of Holders to Trustee to Effect Subordination......................... 99 SECTION 14.06. Notice To Trustee....................................... 99 SECTION 14.07. Right of Trustee to Hold Senior Indebtedness or General Obligations........................................... 99 SECTION 14.08. Article Fourteen Not to Prevent Defaults or Events of Default......................... 99 SECTION 14.09. Securities to Rank Pari Passu with Existing Subordinated Indebtedness; Payment of Proceeds in Certain Cases...................................... 100 8
CONTENTS, P. 8 Page ---- ARTICLE FIFTEEN Repayment at the Option of Holders SECTION 15.01. Applicability of Article................................ 102 SECTION 15.02 Repayment of Securities................................. 102 SECTION 15.03. Exercise of Option; Notice.............................. 102 SECTION 15.04. Election of Repayment by Remarketing Entities.................................. 104 SECTION 15.05. Securities Payable on the Repayment Date........................................ 104 ARTICLE SIXTEEN Meetings of Holders of Securities SECTION 16.01. Purposes for Which Meetings May Be...................... 105 Called................................. .............. SECTION 16.02. Call, Notice and Place of Meetings...................... 105 SECTION 16.03. Persons Entitled to Vote at Meetings.............................................. 106 SECTION 16.04. Quorum; Action.......................................... 106 SECTION 16.05. Determination of Voting Rights; Conduct and Adjournment of Meetings.............................................. 107 SECTION 16.06. Counting Votes and Recording Action of Meetings.................................... 108 ARTICLE SEVENTEEN Miscellaneous SECTION 17.01. Counterparts............................................ 109 TESTIMONIUM.............................................................. 110 SIGNATURES AND SEALS..................................................... 110 ACKNOWLEDGMENTS.......................................................... 111 EXHIBIT A. Form of Certificate to be Given by Person Entitled to Receive Bearer Security EXHIBIT B. Form of Certificate to be Given by Euro-clear and CEDEL S.A. in Connection with the Exchange of a Portion of a Temporary Global Security 9
CONTENTS, P. 9 Page ---- EXHIBIT C. Form of Certificate to be Given by Euro-clear and CEDEL S.A. to Obtain Interest Prior to an Exchange Date EXHIBIT D. Form of Certificate to be Given by Beneficial Owners to Obtain Interest 10
CONTENTS, P. 10 TABLE SHOWING REFLECTION IN INDENTURE OF CERTAIN PROVISIONS OF TRUST INDENTURE ACT OF 1939 Reflected in Indenture ----------------------- Section ----------------------- TIA (S)310(a)(1)........................ 8.09 (a)(2)........................ 8.09 (a)(3)........................ Not Applicable (a)(4)........................ Not Applicable (a)(5)........................ 8.09 (b) ........................ 8.08 8.10 (c) ........................ Not Applicable (S)311(a) ........................ 8.13 (b) ........................ 8.13 (S)312(a) ........................ 6.01 6.02(i) (b) ........................ 6.02(ii) (c) ........................ 6.02(iii) (S)313(a) ........................ 6.03(i) (b) ........................ 6.03(ii) (c) ........................ 6.03(i), (ii) and (iii) (d) ........................ 6.03(iii) (S)314(a) ........................ 6.04 5.05 (b) ........................ Not Applicable (c)(1)........................ 1.02 (c)(2)........................ 1.02 (c)(3)........................ Not Applicable (d) ........................ Not Applicable (e) ........................ 1.02 (f) ........................ Not Applicable (S)315(a) ........................ 8.01(i) ........................ 8.01(iii) (b) ........................ 8.02 (c) ........................ 8.01(ii) (d) ........................ 8.01 (d)(1)........................ 8.01(i) (d)(2)........................ 8.01(iii)(b) (d)(3)........................ 8.01(iii)(c) (e) ........................ 7.14 (S)316(a) ........................ 1.01 11
CONTENTS, P. 11 Reflected in Indenture ----------------------- Section ----------------------- (S)316(a)(1)(A)...................... 7.02 7.12 (a)(1)(B)...................... 7.13 (a)(2) ...................... Not Applicable (b) ...................... 7.08 (c) ...................... 1.04(viii) (S)317(a)(1) ...................... 7.03 (a)(2) ...................... 7.04 (b) ...................... 5.03 (S)318(a) ...................... 1.08 (c) ...................... 1.08 12
THIS INDENTURE is entered into as of July 1, 1995, between BANC ONE CORPORATION, a corporation organized and existing under the laws of the State of Ohio (hereinafter called the "Company"), having its principal executive office at 100 East Broad Street, Columbus, Ohio 43271, and CITIBANK, N.A., a national banking association (hereinafter called the "Trustee"), having its principal corporate trust office at 120 Wall Street, New York, New York 10043. RECITALS OF THE COMPANY The Company deems it necessary from time to time to issue its unsecured subordinated debentures, notes, bonds and other evidences of indebtedness to be issued in one or more series (hereinafter called the "Securities") as hereinafter set forth, and to provide therefor the Company has duly authorized the execution and delivery of this Indenture. All things necessary to make this Indenture a valid agreement of the Company, in accordance with its terms, have been done. NOW, THEREFORE, THIS INDENTURE WITNESSETH: For and in consideration of the premises and the purchase of the Securities by the Holders thereof, it is mutually covenanted and agreed, for the equal and proportionate benefit of all Holders of the Securities or of any series thereof, as follows: ARTICLE ONE DEFINITIONS AND OTHER PROVISIONS OF GENERAL APPLICATION SECTION 1.01. Definitions. For all purposes of this Indenture, except as otherwise expressly provided or unless the context otherwise requires: (i) the term "this Indenture" means this instrument as originally executed or as it may from time to time be supplemented or amended by one or more indentures supplemental hereto entered into pursuant to the applicable provisions hereof and shall include the terms of particular series of Securities established as contemplated by Section 3.01; (ii) all references in this instrument to designated "Articles", "Sections" and other subdivisions are to the designated Articles, Sections and other subdivisions of this Indenture. The words "herein", "hereof" and "hereunder" and other words of similar import refer to this Indenture as a whole and not to any particular Article, Section or other subdivision; (iii) the terms defined in this Article have the meanings assigned to them in this Article and include the plural as well as the singular; (iv) all other terms used herein which are defined in the Trust Indenture Act, either directly or by reference therein, have the meanings assigned to them therein; and (V) all accounting terms not otherwise defined herein have the meanings assigned to them in accordance with generally accepted accounting principles, and, except as may be otherwise expressly provided herein or in one or more indentures supplemental hereto, the term "generally accepted accounting principles" with respect to any computation required or permitted hereunder shall mean such accounting principles as are generally accepted at the date of such computation. "Act", when used with respect to any Holder, has the meaning specified in Section 1.04. "Affiliate" of any specified Person means any other Person directly or indirectly controlling or controlled by or under direct or indirect common control with such specified Person. For the purposes of this definition, "control" when used with respect to any specified Person means the power to direct the management and policies of such Person, directly or indirectly, whether through the ownership of voting securities, by contract or otherwise; and the terms "controlling" and "controlled" have meanings correlative to the foregoing. "Authenticating Agent" means any Person authorized to act on behalf of the Trustee to authenticate Securities pursuant to Section 8.14. "Authorized Newspaper" means a newspaper, in an official language of the country of publication or in the English language, customarily published on each Business Day, whether or not published on Saturdays, Sundays or holidays, and of general circulation in the place in connection with which the term is used or in the financial community of such place. Where successive publications are required to be made in Authorized Newspapers, the successive publications may be made in the same or in different newspapers in the same city meeting the foregoing requirements and in each case on any Business Day. "Authorized Officer" means the Chairman of the Board, the President, any Vice Chairman of the Board, any Vice President, the Treasurer, the Secretary, the Comptroller, any Assistant Comptroller, any Assistant Treasurer or any Assistant Secretary of the Company. 13
"Bearer Security" means any Security in the form established pursuant to Section 2.02 which is payable to bearer, including, without limitation, unless the context otherwise indicates, a Security in global bearer form. "Board of Directors" means either the board of directors of the Company or any duly authorized committee of that board. "Board Resolution" means a copy of a resolution certified by the Secretary or an Assistant Secretary of the Company to have been duly adopted by the Board of Directors and to be in full force and effect on the date of such certification, and delivered to the Trustee. "Business Day" means any day, other than a Saturday or Sunday, on which banking institutions in the City of Columbus, Ohio and any Place of Payment for the Securities are open for business. "CEDEL" or "CEDEL S.A." means Cedel Bank, societe anonymne or its successors. "Commission" means the Securities and Exchange Commission, as from time to time constituted, created under the Exchange Act, or if any time after the execution and delivery of this instrument such Commission is not existing and performing the duties now assigned to it under the Trust Indenture Act, then the body performing such duties at such time. "Common Depositary" has the meaning specified in Section 3.04(b)(ii). "Company" means the Person named as the "Company" in the first paragraph of this instrument until any successor corporation shall have become such pursuant to the applicable provisions of this Indenture, and thereafter "Company" shall mean any such successor corporation. "Company Request" and "Company Order" mean, respectively, a written request or order signed in the name of the Company by its Chairman of the Board, its President, a Vice Chairman of the Board, or a Vice President, and by its Treasurer, an Assistant Treasurer, its Comptroller, an Assistant Comptroller, its Secretary or an Assistant Secretary, and delivered to the Trustee. "corporation" includes corporations, associations, companies and business trusts. "coupon" means any interest coupon appertaining to a Bearer Security. "Default" has the meaning specified in Section 7.07. "Defaulted Interest" has the meaning specified in Section 3.07. "Depositary" means, with respect to the Securities of any series issuable or issued in the form of a Global Security, the Person designated as Depositary by the Company pursuant to Section 3.01 until a successor Depositary shall have been appointed pursuant to Section 3.05, and thereafter "Depositary" shall mean or include each Person who is then a Depositary hereunder, and if at any time there is more than one such Person, "Depositary" as used with respect to the Securities of any such series shall mean the Depositary with respect to the Securities of that series. "Designated Currency" has the meaning specified in Section 3.12. "Dollar" or "$" means the coin or currency of the United States of America as at the time of payment is legal tender for the payment of public and private debts. "ECU" means the European Currency Unit as defined and revised from time to time by the Council of the European Communities. "Euroclear" means Morgan Guaranty Trust Company of New York, Brussels Office, as operator of the Euroclear System. "European Communities" means the European Economic Community, the European Coal and Steel Community and the European Atomic Energy Community. "Event of Default" has the meaning specified in Section 7.01. "Exchange Act" means the Securities Exchange Act of 1934, as amended from time to time, and any statute successor thereto. "Exchange Rate" shall have the meaning specified as contemplated in Section 3.01. "Exchange Rate Agent" shall have the meaning specified as contemplated in Section 3.01. 14
"Exchange Rate Officer's Certificate" with respect to any date for the payment of principal of (and premium, if any) and interest on any series of Securities, means a certificate setting forth the applicable Exchange Rate and the amounts payable in Dollars and Foreign Currencies in respect of the principal of (and premium, if any) and interest on Securities denominated in ECU, any other composite currency or Foreign Currency, and signed by the Chairman of the Board, a Vice Chairman of the Board, the President, any Vice President, the Treasurer or any Assistant Treasurer of the Company or the Exchange Rate Agent appointed pursuant to Section 3.01 and delivered to the Trustee. "Existing Subordinated Indebtedness" means, unless otherwise determined with respect to any series of Securities pursuant to Section 3.01, the Company's 7.25% Subordinated Notes Due August 1, 2002, the Company's 8.74% Subordinated Notes Due September 15, 2003, the Company's 9.875% Subordinated Notes Due March 1, 2009, and the Company's 10.00% Subordinated Notes Due August 15, 2010. "Foreign Currency" means a currency issued by the government of any country other than the United States of America. "General Obligations" means, unless otherwise determined with respect to any series of Securities pursuant to Section 3.01, all obligations of the Company to make payment on account of claims in respect of derivative products such as interest and foreign exchange rate contracts, commodity contracts and similar arrangements, other than (i) obligations on account of Senior Indebtedness, (ii) obligations on account of indebtedness for money borrowed ranking pari passu with or subordinate to the Securities and (iii) obligations which by their terms are expressly stated not to be superior in right of payment to the Securities or to rank on a parity with the Securities; provided, however, that notwithstanding the foregoing, in the event that any rule, guideline or interpretation promulgated or issued by the Board of Governors of the Federal Reserve System (or other competent regulatory agency or authority), as from time to time in effect, establishes or specifies criteria for the inclusion in regulatory capital of subordinated debt of a bank holding company requiring that such subordinated debt be subordinated to obligations to creditors in addition to those set forth above, then the term "General Obligations" shall also include such additional obligations to creditors, as from time to time in effect pursuant to such rules, guidelines or interpretations. For purposes of this definition, "claim" shall have the meaning assigned thereto in Section 101(4) of the Bankruptcy Code of 1978, as amended to the date of this instrument. "Global Exchange Date" has the meaning specified in Section 3.04(b)(iv). "Global Security" means a Security issued to evidence all or a part of a series of Securities in accordance with Section 3.03. "Holder", with respect to a Registered Security, means a Person in whose name such Registered Security is registered in the Security Register and, with respect to a Bearer Security (or any temporary Global Security) or a coupon, means the bearer thereof. "interest", when used with respect to an Original Issue Discount Security which by its terms bears interest only after Maturity, means interest payable after Maturity. "Interest Payment Date", when used with respect to any series of Securities, means the Stated Maturity of an installment of interest on such Securities. "Maturity", when used with respect to any Security, means the date on which the principal of such Security (or any installment of principal) becomes due and payable as therein or herein provided, whether at the Stated Maturity or by declaration of acceleration, call for redemption or otherwise. "Officers' Certificate" means a certificate signed by the Chairman of the Board, the President, a Vice Chairman of the Board, or a Vice President, and by the Treasurer, an Assistant Treasurer, the Comptroller, an Assistant Comptroller, the Secretary or an Assistant Secretary of the Company, and delivered to the Trustee. Each such certificate shall contain the statements set forth in Section 1.02, if applicable. "Opinion of Counsel" means a written opinion of counsel, who may (except as otherwise expressly provided in this Indenture) be an employee of the Company, and who shall be reasonably acceptable to the Trustee. Each such opinion shall contain the statements set forth in Section 1.02, if applicable. "Original Issue Discount Security" means any Security which provides for an amount less than the principal amount thereof to be due and payable upon a declaration of acceleration of the Maturity thereof pursuant to Section 7.02. "Outstanding" when used with respect to Securities or Securities of any series, means, as of the date of determination, all such Securities theretofore authenticated and delivered under this Indenture, except: (i) such Securities theretofore canceled by the Trustee or delivered to the Trustee for cancellation; 15
(ii) such Securities for whose payment or redemption money in the necessary amount has been theretofore deposited with the Trustee or any Paying Agent (other than the Company) in trust or set aside and segregated in trust by the Company (if the Company shall act as its own Paying Agent) for the Holders of such Securities; provided that, if such Securities are to be redeemed, notice of such redemption has been duly given pursuant to this Indenture or provision therefor satisfactory to the Trustee has been made; and (iii) such Securities in lieu of which other Securities have been authenticated and delivered pursuant to Section 3.06 of this Indenture; provided, however, that in determining whether the Holders of the requisite principal amount of such Securities Outstanding have given any request, demand, authorization, direction, notice, consent or waiver hereunder or whether a quorum is present at a meeting of Holders of Securities, the principal amount of Original Issue Discount Securities that shall be deemed to be Outstanding for such purposes shall be the amount of the principal thereof that would be due and payable as of the date of such determination upon a declaration of acceleration of the Maturity thereof pursuant to Section 7.02, and Securities owned by the Company or any other obligor upon the Securities or any Affiliate of the Company or such other obligor shall be disregarded and deemed not to be Outstanding, except that, in determining whether the Trustee shall be protected in relying upon any such request, demand, authorization, direction, notice, consent or waiver, only Securities which a Responsible Officer of the Trustee actually knows to be so owned shall be disregarded. Securities so owned which have been pledged in good faith may be regarded as Outstanding if the pledgee establishes to the satisfaction of the Trustee the pledgee's right so to act with respect to such Securities and that the pledgee is not the Company or any other obligor upon the Securities or any Affiliate of the Company or such other obligor. "Paying Agent" means any Person authorized by the Company to pay the principal of, premium, if any, or interest on any Securities or any coupons appertaining thereto on behalf of the Company. "Person" means any individual, corporation, partnership, joint venture, association, joint-stock company, trust, unincorporated organization or government or any agency or political subdivision thereof. "Place of Payment", when used with respect to the Securities of any series, means the place or places where, subject to the provisions of Section 5.02, the principal of (and premium, if any) and interest on the Securities of that series are payable as specified in accordance with Section 3.01. "Predecessor Security" of any particular Security means every previous Security evidencing all or a portion of the same debt as that evidenced by such particular Security; and for the purposes of this definition, any Security authenticated and delivered under Section 3.06 in lieu of a mutilated, destroyed, lost or stolen Security shall be deemed to evidence the same debt as the mutilated, destroyed, lost or stolen Security. "Principal Corporate Trust Office" means the principal office of the Trustee, at which at any particular time its corporate trust business shall be principally administered, which office at the date of execution of this instrument is at the address set forth in the first paragraph of this instrument. "Principal Paying Agent" means the Paying Agent, if any, designated as such by the Company pursuant to Section 3.01 of this Indenture. "Redemption Date", when used with respect to any Security to be redeemed, means the date fixed for such redemption by or pursuant to this Indenture. "Redemption Price", when used with respect to any Security to be redeemed, means the price specified in such Security at which it is to be redeemed pursuant to this Indenture. "Registered Security" means any Security in the form established pursuant to Section 2.02 which is registered in the Security Register. "Regular Record Date" for the interest payable on any Security on any Interest Payment Date means the date, if any, specified in such Security as the "Regular Record Date". "Remarketing Entity", when used with respect to the Securities of any series which are repayable at the option of the Holders thereof before their Stated Maturity, means any Person designated by the Company to purchase any such Securities . "Repayment Date", when used with respect to any Security to be repaid upon exercise of option for repayment by the Holder, means the date fixed for such repayment pursuant to this Indenture. "Repayment Price", when used with respect to any Security to be repaid upon exercise of option for repayment by the Holder, means the price at which it is to be repaid pursuant to this Indenture. "Responsible Officer", when used with respect to the Trustee, means any vice president, any assistant vice president, any senior trust 16
officer, any trust officer or any other officer of the Trustee customarily performing functions similar to those performed by any of the above designated officers and also means, with respect to a particular corporate trust matter, any other officer of the Trustee to whom such matter is referred because of his knowledge of and familiarity with the particular subject. "Security" or "Securities" means any Security or Securities, as the case may be, authenticated and delivered under this indenture; provided, however, that, if at any time there is more than one Person acting as Trustee under this Indenture, "Securities", with respect to any such Person, shall mean Securities authenticated and delivered under this Indenture, exclusive, however, of Securities of any series as to which such Person is not Trustee. "Security Register" has the meaning specified in Section 3.05. "Security Registrar" has the meaning specified in Section 3.05. "Senior Indebtedness" means the principal of, premium, if any, and interest on (i) all of the Company's indebtedness for money borrowed, other than the Securities and the Existing Subordinated Indebtedness whether outstanding on the date of execution of this Indenture or thereafter created, assumed or incurred, except such indebtedness as is by its terms expressly stated to be not superior in right of payment to the Securities or the Existing Subordinated Indebtedness or to rank pari passu with the Securities or the Existing Subordinated Indebtedness and (ii) any deferrals, renewals or extensions of any such Senior Indebtedness. The term "indebtedness for money borrowed" as used in the foregoing sentence shall include, without limitation, any obligation of, or any obligation guaranteed by, the Company for the repayment of borrowed money, whether or not evidenced by bonds, debentures, notes or other written instruments, and any deferred obligation for the payment of the purchase price of property or assets. "Special Record Date" for the payment of any Defaulted Interest means the date fixed by the Trustee pursuant to Section 3.07. "Stated Maturity", when used with respect to any Security, or any installment of principal thereof or interest thereon, means the date specified in such Security as the fixed date on which the principal of such Security, or such installment of principal or interest, is due and payable. "Subsidiary of the Company" or "Subsidiary" means a corporation at least a majority of the outstanding voting stock of which is owned, directly or indirectly, by the Company or by one or more Subsidiaries of the Company, or by the Company and one or more Subsidiaries of the Company. As used under this heading, the term "voting stock" means stock having ordinary voting power for the election of directors irrespective of whether or not stock of any other class or classes shall have or might have voting power by reason of the happening of any contingency. "Trustee" means the Person named as the "Trustee" in the first paragraph of this instrument until a successor Trustee shall have become such pursuant to the applicable provisions of this Indenture, and thereafter "Trustee" shall mean or include each Person who is then a Trustee hereunder, and if at any time there is more than one such Person, "Trustee" as used with respect to the Securities of any series shall mean the Trustee with respect to Securities of that series. "Trust Indenture Act" or "TIA" (except as herein otherwise expressly provided) means the Trust Indenture Act of 1939, as in force at the date as of which this instrument was executed, and, to the extent required by law, as amended. "United States" means the United States of America (including the States and the District of Columbia), its territories, its possessions and other areas subject to its jurisdiction. "United States Alien", except as otherwise provided in or pursuant to this Indenture, means any Person who, for United States Federal income tax purposes, is a foreign corporation, a nonresident alien individual, a non- resident alien fiduciary of a foreign estate or trust, or a foreign partnership one or more of the members of which is, for United States Federal income tax purposes, a foreign corporation, a non-resident alien individual or a non- resident alien fiduciary of a foreign estate or trust. "vice president", when used with respect to the Company or the Trustee, means any vice president, whether or not designated by a number or a word or words added before or after the title "vice president". SECTION 1.02. Compliance Certificates and Opinions. Upon any application or request by the Company to the Trustee to take any action under any provision of this Indenture, the Company shall furnish to the Trustee an Officers' Certificate stating that all conditions precedent, if any, provided for in this Indenture relating to the proposed action have been complied with and an Opinion of Counsel stating that in the opinion of such counsel all such conditions precedent, if any, have been complied with, except that in the case of any such application or request as to which the furnishing of such documents is specifically required by any provision of this Indenture relating to such particular application or request, no additional certificate or opinion need be furnished. 17
Every certificate or opinion with respect to compliance with a condition or covenant provided for in this Indenture (except as otherwise expressly provided in this Indenture) shall include: (i) a statement that each individual signing such certificate or opinion has read such covenant or condition and the definitions herein relating thereto; (ii) a brief statement as to the nature and scope of the examination or investigation upon which the statements or opinions contained in such certificate or opinion are based; (iii) a statement that, in the opinion of each such individual, he has made such examination or investigation as is necessary to enable him to express an informed opinion as to whether or not such covenant or condition has been complied with; and (iv) a statement as to whether, in the opinion of each such individual, such condition or covenant has been complied with. SECTION 1.03. Form of Documents Delivered to Trustee. In any case where several matters are required to be certified by, or covered by an opinion of, any specified Person, it is not necessary that all such matters be certified by, or covered by the opinion of, only one such Person, or that they be so certified or covered by only one document, but one such Person may certify or give an opinion with respect to some matters and one or more other such Persons as to other matters, and any such Person may certify or give an opinion as to such matters in one or several documents. Any certificate or opinion of an officer of the Company may be based, insofar as it relates to legal matters, upon a certificate or opinion of, or representations by, counsel, unless such officer knows, or in the exercise of reasonable care should know, that the certificate or opinion or representations with respect to the matters upon which his certificate or opinion is based are erroneous. Any such certificate or Opinion of Counsel may be based, insofar as it relates to factual matters, upon a certificate or opinion of, or representations by, an officer or officers of the Company stating that the information with respect to such factual matters is in the possession of the Company, unless such counsel knows, or in the exercise of reasonable care should know, that the certificate or opinion or representations with respect to such matters are erroneous. Where any Person is required to make, give or execute two or more applications, requests, consents, certificates, statements, opinions or other instruments under this Indenture, they may, but need not, be consolidated and form one instrument. SECTION 1.04. Acts of Holders. (i) Any request, demand, authorization, direction, notice, consent, waiver or other action provided by this Indenture to be given or taken by Holders or Holders of any series may be embodied in and evidenced by one or more instruments of substantially similar tenor signed by such Holders in person or by an agent duly appointed in writing. If Securities of a series are issuable in whole or in part as Bearer Securities, any request, demand, authorization, direction, notice, consent, waiver or other action provided by this Indenture to be given or taken by Holders may, alternatively, be embodied in and evidenced by the record of Holders of Securities voting in favor thereof, either in person or by proxies duly appointed in writing, at any meeting of Holders of Securities duly called and held in accordance with the provisions of Article Sixteen or a combination of such instruments and any such record. Except as herein otherwise expressly provided, such action shall become effective when such instrument or instruments or record or both are delivered to the Trustee, and, where it is hereby expressly required, to the Company. Such instrument or instruments and any such record (and the action embodied therein and evidenced thereby) are herein sometimes referred to as the "Act" of the Holders signing such instrument or instruments and so voting at any such meeting. Proof of execution of any such instrument or of a writing appointing any such agent, or the holding by any Person of a Security, shall be sufficient for any purpose of this Indenture and (subject to Section 8.01) conclusive in favor of the Trustee and the Company, if made in the manner provided in this Section. The record of any meeting of Holders of Securities shall be proved in the manner provided in Section 16.06. (ii) The fact and date of the execution by any Person of any such instrument or writing may be proved by the affidavit of a witness of such execution or by the certificate of any notary public or other officer authorized by law to take acknowledgments of deeds, certifying that the individual signing such instrument or writing acknowledged to him the execution thereof. Where such execution is by or on behalf of any legal entity other than an individual, such certificate or affidavit shall also constitute proof of the authority of the Person executing the same. The fact and date of the execution of any such instrument or writing, or the authority of the Person executing the same, may also be proved in any other manner which the Trustee deems sufficient. (iii) The ownership of Registered Securities shall be proved by the Security Register. (iv) The principal amount and serial numbers of Bearer Securities held by any Person, and the date of holding the same, may be proved by the production of such Bearer Securities or by a certificate executed, as depositary, by any trust company, bank or other depositary, wherever situated, if such certificate shall be deemed by the Trustee to be satisfactory, showing that at the date therein mentioned such Person had on deposit with such depositary, or exhibited to it, the Bearer Securities therein described; or such facts may be proved by the certificate or affidavit of the Person holding such Bearer Securities, if such certificate or affidavit is deemed by the Trustee to be satisfactory. The Trustee and the Company may assume that such ownership of any Bearer Security continues until (1) another certificate or affidavit bearing a later date issued in respect of the same Bearer Security is produced, or (2) such Bearer Security is produced to the Trustee by some other Person, or (3) such Bearer Security is surrendered in exchange for a Registered Security, or (4) such Bearer Security is no longer Outstanding. 18
(v) The fact and date of execution of any such instrument or writing, the authority of the Person executing the same and the principal amount and serial numbers of Bearer Securities held by the Person so executing such instrument or writing and the date of holding the same may also be proved in any other manner which the Trustee deems sufficient; and the Trustee may in any instance require further proof with respect to any of the matters referred to in this Section. (vi) Any request, demand, authorization, direction, notice, consent, waiver or other action by the Holder of any Security shall bind every future Holder of the same Security and the Holder of every Security issued upon the registration of transfer thereof or in exchange therefor or in lieu thereof, in respect of any action taken, suffered or omitted by the Trustee or the Company in reliance thereon, whether or not notation of such action is made upon such Security. (vii) For purposes of determining the principal amount of Outstanding Securities of any series the Holders of which are required, requested or permitted to give any request, demand, authorization, direction, notice, consent, waiver or take any other Act under the Indenture, each Security denominated in a Foreign Currency or composite currency shall be deemed to have the principal amount determined by the Exchange Rate Agent by converting the principal amount of such Security in the currency in which such Security is denominated into Dollars at the Exchange Rate as of the date such Act is delivered to the Trustee and, where it is hereby expressly required, to the Company, by Holders of the required aggregate principal amount of the Outstanding Securities of such series (or, if there is no such rate on such date, such rate on the date determined as specified as contemplated in Section 3.01). (viii) The Company may, in the circumstances permitted by the Trust Indenture Act, set a record date for purposes of determining the identity of Holders of Securities of any series entitled to give any request, demand, authorization, direction, notice, consent, waiver or take any other Act, or to vote or consent to any action by vote or consent authorized or permitted to be given or taken by Holders of Securities of such series. If not set by the Company prior to the first solicitation of a Holder of Securities of such Series made by any Person in respect of any such action, or in the case of any such vote, prior to such vote, such record date shall be the later of 30 days prior to the first solicitation of such consent or the date of the most recent list of Holders of such Securities furnished to the Trustee pursuant to Section 6.01 prior to such solicitation. (ix) Without limiting the foregoing, a Holder entitled hereunder to take any action hereunder with regard to any particular Security may do so with regard to all or any part of the principal amount of such Security or by one or more duly appointed agents each of which may do so pursuant to such appointment with regard to all or any part of such principal amount. Any notice given or action taken by a Holder or its agents with regard to different parts of such principal amount pursuant to this paragraph shall have the same effect as if given or taken by separate Holders of each such different part. (x) Without limiting the generality of the foregoing, unless otherwise specified pursuant to Section 3.01 or pursuant to one or more indentures supplemental hereto, a Holder, including a Depositary that is the Holder of a Global Security, may make, give or take, by a proxy or proxies duly appointed in writing, any request, demand, authorization, direction, notice, consent, waiver or other action provided in this Indenture to be made, given or taken by Holders, and a Depositary that is the Holder of a Global Security may provide its proxy or proxies to the beneficial owners of interests in any such Global Security through such Depositary's standing instructions and customary practices. (xi) The Company may fix a record date for the purpose of determining the Persons who are beneficial owners of interests in any Global Security held by a Depositary entitled under the procedures of such Depositary to make, give or take, by a proxy or proxies duly appointed in writing, any request, demand, authorization, direction, notice, consent, waiver or other action provided in this Indenture to be made, given or taken by Holders. If such a record date is fixed, the Holders on such record date or their duly appointed proxy or proxies, and only such Persons, shall be entitled to make, give or take such request, demand, authorization, direction, notice, consent, waiver or other action, whether or not such Holders remain Holders after such record date. No such request, demand, authorization, direction, notice, consent, waiver or other action shall be valid or effective if made, given or taken more than 90 days after such record date. SECTION 1.05. Notices, etc., to Trustee and Company. Any request, demand, authorization, direction, notice, consent, waiver or Act of Holders or other document provided or permitted by this Indenture to be made upon, given or furnished to, or filed with, (i) the Trustee by any Holder or by the Company shall be sufficient for every purpose hereunder if made, given, furnished or filed in writing to or with the Trustee at its Principal Corporate Trust Office, or (ii) the Company by any Holder or by the Trustee shall be sufficient for every purpose hereunder (unless otherwise herein expressly provided) if in writing and mailed, first-class, postage prepaid, to the Company, to the attention of its Treasurer, addressed to it at the address of its principal office specified in the first paragraph of this Indenture or at any other address previously furnished in writing to the Trustee by the Company. SECTION 1.06. Notices to Holders; Waiver. Where this Indenture or any Security provides for notice to Holders of any event, (1) such notice shall be sufficiently given (unless otherwise herein or in such Security expressly provided) if in writing and mailed, first- class, postage prepaid, to each Holder of Registered Securities affected by such event, at his address as it appears in the Security 19
Register, not later than the latest date, and not earlier than the earliest date, prescribed for the giving of such notice. (2) such notice shall be sufficiently given to Holders of Bearer Securities if published in an Authorized Newspaper in The City of New York and, if the Securities of such series are then listed on The International Stock Exchange of the United Kingdom and the Republic of Ireland Limited and such stock exchange shall so require, in London and, if the Securities of such series are then listed on the Luxembourg Stock Exchange and such stock exchange shall so require, in Luxembourg and, if the Securities of such series are then listed on any other stock exchange and such stock exchange shall so require, in any other required city outside the United States, or, if not practicable, elsewhere in Europe on a Business Day at least twice, the first such publication to be not earlier than the earliest date, and not later than the latest date, prescribed for the giving of such notice. In case by reason of the suspension of regular mail service or by reason of any other cause it shall be impracticable to give such notice to Holders of Registered Securities by mail, then such notification as shall be made with the approval of the Trustee shall constitute a sufficient notification for every purpose hereunder. In any case where notice to Holders of Registered Securities is given by mail, neither the failure to mail such notice, nor any defect in any notice so mailed, to any particular Holder of Registered Securities shall affect the sufficiency of such notice with respect to other Holders of Registered Securities or the sufficiency of any notice by publication to Holders of Bearer Securities given as provided above. In case by reason of the suspension of publication of any Authorized Newspaper or Authorized Newspapers or by reason of any other cause it shall be impracticable to publish any notice to Holders of Bearer Securities as provided above, then such notification to Holders of Bearer Securities as shall be given with the approval of the Trustee shall constitute sufficient notice to such Holders for every purpose hereunder. Neither the failure to give notice by publication to Holders of Bearer Securities as provided above, nor any defect in any notice so published, shall affect the sufficiency of any notice mailed to Holders of Registered Securities as provided above. Where this Indenture provides for notice in any manner, such notice may be waived in writing by the Person entitled to receive such notice, either before or after the event, and such waiver shall be the equivalent of such notice. Waivers of notice by Holders shall be filed with the Trustee, but such filing shall not be a condition precedent to the validity of any action taken in reliance upon such waiver. SECTION 1.07. Language of Notices, Etc. Any request, demand, authorization, direction, notice, consent, or waiver required or permitted under this Indenture shall be in the English language, except that any published notice may be in an official language of the country of publication. SECTION 1.08. Conflict with Trust Indenture Act. If and to the extent that any provision of this Indenture limits, qualifies or conflicts with the duties imposed by, or with another provision (an "incorporated provision") included in this Indenture by operation of Sections 310 and 318, inclusive, of the TIA, such imposed duties or incorporated provision shall control. SECTION 1.09. Effect of Headings and Table of Contents. The Article and Section headings herein and the Table of Contents are for convenience only and shall not affect the construction hereof. SECTION 1.10. Successors and Assigns. All covenants and agreements in this Indenture by the Company shall bind its successors and assigns, whether so expressed or not. SECTION 1.11. Separability Clause. In case any provision in this Indenture or in the Securities shall be invalid, illegal or unenforceable, the validity, legality and enforceability of the remaining provisions shall not in any way be affected or impaired thereby. SECTION 1.12. Benefits of Indenture. Nothing in this Indenture or in the Securities, express or implied, shall give to any Person, other than the parties hereto and their successors hereunder, the Holders and, to the extent provided in Article Fourteen hereof, the holders of Senior Indebtedness and creditors in respect of General Obligations, any benefit or any legal or equitable right, remedy or claim under this Indenture. SECTION 1.13. Legal Holidays. In any case where any Interest Payment Date, Stated Maturity, Repayment Date or Redemption Date of any Security or any date on which any Defaulted Interest is proposed to be paid shall not be a Business Day at any Place of Payment, then (notwithstanding any other provisions of the Securities or this Indenture) payment of the principal of, premium, if any, or interest on any Securities need not be made at such Place of Payment on such date, but may be made on the next succeeding Business Day with the same force and effect as if made on the Interest Payment Date, Stated Maturity, Repayment or Redemption Date or on the date on which Defaulted Interest is proposed to be paid and, if such payment is made, no interest shall accrue on such payment for the period from and after any such Interest Payment Date, Stated Maturity, Repayment Date or Redemption Date or date on which Defaulted Interest is proposed to be paid, as the case may be. SECTION 1.14. Governing Law. This Indenture and the Securities shall be construed in accordance with and governed by the laws of the State of New York. 20
ARTICLE TWO SECURITY FORMS SECTION 2.01. Form Generally. All Securities and any related coupons shall have such appropriate insertions, omissions, substitutions and other variations as are required or permitted by this Indenture, and may have such letters, numbers or other marks of identification and such legends or endorsements placed thereon as may be required to comply with the rules of any securities exchange or as may, consistently herewith, be determined by the officers executing such Securities or coupons, as evidenced by their execution of the Securities or coupons. The Trustee's certificates of authentication shall be in substantially the form set forth in this Article. Unless otherwise provided as contemplated by Section 3.01 with respect to any series of Securities, the Securities of each series shall be issuable in registered form without coupons. If so provided as contemplated by Section 3.01, the Securities of a series shall be issuable solely in bearer form, or in both registered form and bearer form. Unless otherwise specified as contemplated by Section 3.01, Securities in bearer form shall have interest coupons attached. The definitive Securities and coupons shall be printed, lithographed or engraved or produced by any combination of these methods on a steel engraved border or steel engraved borders or may be produced in any other manner, all as determined by the officers executing such Securities or coupons, as evidenced by their execution of such Securities or coupons. SECTION 2.02. Form of Securities. Each Security and coupon shall be in one of the forms approved from time to time by or pursuant to a Board Resolution. Upon or prior to the delivery of a Security or coupons in any such form to the Trustee for authentication, the Company shall deliver to the Trustee the following: (i) the Board Resolution by or pursuant to which such form of Security or coupons has been approved, certified by the Secretary or an Assistant Secretary of the Company; (ii) the Officers' Certificate required by Section 3.01 of this Indenture; (iii) the Company Order required by Section 3.03 of this Indenture; and (iv) the Opinion of Counsel required by Section 3.03 of this Indenture. If temporary Securities of any series are issued in global form as permitted by Section 3.04, the form thereof shall be established as provided in Section 2.02. SECTION 2.03. Form of Trustee's Certificate of Authentication. TRUSTEE'S CERTIFICATE OF AUTHENTICATION This is one of the Securities of the series designated therein referred to in the within-mentioned Indenture. CITIBANK, N.A., AS TRUSTEE by AUTHORIZED OFFICER SECTION 2.04. Global Securities. If Securities of a series are issuable in whole or in part in global form, as specified as contemplated by Section 3.01, then, notwithstanding clause (xii) of Section 3.01 and the provisions of Section 3.02, such Global Security shall represent such of the outstanding Securities of such series as shall be specified therein and may provide that it shall represent the aggregate amount of Outstanding Securities from time to time endorsed thereon and that the aggregate amount of Outstanding Securities represented thereby may from time to time be reduced to reflect exchanges or increased to reflect the issuance of additional uncertificated securities of such series. Any endorsement of a Global Security to reflect the amount, or any increase or decrease in the amount, of Outstanding Securities represented thereby shall be made in such manner and upon instructions given by such Person or Persons as shall be specified therein or in the Company Order to be delivered to the Trustee pursuant to Section 3.03 or Section 3.04. Global Securities may be issued in either registered or bearer form and in either temporary or permanent form. 21
ARTICLE THREE THE SECURITIES SECTION 3.01. Title and Terms. The aggregate principal amount of Securities which may be authenticated and delivered under this Indenture is unlimited. The Securities may be issued up to the aggregate principal amount of Securities from time to time authorized by or pursuant to a Board Resolution. The Securities may be issued in one or more series. All Securities of each series issued under this Indenture shall in all respects be equally and ratably entitled to the benefits hereof with respect to such series without preference, priority or distinction on account of the actual time or times of the authentication and delivery or Maturity of the Securities of such series. There shall be established in or pursuant to a Board Resolution, and set forth in, or determined in the manner provided in, an Officers' Certificate, or established in one or more indentures supplemental hereto, prior to the issuance of Securities of any series, (i) the title of the Securities of the series (which shall distinguish the Securities of the series from all other Securities); (ii) any limit upon the aggregate principal amount or aggregate initial public offering price of the Securities of the series which may be authenticated and delivered under this Indenture (except for Securities authenticated and delivered upon registration of transfer of, or in exchange for, or in lieu of, other Securities of that series pursuant to this Article Three or Sections 4.07, 9.06 or 14.03); (iii) the priority of payment, if any, of the Securities; (iv) The price or prices (which may be expressed as a percentage of the aggregate principal amount thereof) at which the Securities will be issued; (v) the date or dates on which the principal and premium, if any, of the Securities of the series is payable; (vi) the rate or rates at which the Securities of the series shall bear interest, if any, or the method or methods by which such rates may be determined, if any, the date or dates from which such interest shall accrue, the Interest Payment Dates on which such interest shall be payable, the Regular Record Date for the interest payable on any Interest Payment Date and the basis upon which interest shall be calculated if other than that of a 360-day year consisting of twelve 30-day months; (vii) the extent to which any of the Securities will be issuable in temporary or permanent global form, and in such case, the Depositary for such Global Security or Securities, the terms and conditions, if any, upon which such Global Security may be exchanged in whole or in part for definitive securities, and the manner in which any interest payable on a temporary or permanent Global Security will be paid, whether or not consistent with Section 3.04 or 3.05; (viii) the office or offices or agency where, subject to Section 5.02, the Securities may be presented for registration of transfer or exchange; (ix) the place or places where, subject to the provisions of Section 5.02, the principal of (and premium, if any) and interest, if any, on Securities of the series shall be payable; (x) the period or periods within which, the price or prices at which and the terms and conditions upon which Securities of the series may be redeemed, in whole or in part, at the option of the Company; (xi) the obligation, if any, of the Company to redeem or purchase Securities of the series pursuant to any sinking fund or analogous provisions or at the option of a Holder thereof and the period or periods within which, the price or prices at which and the terms and conditions upon which Securities of the series shall be redeemed or purchased, in whole or in part, pursuant to such obligation; (xii) if other than denominations of $1,000 and any integral multiple thereof, the denominations in which Registered Securities of the series shall be issuable; and, if other than $5,000 or any integral multiple thereof, the denominations in which Bearer Securities of the series shall be issuable; (xiii) the currency or currencies of denominations of the Securities of any series, which may be in Dollars, any Foreign Currency or any composite currency, including but not limited to the ECU, and, if any such currency of denomination is a composite currency other than the ECU, the agency or organization, if any, responsible for overseeing such composite currency; (xiv) the currency or currencies in which payment of the principal of (and premium, if any) and interest on the Securities will be made, the currency or currencies, if any, in which payment of the principal of (and premium, if any) or the interest on Registered Securities, at the election of each of the Holders thereof, may also be payable and the periods within which and the terms and conditions upon which such election is to be made and the Exchange Rate and the Exchange Rate Agent; 22
(xv) if the amount of payments of principal of (and premium, if any) or any interest on Securities of the series may be determined with reference to an index, the method or methods by which such amounts shall be determined ; (xvi) whether Securities of the series are to be issuable as Registered Securities, Bearer Securities or both, whether Securities of the series are to be issuable with or without coupons or both and, in the case of Bearer Securities, the date as of which such Bearer Securities shall be dated if other than the date of original issuance of the first Security of such series of like tenor and term to be issued; (xvii) whether, and under what conditions, additional amounts will be payable to Holders of Securities of the series pursuant to Section 5.04; (xviii) whether any of the Securities will be issued as Original Issue Discount Securities; (xix) information with respect to book-entry procedures, if any; (xx) any addition to or change in the Events of Default or covenants of the Company pertaining to the Securities of the series; and (xxi) any other terms of the series. All Securities of any one series and the coupons appertaining to Bearer Securities of such series, if any, shall be substantially identical except, in the case of Registered Securities, as to denomination and except as may otherwise be provided in or pursuant to such Board Resolution and set forth, or determined in the manner provided in such Officers' Certificate or in any such indenture supplement hereto. Securities of any particular series may be issued at various times, with different dates on which the principal or any installment of principal is payable, with different rates of interest, if any, or different methods by which rates of interest may be determined, with different dates on which such interest may be payable and with different Redemption Dates or Repayment Dates and may be denominated in different currencies or payable in different currencies. All Securities shall be subordinate and junior in right of payment to the obligations of the Company to holders of Senior Indebtedness and creditors in respect of General Obligations of the Company as provided in Article Fourteen. SECTION 3.02. Denominations. The Securities of each series shall be issuable in such form and denominations as shall be specified as contemplated by Section 3.01. In the absence of any specification with respect to the Securities of any series, the Registered Securities of each series shall be issuable only as Securities without coupons in denominations of $1,000 and any integral multiple thereof and the Bearer Securities of each series, if any, shall be issuable with coupons and in denominations of $5,000 and any integral multiple thereof. SECTION 3.03. Execution, Authentication, Delivery and Dating. The Securities shall be executed on behalf of the Company by its Chairman of the Board, its President, a Vice Chairman of the Board, or one of its Vice Presidents and by its Secretary or one of its Assistant Secretaries. The signatures of any or all of these officers on the Securities may be manual or facsimile. Coupons shall bear the facsimile signature of the Company's Chairman of the Board, its President, a Vice Chairman of the Board or one of its Vice Presidents. Securities and coupons bearing the manual or facsimile signatures of individuals who were at any time the proper officers of the Company shall bind the Company, notwithstanding that such individuals or any of them have ceased to hold such offices prior to the authentication and delivery of such Securities or did not hold such offices at the date of such Securities. At any time and from time to time after the execution and delivery of this Indenture, the Company may deliver Securities of any series, together with any coupons appertaining thereto, executed by the Company to the Trustee for authentication, together with a Company Order for the authentication and delivery of such Securities, and the Trustee shall, upon receipt of the Company Order, authenticate and deliver such Securities as in this Indenture provided and not otherwise; provided, however, that, in connection with its original issuance, no Bearer Security shall be mailed or otherwise delivered to any location in the United States; and provided further that a Bearer Security may be delivered in connection with its original issuance only if the Person entitled to receive such Bearer Security shall have delivered to the Trustee, or such other Person as shall be specified in a temporary Global Security delivered pursuant to Section 3.04, a certificate in the form required by Section 3.11(i). If the Company shall establish pursuant to Section 3.01 that the Securities of a series are to be issued in whole or in part in the form of one or more Global Securities in registered or permanent bearer form, then the Company shall execute and the Trustee shall, in accordance with this Section and a Company Order for the authentication and delivery of such Global Securities with respect to such series, authenticate and deliver one or more Global Securities in permanent or temporary form that (i) shall represent and shall be denominated in an aggregate amount equal to the aggregate principal amount of the Outstanding Securities of such series to be represented by one or more Global Securities, 23
(ii) shall be registered, if in registered form, in the name of the Depositary for such Global Security or Securities or the nominee of such Depositary and (iii) shall be delivered by the Trustee to such Depositary or pursuant to such Depositary's instructions. Each Depositary designated pursuant to Section 3.01 for a Global Security in registered form must, at the time of its designation and at all times while it serves as Depositary, be a clearing agency registered under the Exchange Act, and any other applicable statute or regulation. In authenticating such Securities, and accepting the additional responsibilities under this Indenture in relation to such Securities, the Trustee shall be entitled to receive, and (subject to Section 8.01) shall be fully protected in relying upon, an Opinion of Counsel complying with Section 1.02 and stating that, (i) the form of such Securities and coupons, if any, has been established in conformity with the provisions of this Indenture; (ii) the terms of such Securities and coupons, if any, or the manner of determining such terms have been established in conformity with the provisions of this Indenture; (iii) that such Securities and coupons, when authenticated and delivered by the Trustee and issued by the Company in the manner and subject to any conditions specified in such Opinion of Counsel, will constitute valid and legally binding obligations of the Company, enforceable against the Company in accordance with their terms, subject to bankruptcy, insolvency, fraudulent transfer, reorganization, moratorium and other laws of general applicability relating to or affecting the enforcement of creditors' rights and to general principles of equity; and (iv) such other matters as the Trustee may reasonably request. The Trustee shall not be required to authenticate such Securities if the issue thereof will adversely affect the Trustee's own rights, duties or immunities under the Securities and this Indenture or otherwise in a manner which is not reasonably acceptable to the Trustee. Notwithstanding the provisions of Section 3.01 and of this Section 3.03, if all Securities of a series are not to be originally issued at one time, it shall not be necessary to deliver the Board Resolution or Officers' Certificate otherwise required pursuant to Section 3.01 or the Company Order and Opinion of Counsel otherwise required pursuant to this Section 3.03 at or prior to the time of authentication of each Security of such series if such documents are delivered at or prior to the authentication upon original issuance of the first Security of such series to be issued and such documents reasonably contemplate the issuance of all Securities of such series; provided that any subsequent request by the Company to the Trustee to authenticate Securities of such series upon original issuance shall constitute a representation and warranty by the Company that as of the date of such request, the statements made in the Officers' Certificate or other certificates delivered pursuant to Sections 1.02 and 3.01 shall be true and correct as if made on such date. A Company Order, Officers' Certificate or Board Resolution or supplemental indenture delivered by the Company to the Trustee in the circumstances set forth in the preceding paragraph may provide that Securities which are the subject thereof will be authenticated and delivered by the Trustee or its agent on original issue from time to time in the aggregate principal amount, if any, established for such series pursuant to such procedures acceptable to the Trustee as may be specified from time to time by Company Order upon the telephonic, electronic or written order of Persons designated in such Company Order, Officers' Certificate, supplemental indenture or Board Resolution and that such Persons are authorized to determine, consistent with such Company Order, Officers' Certificate, supplemental indenture or Board Resolution, such terms and conditions of said Securities as are specified in such Company Order, Officers' Certificate, supplemental indenture or Board Resolution. Each Registered Security shall be dated the date of its authentication; and unless otherwise specified as contemplated by Section 3.01, each Bearer Security and any temporary Global Security referred to in Section 3.04 shall be dated as of the date of original issuance of such Security. No Security or coupon appertaining thereto shall be entitled to any benefit under this Indenture or be valid or obligatory for any purpose, unless there appears on such Security a certificate of authentication substantially in the form provided for herein executed by the Trustee by manual signature, and such certificate upon any Security shall be conclusive evidence, and the only evidence, that such Security has been duly authenticated and delivered hereunder. Except as permitted by Section 3.06, the Trustee shall not authenticate and deliver any Bearer Security unless all appurtenant coupons for interest then matured have been detached and canceled. Notwithstanding the foregoing, if any Security or portion thereof shall have been duly authenticated and delivered hereunder but never issued and sold by the Company, and the Company shall deliver such Security to the Trustee for cancelation as provided in Section 3.09 together with a written statement (which need not comply with Section 1.02 and need not be accompanied by an Opinion of Counsel) stating that such Security or portion thereof has never been issued and sold by the Company, for all purposes of this Indenture such Security shall be deemed never to have been authenticated and delivered hereunder and shall never be entitled to the benefits of this Indenture. SECTION 3.04. Temporary Securities. (a) Pending the preparation of definitive Securities of any series, the Company may execute, and upon Company Order and the receipt of the certifications and opinions required under Sections 3.01 and 3.03, the Trustee shall 24
authenticate and deliver, temporary Securities which are printed, lithographed, typewritten, mimeographed or otherwise produced, in any authorized denominations, substantially of the tenor of the definitive Securities in lieu of which they are issued in registered form or, if authorized, in bearer form with one or more coupons or without coupons, and with such appropriate insertions, omissions, substitutions and other variations as the officers executing such Securities may determine, as evidenced by their execution of such Securities. In the case of any series which may be issuable as Bearer Securities, such temporary Securities may be in global form, representing such of the Outstanding Securities of such series as shall be specified therein. (b) Unless otherwise provided pursuant to Section 3.01: (i) Except in the case of temporary Securities in global form, each of which shall be exchanged in accordance with the provisions of the following paragraphs, if temporary Securities of any series are issued, the Company will cause definitive Securities of such series to be prepared without unreasonable delay. After the preparation of definitive Securities, the temporary Securities of such series shall be exchangeable for definitive Securities of such series upon surrender of the temporary Securities of such series at the office or agency of the Company in a Place of Payment for that series, without charge to the Holder. Upon surrender for cancelation of any one or more temporary Securities of any series (accompanied, if applicable, by all unmatured coupons and all matured coupons in default appertaining thereto), the Company shall execute and the Trustee shall authenticate and deliver in exchange therefor a like principal amount of definitive Securities of such series of authorized denominations; provided, however, that no definitive Bearer Security shall be delivered in exchange for a temporary Registered Security; and provided further that a definitive Bearer Security shall be delivered in exchange for a temporary Bearer Security only in compliance with the conditions set forth in Section 3.03. Until so exchanged, the temporary Securities of any series shall in all respects be entitled to the same benefits under this Indenture as definitive Securities of such series. (ii) If temporary Securities of any series are issued in global form, any such temporary Global Security shall, unless otherwise provided in such temporary Global Security, be delivered to the London office of a depositary or common depositary (the "Common Depositary"), for the benefit of the operator of Euroclear and CEDEL S.A., for credit to the respective accounts of the beneficial owners of such Securities (or to such other accounts as they may direct). Upon receipt of written instructions (which need not comply with Section 1.02) signed on behalf of the Company by any Person authorized to give such instructions, the Trustee or any Authenticating Agent shall endorse such temporary Global Security to reflect the initial principal amount, or an increase in the principal amount, of Outstanding Securities represented thereby. Until such initial endorsement, such temporary Global Security shall not evidence any obligation of the Company. Such temporary Global Security shall at any time represent the aggregate principal amount of Outstanding Securities theretofore endorsed thereon as provided above, subject to reduction to reflect exchanges as described below. (iii) Unless otherwise specified in such temporary Global Security, and subject to the second proviso in the following paragraph, the interest of a beneficial owner of Securities of a series in a temporary Global Security shall be exchanged for definitive Securities including a definitive Global Bearer Security) of such series and of like tenor following the Global Exchange Date (as defined below) when the account holder instructs Euroclear or CEDEL S.A., as the case may be, to request such exchange on his behalf and delivers to Euroclear or CEDEL S.A., as the case may be, a certificate in the form required by Section 3.11(i), dated no earlier than 15 days prior to the Global Exchange Date, copies of which certificate shall be available from the offices of Euroclear and CEDEL S.A., the Trustee, any Authenticating Agent appointed for such series of Securities and each Paying Agent. Unless otherwise specified in such temporary Global Security, any such exchange shall be made free of charge to the beneficial owners of such temporary Global Security, except that a Person receiving definitive Securities must bear the cost of insurance, postage, transportation and the like in the event that such Person does not take delivery of such definitive Securities in person at the offices of Euroclear or CEDEL S.A. Definitive Securities in bearer form to be delivered in exchange for any portion of a temporary Global Security shall be delivered only outside the United States. (iv) Without unnecessary delay but in any event not later than the date specified in, or determined pursuant to the terms of, any such temporary Global Security as the "Global Exchange Date" (the "Global Exchange Date"), the Company shall deliver to the Trustee, or, if the Trustee appoints an Authenticating Agent pursuant to Section 8.14, to any such Authenticating Agent, definitive Securities in aggregate principal amount equal to the principal amount of such temporary Global Security, executed by the Company. Unless otherwise specified as contemplated by Section 3.01, such definitive Securities shall be in the form of Bearer Securities or Registered Securities, or any combination thereof, as may be specified by the Company, the Trustee or any such Authenticating Agent, as may be appropriate. On or after the Global Exchange Date, such temporary Global Security shall be surrendered by the Common Depositary to the Trustee or any such Authenticating Agent, as the Company's agent for such purpose, to be exchanged, in whole or from time to time in part, for definitive Securities without charge and the Trustee or any such Authenticating Agent shall authenticate and deliver, in exchange for each portion of such temporary Global Security, an equal aggregate principal amount of definitive Securities of the same series, of authorized denominations and of like tenor as the portion of such temporary Global Security to be exchanged, which, except as otherwise specified as contemplated by Section 3.01, shall be in the form of Bearer Securities or Registered Securities, or any combination thereof; provided, however, that unless otherwise specified in such temporary Global Security, upon such presentation by the Common Depositary, such temporary Global Security is accompanied by a certificate dated the Global Exchange Date or a subsequent date and signed by Euroclear as to the portion of such temporary Global Security held for its account then to be exchanged and a certificate dated the Global Exchange Date or a subsequent date and signed by CEDEL S.A., as to the portion of such 25
temporary Global Security held for its account then to be exchanged, each in the form required by Section 3.11(ii); and provided further that a definitive Bearer Security (including a definitive global Bearer Security) shall be delivered in exchange for a portion of a temporary Global Security only in compliance with the conditions set forth in Section 3.03. (v) Upon any exchange of a portion of any such temporary Global Security, such temporary Global Security shall be endorsed by the Trustee or any such Authenticating Agent, as the case may be, to reflect the reduction of the principal amount evidenced thereby, whereupon its remaining principal amount shall be reduced for all purposes by the amount so exchanged. Until so exchanged in full, such temporary Global Security shall in all respects be entitled to the same benefits under this Indenture as definitive Securities of such series authenticated and delivered hereunder, except that, unless otherwise specified as contemplated by Section 3.01, interest payable on such temporary Global Security on an Interest Payment Date for Securities of such series occurring prior to the applicable Global Exchange Date shall be payable, without interest, to Euroclear and CEDEL S.A. on or after such Interest Payment Date upon delivery by Euroclear and CEDEL S.A. to the Trustee or the Paying Agent, as the case may be, of a certificate or certificates in the form required by Section 3.11(iii), for credit on or after such Interest Payment Date to the respective accounts of the Persons who are the beneficial owners of such temporary Global Security on such Interest Payment Date and who have each delivered to Euroclear or CEDEL S.A., as the case may be, a certificate in the form required by Section 3.11(iv). Any interest so received by Euroclear and CEDEL S.A. and not paid as herein provided prior to the Global Exchange Date shall be returned to the Trustee or Paying Agent, as the case may be, which, upon expiration of two years after such Interest Payment Date, shall repay such interest on Company Request in accordance with Section 5.03. SECTION 3.05. Registration, Registration of Transfer and Exchange. With respect to Registered Securities, the Company shall keep or cause to be kept a register (sometimes referred to as the "Security Register") in which, subject to such reasonable regulations as it may prescribe, the Company shall provide for the registration of Registered Securities and the registration of transfers of Registered Securities and the Company shall appoint a "Security Registrar", and may appoint any "Co-Security Registrar", as may be appropriate, to keep the Security Register. Such Security Register shall be in written form or in any other form capable of being converted into written form within a reasonable time. At all reasonable times the information contained in such Security Register shall be available for inspection by the Trustee at the office of the Security Registrar. In the event that any Registered Securities issued hereunder have the City of New York as a Place of Payment, the Company shall appoint either a Security Registrar or Co-Security Registrar located in the City of New York. Upon surrender for registration of transfer of any Registered Security of any series at the office or agency of the Company maintained pursuant to Section 5.02 for such purpose in a Place of Payment for such series, the Company shall execute, and the Trustee shall authenticate and deliver, in the name of the designated transferee or transferees, one or more new Registered Securities of such series of any authorized denominations and of a like aggregate principal amount, tenor and Stated Maturity. At the option of the Holder, Registered Securities of any series may be exchanged for other Registered Securities of such series, of any authorized denominations and of like aggregate principal amount, tenor and Stated Maturity, upon surrender of the Securities to be exchanged at such office or agency. Whenever any Securities are so surrendered for exchange, the Company shall execute, and the Trustee shall authenticate and deliver, the Securities which The Holder making the exchange is entitled to receive. Registered Securities may not be exchanged for Bearer Securities. At the option of the Holder, Bearer Securities of any series may be exchanged for Registered Securities of the same series of any authorized denominations and of a like aggregate principal amount and tenor, upon surrender of the Bearer Securities to be exchanged at any such office or agency, with all unmatured coupons and all matured coupons in default thereto appertaining. If the Holder of a Bearer Security is unable to produce any such unmatured coupon or coupons or matured coupon or coupons in default, such exchange may be effected if the Bearer Securities are accompanied by payment in funds acceptable to the Company in an amount equal to the face amount of such missing coupon or coupons, or the surrender of such missing coupon or coupons may be waived by the Company and the Trustee if there be furnished to them such security or indemnity as they may require to save each of them and any Paying Agent harmless. If thereafter the Holder of such Security shall surrender to any Paying Agent any such missing coupon in respect of which such a payment shall have been made, such Holder shall be entitled to receive the amount of any such payment from the Company; provided, however, that interest represented by coupons shall be payable only upon presentation and surrender of those coupons at an office or agency of a Paying Agent, maintained pursuant to Section 5.02 for such purpose, located outside the United States. Notwithstanding the foregoing, in case a Bearer Security of any series is surrendered at any such office or agency in exchange for a Registered Security of the same series and like tenor after the close of business at such office or agency on (i) any Regular Record Date and before the opening of business at such office or agency on the relevant Interest Payment Date, or (ii) any Special Record Date and before the opening of business at such office or agency on the related date for payment of Defaulted Interest, such Bearer Security shall be surrendered without the coupon relating to such Interest Payment Date or proposed date for payment, as the case may be. Notwithstanding any other provision of this Section, unless and until it is exchanged in whole or in part for individual Securities represented thereby, a Global Security representing all or a portion of the Securities of a series may not be transferred except as a whole by the Depositary for such series to a nominee of such Depositary or by a nominee of such Depositary to such Depositary or 26
another nominee of such Depositary or by such Depositary or any such nominee to a successor Depositary for such series or a nominee of such successor Depositary. Whenever any Securities are so surrendered for exchange, the Company shall execute, and the Trustee shall authenticate and deliver, the Securities which the Holder making the exchange is entitled to receive. If at any time the Depositary for the Securities of a series notifies the Company that it is unwilling or unable to continue as Depositary for the Securities of such series or if at any time the Depositary for the Securities of such series shall no longer be eligible under Section 3.03, the Company shall appoint a successor Depositary with respect to the Securities of such series. If a successor Depositary for the Securities of such series is not appointed by the Company within 90 days after the Company receives such notice or becomes aware of such ineligibility, the Company's election pursuant to Section 3.01(vi) shall no longer be effective with respect to the Securities of such series and the Company will execute, and the Trustee, upon receipt of a Company Order for the authentication and delivery of definitive Securities of such series, will authenticate and deliver Securities of such series of like tenor and terms in definitive form in an aggregate principal amount equal to the principal amount of the Global Security or Securities representing such series in exchange for such Global Security or Securities. The Company may at any time and in its sole discretion determine that the Securities of any series issued in the form of one or more Global Securities shall no longer be represented by such Global Security or Securities. In such event, the Company will execute, and the Trustee, upon receipt of a Company Order for the authentication and delivery of definitive Securities of such series, will deliver, Securities of such series of like tenor and terms in definitive form in an aggregate principal amount equal to the principal amount of the Global Security or Securities representing such series in exchange for such Global Security or Securities. If specified by the Company pursuant to Section 3.01 with respect to a series of Securities, the Depositary for such series of Securities may surrender a Global Security for such series of Securities in exchange in whole or in part for Securities of such series of like tenor and terms and in definitive form on such terms as are acceptable to the Company, the Trustee and such Depositary. Thereupon, the Company shall execute, and the Trustee upon receipt of a Company Order for the authentication and delivery of definitive Securities of such series, shall authenticate and deliver, without service charge: (a) to the Depositary or to each Person specified by such Depositary a new Security or Securities of the same series, of like tenor and terms and of any authorized denomination as requested by such Person in aggregate principal amount equal to and in exchange for such Person's beneficial interest in the Global Security; and (b) to such Depositary a new Global Security of like tenor and terms and in an authorized denomination equal to the difference, if any, between the principal amount of the surrendered Global Security and the aggregate principal amount of Securities delivered to Holders thereof. In any exchange provided for in any of the preceding three paragraphs, the Company will execute and the Trustee, pursuant to a Company Order, will authenticate and deliver, Securities (a) in definitive registered form in authorized denominations, if the Securities of such series are issuable as Registered Securities, (b) in definitive bearer form in authorized denominations, with coupons attached, if the Securities of such series are issuable as Bearer Securities or (c) as either Registered or Bearer Securities, if the Securities of such series are issuable in either form; provided, however, that no definitive Bearer Security shall be delivered in exchange for a temporary Global Security other than in accordance with the provisions of Sections 3.03 and 3.04. Upon the exchange of Global Securities for Securities in definitive form, such Global Securities shall be canceled by the Trustee. Registered Securities issued in exchange for a Global Security pursuant to this Section 3.05 shall be registered in such names and in such authorized denominations, and delivered to such addresses, as the Depositary for such Global Security, pursuant to instructions from its direct or indirect participants or otherwise, shall instruct the Trustee in writing. The Trustee shall deliver such Registered Securities to the Persons in whose names such Securities are so registered or to the Depositary. The Trustee shall deliver Bearer Securities issued in exchange for a Global Security pursuant to this Section 3.05 to the Depositary or to the Persons at such addresses, and in such authorized denominations, as the Depositary for such Global Security, pursuant to instructions from its direct or indirect participants or otherwise, shall instruct the Trustee in writing; provided, however, that no definitive Bearer Security shall be delivered in exchange for a temporary Global Security other than in accordance with the provisions of Sections 3.03 and 3.04. 27
All Securities issued upon any registration of transfer or exchange of Securities shall be the valid obligations of the Company, evidencing the same debt, and entitled to the same benefits under this Indenture, as the Securities surrendered upon such registration of transfer or exchange. Every Security presented or surrendered for registration of transfer or exchange shall (if so required by the Company or the Security Registrar) be duly endorsed, or be accompanied by a written instrument of transfer in form satisfactory to the Company and the Security Registrar duly executed, by the Holder thereof or his attorney duly authorized in writing. Unless otherwise provided in the Securities to be registered for transfer or exchanged, no service charge shall be made for any registration of transfer or exchange of Securities, but the Company may (unless otherwise provided in such Securities) require payment of a sum sufficient to cover any tax or other governmental charge that may be imposed in connection with any registration of transfer or exchange of Securities, other than exchanges expressly provided in this Indenture to be made at the Company's own expense or without expense or without charge to Holders. Neither the Company, the Security Registrar nor any Co-Security Registrar shall be required (i) to issue, register the transfer of or exchange any Securities of any series during a period beginning at the opening of business 15 days before the day of selection of Securities of such series to be redeemed and ending at the close of business on (A) if Securities of the series are issuable only as Registered Securities, the day of the mailing of the relevant notice of redemption of Registered Securities of such series so selected for redemption or (B) if Securities of the series are issuable as Bearer Securities, the day of the first publication of the relevant notice of redemption or, if Securities of the series are also issuable as Registered Securities and there is no publication, the mailing of the relevant notice of redemption, or (ii) to register the transfer or exchange of any Securities or portions thereof so selected for redemption. Notwithstanding anything herein to the contrary, the exchange of Bearer Securities into Registered Securities shall be subject to applicable laws and regulations in effect at the time of exchange; none of the Company, the Trustee nor the Security Registrar shall exchange any Bearer Securities into Registered Securities if it has received an Opinion of Counsel that as a result of such exchanges the Company would suffer adverse consequences under the United States federal income tax laws and regulations then in effect and the Company has delivered to the Trustee a Company Order directing the Trustee not to make such exchanges unless and until the Trustee receives a subsequent Company Order to the contrary. The Company shall deliver copies of such Company Orders to the Security Registrar. SECTION 3.06. Mutilated, Destroyed, Lost and Stolen Securities. If (i) any mutilated Security or Security with a mutilated coupon is surrendered to the Trustee or the Security Registrar, or if the Company, the Trustee and the Security Registrar receive evidence to their satisfaction of the destruction, loss or theft of any Security or coupon and (ii) there is delivered to the Company, the Trustee and the Security Registrar such security or indemnity as may be required by them to save each of them harmless, then, in the absence of notice to the Company, the Trustee or the Security Registrar that such Security has been acquired by a bona fide purchaser, the Company shall execute and upon its request the Trustee shall authenticate and deliver, in lieu of any such mutilated, destroyed, lost or stolen Security or in exchange for the Security to which a mutilated, destroyed, lost or stolen coupon appertains (with all appurtenant coupons not mutilated, destroyed, lost or stolen), a new Security of the same series and Stated Maturity and of like tenor and principal amount, bearing a number not contemporaneously outstanding and, if applicable, with coupons corresponding to the coupons appertaining thereto; provided, however , that any new Bearer Security will be delivered only in compliance with the conditions set forth in Section 3.05. In case any such mutilated, destroyed, lost or stolen Security or coupon has become or is about to become due and payable, the Company in its discretion may, instead of issuing a new Security, pay such Security; provided, however, that payment of principal of (and premium, if any) and any interest on Bearer Securities shall be payable only at an office or agency located outside the United States, and, in the case of interest, unless otherwise specified as contemplated by Section 3.01, only upon presentation and surrender of the coupons appertaining thereto. Upon the issuance of any new Security under this Section, the Company may require the payment of a sum sufficient to cover any tax or other governmental charge that may be imposed in relation thereto and any other expenses (including the fees and expenses of the Trustee) connected therewith. Every new Security of any series, with its coupons, if any, issued pursuant to this Section in exchange for any mutilated Security or in lieu of any destroyed, lost or stolen Security, or in exchange for a Security with a mutilated, destroyed, lost or stolen coupon, shall constitute an original additional contractual obligation of the Company, whether or not the mutilated, destroyed, lost or stolen Security and its coupons, if any, or the mutilated, destroyed, lost or stolen coupon shall be at any time enforceable by anyone, and shall be entitled to all the benefits of this Indenture equally and proportionately with any and all other Securities of the same series and their coupons, if any, duly issued hereunder. 28
The provisions of this Section are exclusive and shall preclude (to the extent lawful) all other rights and remedies with respect to the replacement or payment of mutilated, destroyed, lost or stolen Securities or coupons. SECTION 3.07. Payment of Interest; Interest Rights Preserved. Unless otherwise provided as contemplated by Section 3.01, interest on any Registered Security which is payable, and is punctually paid or duly provided for, on any Interest Payment Date shall unless otherwise provided in such Security be paid to the Person in whose name that Security (or one or more Predecessor Securities) is registered at the close of business on the Regular Record Date for such interest. Unless otherwise specified as contemplated by Section 3.01, in case a Bearer Security of any series is surrendered in exchange for a Registered Security of such series after the close of business (at an office or agency referred to in Section 3.05) on any Regular Record Date and before the opening of business (at such office or agency) on the next succeeding Interest Payment Date, such Bearer Security shall be surrendered without the coupon relating to such Interest Payment Date and interest will not be payable on such Interest Payment Date in respect of the Registered Security issued in exchange for such Bearer Security, but will be payable only to the Holder of such coupon when due in accordance with the provisions of this Indenture. At the option of the Company, payment of interest on any Registered Security may be made by check in the currency designated for such payment pursuant to the terms of such Registered Security mailed to the address of the Person entitled thereto as such address shall appear in the Security Register or by wire transfer to an account in such currency designated by such Person in writing not later than ten days prior to the date of such payment. Any interest on any Registered Security which is payable, but is not punctually paid or duly provided for, on any Interest Payment Date (herein called "Defaulted Interest") shall forthwith cease to be payable to the Holder on the relevant Regular Record Date by virtue of his having been such Holder, and such Defaulted Interest may be paid by the Company, at its election in each case, as provided in clause (i) or clause (ii) below. (i) The Company may elect to make payments of any Defaulted Interest to the Persons in whose names any such Registered Securities (or their respective Predecessor Securities) are registered at the close of business on a Special Record Date for the payment of such Defaulted Interest, which shall be fixed in the following manner. The Company shall notify the Trustee in writing of the amount of Defaulted Interest proposed to be paid on each Registered Security and the date of the proposed payment, and at the same time the Company shall deposit with the Trustee an amount of money equal to the aggregate amount proposed to be paid in respect of such Defaulted Interest or shall make arrangements satisfactory to the Trustee for such deposit prior to the date of the proposed payment, such money when deposited to be held in trust for the benefit of the Persons entitled to such Defaulted Interest as in this clause provided. Thereupon the Trustee shall fix a Special Record Date for the payment of such Defaulted Interest which shall be not more than 15 nor less than 10 days prior to the date of the proposed payment and not less than 10 days after the receipt by the Trustee of the notice of the proposed payment. The Trustee shall promptly notify the Company of such Special Record Date and, in the name and at the expense of the Company, shall cause notice of the proposed payment of such Defaulted Interest and the Special Record Date therefor to be mailed, first class, postage prepaid, to each Holder at his address as it appears in the Security Register, not less than 10 days prior to such Special Record Date. Notice of the proposed payment of such Defaulted Interest and the Special Record Date therefor having been mailed as aforesaid, such Defaulted Interest shall be paid to the Persons in whose names such Registered Securities (or their respective Predecessor Securities) are registered on such Special Record Date and shall no longer be payable pursuant to the following clause (ii). In case a Bearer Security of any series is surrendered at the office or agency in a Place of Payment for such series in exchange for a Registered Security of such series after the close of business at such office or agency on any Special Record Date and before the opening of business at such office or agency on the related proposed date of payment of Defaulted Interest, such Bearer Security shall be surrendered without the coupon relating to such proposed date for payment and Defaulted Interest will not be payable on such proposed date for payment in respect of the Registered Security issued in exchange for such Bearer Security, but will be payable only to the Holder of such coupon when due in accordance with the provisions of this Indenture. (ii) The Company may make payment of any Defaulted Interest in any other lawful manner not inconsistent with the requirements of any securities exchange on which the Securities with respect to which there exists such default may be listed, and upon such notice as may be required by such exchange, if, after notice given by the Company to the Trustee of the proposed payment pursuant to this clause, such payment shall be deemed practicable by the Trustee. Subject to the foregoing provisions of this Section, each Security delivered under this Indenture upon registration of transfer of, or in exchange for, or in lieu of, any other Security shall carry the rights to interest accrued and unpaid, and to accrue, which were carried by such other Security. Subject to the limitations set forth in Section 5.02, the Holder of any coupon appertaining to a Bearer Security shall be entitled to receive the interest payable on such coupon upon presentation and surrender of such coupon on or after the Interest Payment Date of such coupon at an office or agency maintained for such purpose pursuant to Section 5.02. SECTION 3.08. Persons Deemed Owners. Title to any Bearer Security, any coupons appertaining thereto and any temporary Global Security shall pass by delivery. 29
Prior to due presentment for registration of transfer of any Registered Security, the Company, the Trustee and any agent of the Company or the Trustee may treat the Person in whose name such Security is registered as the owner of such Security for the purpose of receiving payment of principal of, premium, if any, and (subject to Section 3.07) interest on such Security, and for all purposes whatsoever, whether or not such Security be overdue, and neither the Company, the Trustee nor any agent of the Company or the Trustee shall be affected by notice to the contrary. The Company, the Trustee and any agent of the Company or the Trustee may treat the bearer of any Bearer Security and the bearer of any coupon as the absolute owner of such Security or coupon for the purpose of receiving payment thereof or on account thereof and for all other purposes whatsoever whether or not such Security or coupon be overdue, and neither the Company, the Trustee nor any agent of the Company or the Trustee shall be affected by notice to the contrary. None of the Company, the Trustee, any Paying Agent, any Authenticating Agent or the Security Registrar will have the responsibility or liability for any aspect of the records relating to or payments made on account of beneficial ownership interest of a Global Security or for maintaining, supervising or reviewing any records relating to such beneficial ownership interest, and they shall be fully protected in acting or refraining from acting on any such information provided by the Depositary. SECTION 3.09. Cancellation. Unless otherwise provided with respect to a series of Securities, all Securities and coupons surrendered for payment, registration of transfer, exchange, repayment or redemption shall, if surrendered to any Person other than the Trustee, be delivered to the Trustee. All Securities so delivered or surrendered directly to the Trustee for any such purpose shall be promptly cancelled by it. The Company may at any time deliver to the Trustee for cancellation any Securities previously authenticated and delivered hereunder which the Company may have acquired in any manner whatsoever, and all Securities so delivered shall be promptly cancelled by the Trustee. No Securities shall be authenticated in lieu of or in exchange for any Securities cancelled as provided in this Section, except as expressly permitted by this Indenture or such Securities. All cancelled Securities or coupons held by the Trustee shall be destroyed by the Trustee and the Trustee shall deliver a certificate of such destruction to the Company. SECTION 3.10. Computation of Interest. Interest on the Securities of each series shall be computed as shall be specified as contemplated by Section 3.01. SECTION 3.11. Form of Certification. Unless otherwise provided pursuant to Section 3.01: (i) Whenever any provision of this Indenture or the forms of Securities contemplate that certification be given by a Person entitled to receive a Bearer Security, such certification shall be provided substantially in the form of Exhibit A hereto, with only such changes as shall be approved by the Company. (ii) Whenever any provision of this Indenture or the forms of Securities contemplate that certification be given by Euroclear and CEDEL S.A. in connection with the exchange of a portion of a temporary Global Security, such certification shall be provided substantially in the form of Exhibit B hereto, with only such changes as shall be approved by the Company. (iii) Whenever any provision of the Indenture or the forms of Securities contemplate that certification be given by Euroclear and CEDEL S.A. in connection with payment of interest with respect to a temporary Global Security prior to the related Global Exchange Date, such certification shall be provided substantially in the form of Exhibit C hereto, with only such changes as shall be approved by the Company. (iv) Whenever any provision of the Indenture or the forms of Securities contemplate that certification be given by a beneficial owner of a portion of a temporary Global Security in connection with payment of interest with respect to a temporary Global Security prior to the related Global Exchange Date, such certification shall be provided substantially in the form of Exhibit D hereto, with only such changes as shall be approved by the Company. SECTION 3.12. Judgments. The Company may provide, pursuant to Section 3.01, for the Securities of any series that, to the fullest extent possible under applicable law and except as may otherwise be specified as contemplated in Section 3.01, (a) the obligation, if any, of the Company to pay the principal of (and premium, if any) and interest of the Securities of any series and any appurtenant coupons in a Foreign Currency, composite currency or Dollars (the "Designated Currency") as may be specified pursuant to Section 3.01 is of the essence and agrees that judgments in respect of such Securities shall be given in the Designated Currency; (b) the obligation of the Company to make payments in the Designated Currency of the principal of (and premium, if any) and interest on such Securities and any appurtenant coupons shall, notwithstanding any payment in any other currency (whether pursuant to a judgment or otherwise), be discharged only to the extent of the amount in the Designated Currency that the Holder receiving such payment may, in accordance with normal banking procedures, purchase with the sum paid in such other currency (after any premium and cost of exchange) in the country of issue of the Designated Currency in the case of Foreign Currency or Dollars or in the international banking community in the case of a composite currency on the Business Day immediately following the day on which such Holder receives such payment; (c) if the amount in the Designated Currency that may be so purchased for any reason falls short of the amount originally due, the Company shall pay such additional amounts as may be necessary to compensate for such shortfall; 30
and (d) any obligation of the Company not discharged by such payment shall be due as a separate and independent obligation and, until discharged as provided herein, shall continue in full force and effect. ARTICLE FOUR REDEMPTION OF SECURITIES SECTION 4.01. Applicability of Article. Securities of any series which are redeemable before their Stated Maturity shall be redeemable in accordance with their terms and, except as otherwise specified as contemplated by Section 3.01 for Securities of any series, in accordance with this Article. SECTION 4.02. Election To Redeem; Notice to Trustee. The election of the Company to redeem any Securities redeemable at the option of the Company shall be evidenced by an Officers' Certificate. In case of any redemption at the election of the Company of less than all the Securities of any series, the Company shall, at least 60 days prior to the Redemption Date fixed by the Company (unless a shorter notice shall be satisfactory to the Trustee), notify the Trustee and the Security Registrar of such Redemption Date and of the principal amount of Securities of such series to be redeemed. In the case of any redemption of Securities (i) prior to the expiration of any restriction on such redemption provided in the terms of such Securities or elsewhere in this Indenture, or (ii) pursuant to an election of the Company which is subject to a condition specified in the terms of such Securities, the Company shall furnish the Trustee with an Officers' Certificate evidencing compliance with such restriction. SECTION 4.03. Selection by Security Registrar of Securities To Be Redeemed. If less than all the Securities of any series with the same terms are to be redeemed, the particular Securities to be redeemed shall be selected not more than 60 days prior to the Redemption Date by the Security Registrar from the Outstanding Securities of such series having such terms not previously called for redemption, by such method as the Security Registrar shall deem fair and appropriate and which may provide for the selection for redemption of portions of the principal amount of Securities of such series of a denomination equal to or larger than the minimum authorized denomination for Securities of such series. Unless otherwise provided by the terms of the Securities of any series so selected for partial redemption, the portions of the principal of Securities of such series so selected for partial redemption shall be, in the case of Registered Securities, equal to $1,000 or an integral multiple thereof or, in the case of Bearer Securities, equal to $5,000 or an integral multiple thereof, and the principal amount of any such Security which remains outstanding shall not be less than the minimum authorized denomination for Securities of such series. The Security Registrar shall promptly notify the Company, the Trustee and the Co-Security Registrar, if any, in writing of the Securities selected for redemption and, in the case of any Security selected for partial redemption, the principal amount thereof to be redeemed. For all purposes of this Indenture, unless the context otherwise requires, all provisions relating to the redemption of Securities shall relate, in the case of any Security redeemed or to be redeemed only in part, to the portion of the principal of such Security which has been or is to be redeemed. SECTION 4.04. Notice of Redemption. Notice of redemption shall be given in the manner provided in Section 1.06, not less than 30 nor more than 60 days prior to the Redemption Date, to each Holder of Securities to be redeemed. All notices of redemption shall state: (i) the Redemption Date; (ii) the Redemption Price; (iii) if less than all Outstanding Securities of any series having the same terms are to be redeemed, the identification (and, in the case of partial redemption, the respective principal amounts) of the particular Securities to be redeemed; (iv) that on the Redemption Date the Redemption Price will become due and payable upon each such Security to be redeemed, and that interest, if any, thereon shall cease to accrue on and after said date; (v) the place or places where such Securities, together in the case of Bearer Securities with all remaining coupons appertaining thereto, if any, maturing after the Redemption Date, are to be surrendered for payment of the Redemption Price; (vi) that the redemption is for a sinking fund, if such is the case; and (vii) the CUSIP number or the Euroclear or the CEDEL reference number (or any other number used by a Depositary to identify such Securities), if any, of the Securities to be redeemed. 31
A notice of redemption published as contemplated by Section 1.06 need not identify particular Registered Securities to be redeemed. Notice of redemption of Securities to be redeemed at the election of the Company shall be given by the Company or, on Company Request, by the Trustee in the name and at the expense of the Company. SECTION 4.05. Deposit of Redemption Price. At or prior to the opening of business on any Redemption Date, the Company shall deposit or cause to be deposited with the Trustee or with a Paying Agent (or, if the Company is acting as its own Paying Agent, segregate and hold in trust as provided in Section 5.03) an amount of money sufficient to pay the Redemption Price of all the Securities which are to be redeemed on that date; provided, however, that deposits with respect to Bearer Securities shall be made with a Paying Agent or Paying Agents located outside the United States except as otherwise provided in Section 5.02, unless otherwise specified as contemplated by Section 3.01. SECTION 4.06. Securities Payable on Redemption Date. Notice of redemption having been given as aforesaid, the Securities so to be redeemed shall, on the Redemption Date, become due and payable at the Redemption Price therein specified and from and after such date (unless the Company shall default in the payment of the Redemption Price) such Securities shall cease to bear interest and the coupons for such interest appertaining to any Bearer Securities so to be redeemed, except to the extent provided below, shall be void. Upon surrender of any such Securities for redemption in accordance with said notice, such Securities shall be paid by the Company at the Redemption Price; provided, however, that installments of interest on Bearer Securities whose Stated Maturity is on or prior to the Redemption Date shall be payable only at an office or agency located outside the United States and, unless otherwise specified as contemplated by Section 3.01, only upon presentation and surrender of coupons for such interest. Installments of interest on Registered Securities whose Stated Maturity is on or prior to the Redemption Date shall be payable to the Holders of such Securities, or one or more Predecessor Securities, registered as such on the close of business on the relevant Regular Record Dates according to their terms and the provisions of Section 3.07. If any Bearer Security surrendered for redemption shall not be accompanied by all appurtenant coupons maturing after the Redemption Date, such Security may be paid after deducting from the Redemption Price an amount equal to the face amount of all such missing coupons, or the surrender of such missing coupon or coupons may be waived by the Company and the Trustee if there be furnished to them such security or indemnity as they may require to save each of them and any Paying Agent harmless. If thereafter the Holder of such Security shall surrender to the Trustee or any Paying Agent any such missing coupon in respect of which a deduction shall have been made from the Redemption Price, such Holder shall be entitled to receive the amount so deducted; provided, however, that interest represented by coupons shall be payable only at an office or agency located outside the United States and, unless otherwise specified as contemplated by Section 3.01, only upon presentation and surrender of those coupons. If any Security called for redemption shall not be paid upon surrender thereof for redemption, the principal shall, until paid, bear interest from the Redemption Date at the rate borne by such Security, or as otherwise provided in such Security. SECTION 4.07. Securities Redeemed in Part. Any Security which is to be redeemed only in part shall be surrendered at the office or agency of the Company in a Place of Payment therefor (with, if the Company or the Security Registrar so requires, due endorsement by, or a written instrument of transfer in form satisfactory to the Company and the Security Registrar duly executed by, the Holder of such Security or his attorney duly authorized in writing), and the Company shall execute, and the Trustee shall authenticate and deliver to the Holder of such Security without service charge, a new Security or Securities of the same series and Stated Maturity, containing identical terms and conditions, of any authorized denominations as requested by such Holder, in aggregate principal amount equal to and in exchange for the unredeemed portion of the principal of the Security so surrendered. SECTION 4.08. Redemption Suspended During Event of Default. The Trustee shall not redeem any Securities (unless all Securities then Outstanding are to be redeemed) or commence the giving of any notice of redemption of Securities during the continuance of any Event of Default known to the Trustee, except that where the giving of notice of redemption of any Securities shall theretofore have been made, the Trustee shall, subject to the provisions of Section 14.04, redeem such Securities, provided funds are deposited with it for such purpose. Subject to the rights of the holders of Senior Indebtedness and creditors in respect of General Obligations, except as aforesaid, any moneys theretofore or thereafter received by the Trustee shall, during the continuance of such Event of Default, be held in trust for the benefit of the Holders and applied in the manner set forth in Section 7.06; provided, however, that in case such Event of Default shall have been waived as provided herein or otherwise cured, such moneys shall thereafter be held and applied in accordance with the provisions of this Article. ARTICLE FIVE COVENANTS SECTION 5.01. Payment of Principal, Premium and Interest. The Company covenants and agrees for the benefit of each series of Securities that it will duly and punctually pay the principal of, premium, if any, and interest on the Securities of such series in accordance with the terms of the Securities of such series, any coupons appertaining thereto and this Indenture. Unless otherwise specified as contemplated by Section 3.01 with respect to any series of Securities, any interest due on Bearer Securities on or before 32
Maturity shall be payable only outside the United States upon presentation and surrender of the several coupons for such interest installments as are evidenced thereby as they severally mature. SECTION 5.02. Maintenance of Office or Agency. If Securities of a series are issuable only as Registered Securities, the Company will maintain in each Place of Payment for any series of Securities an office or agency where Securities of that series may be presented or surrendered for payment, where Securities of that series may be surrendered for registration of transfer or exchange and where notices and demands to or upon the Company in respect of the Securities of that series and this Indenture may be served. The Company will give prompt written notice to the Trustee of the location, and of any change in the location, of such office or agency. If Securities of a series may be issuable as Bearer Securities, the Company will maintain (A) in the Borough of Manhattan, the City of New York an office or agency where any Registered Securities of that series may be presented or surrendered for payment, where any Registered Securities of that series may be surrendered for registration of transfer, where Securities of that series may be surrendered for exchange and where notices and demands to or upon the Company in respect of the Securities of that series and this Indenture may be served, (B) subject to any laws or regulations applicable thereto, in a Place of Payment for that series which is located outside the United States, an office or agency where Securities of that series and related coupons may be presented and surrendered for payment (including payment of any additional amounts payable on Securities of that series pursuant to Section 5.04); provided, however, that if the Securities of that series are listed on The International Stock Exchange of the United Kingdom and the Republic of Ireland Limited or the Luxembourg Stock Exchange or any other stock exchange located outside the United States and such stock exchange shall so require, the Company will maintain a Paying Agent for the Securities of that series in London or Luxembourg or any other required city located outside the United States, as the case may be, so long as the Securities of that series are listed on such exchange, and (C) subject to any laws or regulations applicable thereto, in a Place of Payment for such series located outside the United States an office or agency where any Registered Securities of that series may be surrendered for registration of transfer, where Securities of that series may be surrendered for exchange and where notices and demands to or upon the Company in respect of the Securities of that series and this Indenture may be served. The Company will give prompt written notice to the Trustee of the location, and any change in the location, of any such office or agency. If at any time the Company shall fail to maintain any such required office or agency in respect of any series of Securities or shall fail to furnish the Trustee with the address thereof, such presentations, and surrenders of Securities of that series may be made and notices and demands may be made or served at the Principal Corporate Trust Office of the Trustee, except that Bearer Securities of that series and the related coupons may be presented and surrendered for payment (including payment of any additional amounts payable on Bearer Securities of that series pursuant to Section 5.04) at the place specified for the purpose as contemplated by Section 3.01, and the Company hereby appoints the Trustee as its agent to receive such respective presentations, surrenders, notices and demands. Except as otherwise provided in the form of Bearer Security of any particular series pursuant to the provisions of this Indenture, no payment of principal, premium or interest on Bearer Securities shall be made at any office or agency of the Company in the United States or by check mailed to any address in the United States or by transfer to an account maintained with a bank located in the United States; provided, however, payment of principal of and any premium and interest denominated in Dollars (including additional amounts payable in respect thereof) on any Bearer Security may be made at an office or agency of, and designated by, the Company located in the United States if (but only if) payment of the full amount of such principal, premium, interest or additional amounts in Dollars at all offices outside the United States maintained for the purpose by the Company in accordance with this Indenture is illegal or effectively precluded by exchange controls or similar restrictions and the Trustee receives an Opinion of Counsel that such payment within the United States is legal. Unless otherwise provided as contemplated by Section 3.01 with respect to any series of Securities, at the option of the Holder of any Bearer Security or related coupon, payment may be made by check in the currency designated for such payment pursuant to the terms of such Bearer Security presented or mailed to an address outside the United States or by transfer to an account in such currency maintained by the payee with a bank located outside the United States. The Company may also from time to time designate one or more other offices or agencies where the Securities of one or more series may be presented or surrendered for any or all of such purposes specified above in this Section and may constitute and appoint one or more Paying Agents for the payment of such Securities, in one or more other cities, and may from time to time rescind such designations and appointments; provided, however, that no such designation, appointment or rescission shall in any manner relieve the Company of its obligation to maintain an office or agency in each Place of Payment for Securities of any series for such purposes. The Company will give prompt written notice to the Trustee of any such designation or rescission and of any change in the location of any such other office or agency. Unless and until the Company rescinds one or more such appointments, the Company hereby appoints Citibank, N.A., as its Paying Agent in the City of New York with respect to all series of Securities having a Place of Payment in the City of New York. SECTION 5.03. Money for Security Payments To Be Held in Trust. If the Company shall at any time act as its own Paying Agent for any series of Securities, it will, on or before each due date of the principal of, premium, if any, or interest on any of the Securities of such series and any appurtenant coupons, segregate and hold in trust for the benefit of the Persons entitled thereto a sum sufficient to pay the principal, premium or interest so becoming due until such sums shall be paid to such Persons or otherwise disposed of as herein provided, and will promptly notify the Trustee of its action or failure so to act. Whenever the Company shall have one or more Paying Agents for any series of Securities, it will, at or prior to the opening of business on each due date of the principal of, premium, if any, or interest on any Securities of such series and any appurtenant 33
coupons, deposit with a Paying Agent a sum sufficient to pay the principal, premium or interest so becoming due, such sum to be held in trust for the benefit of the Persons entitled to such principal, premium or interest, and (unless such Paying Agent is the Trustee) the Company will promptly notify the Trustee of its action or failure so to act. The Company will cause each Paying Agent other than the Trustee for any series of Securities to execute and deliver to the Trustee an instrument in which such Paying Agent shall agree with the Trustee subject to the provisions of this Section, that such Paying Agent will: (i) hold all sums held by it for the payment of principal of, premium, if any, or interest on Securities of such series and any appurtenant coupons in trust for the benefit of the Persons entitled thereto until such sums shall be paid to such Persons or otherwise disposed of as herein provided; (ii) give the Trustee notice of any default by the Company (or any other obligor upon the Securities of such series) in the making of any payment of principal, premium or interest on the Securities of such series or any appurtenant coupons; and (iii) at any time during the continuance of any such default, upon the written request of the Trustee, forthwith pay to the Trustee all sums so held in trust by such Paying Agent. The Company may at any time, for the purpose of obtaining the satisfaction and discharge of this Indenture or for any other purpose, pay, or by Company Order direct any Paying Agent to pay, to the Trustee all sums held in trust by the Company or such Paying Agent, such sums to be held by the Trustee upon the same trusts as those upon which such sums were held by the Company or such Paying Agent, and, upon such payments by any Paying Agent to the Trustee, such Paying Agent shall be released from all further liability with respect to such money. Any money deposited with the Trustee or any Paying Agent, or then held by the Company, in trust for the payment of the principal of, premium, if any, or interest on any Security of any series or any appurtenant coupons and remaining unclaimed for two years after such principal, premium or interest has become due and payable shall be paid to the Company on Company Request, or (if then held by the Company) shall be discharged from such trust, and the Holder of such Security or any coupon appertaining thereto shall thereafter, as an unsecured general creditor, look only to the Company for payment thereof, and all liability of the Trustee or such Paying Agent with respect to such trust money, and all liability of the Company as trustee thereof, shall thereupon cease; provided, however, that the Trustee or such Paying Agent, before being required to make any such repayment, may at the expense of the Company cause to be published once, in an Authorized Newspaper in each Place of Payment, notice that such money remains unclaimed and that, after a date specified therein, which shall not be less than 30 days from the date of such publication, any unclaimed balance of such money then remaining will be repaid to the Company. SECTION 5.04. Additional Amounts. If the Securities of a series provide for the payment of additional amounts, the Company will pay to the Holder of any Security of any series or any coupon appertaining thereto additional amounts as provided therein. Whenever in this Indenture there is mentioned, in any context, the payment of the principal of (or premium, if any) or interest on, or in respect of, any Security of any series or payment of any related coupon or the net proceeds received on the sale or exchange of any Security of any series, such mention shall be deemed to include mention of the payment of additional amounts provided for in this Section to the extent that, in such context, additional amounts are, were or would be payable in respect thereof pursuant to the provisions of this Section and express mention of the payment of additional amounts (if applicable) in any provisions hereof shall not be construed as excluding additional amounts in those provisions hereof where such express mention is not made. If the Securities of a series provide for the payment of additional amounts, at least 10 days prior to the first Interest Payment Date with respect to that series of Securities (or if the Securities of that series will not bear interest prior to Maturity, the first day on which a payment of principal (and premium, if any) is made), and at least 10 days prior to each date of payment of principal (and premium, if any) or interest if there has been any change with respect to the matters set forth in the below-mentioned Officers' Certificate, the Company will furnish the Trustee and the Company's Principal Paying Agent or Paying Agents, if other than the Trustee, with an Officers' Certificate instructing the Trustee and such Paying Agent or Paying Agents whether such payment of principal of (and premium, if any) or interest on the Securities of that series shall be made to Holders of Securities of that series or any related coupons who are United States Aliens without withholding for or on account of any tax, assessment or other governmental charge described in the Securities of that series. If any such withholding shall be required, then such Officers' Certificate shall specify by country the amount, if any, required to be withheld on such payments to such Holders of Securities or coupons and the Company will pay to the Trustee or such Paying Agent the additional amounts required by this Section. The Company covenants to indemnify the Trustee and any Paying Agent for, and to hold them harmless against, any loss, liability or expense reasonably incurred without negligence or bad faith on their part arising out of or in connection with actions taken or omitted by any of them in reliance on any Officers' Certificate furnished pursuant to this Section. SECTION 5.05. Statement as to Compliance. The Company will deliver to the Trustee, within 120 days after the end of each fiscal year of the Company, an Officers' Certificate (provided, however, that one of the signatories of which shall be the Company's principal executive officer, principal financial officer or principal accounting officer) stating, as to each signer thereof, that: 34
(i) a review of the activities of the Company during such year and of performance under this Indenture and under the terms of the Securities has been made under his supervision; and (ii) to the best of his knowledge, based on such review, (a) the Company has fulfilled all its obligations and complied with all conditions and covenants under this Indenture and under the terms of the Securities throughout such year, or, if there has been a default in the fulfillment of any such obligation, condition or covenant specifying each such default known to him and the nature and status thereof, and (b) no event has occurred and is occurring which is, or after notice or lapse of time or both would become, a Default, or if such an event has occurred and is continuing, specifying such event known to him and the nature and status thereof. For purposes of this Section, compliance or default shall be determined without regard to any period of grace or requirement of notice provided for herein. SECTION 5.06. Maintenance of Corporate Existence, Rights and Franchises. So long as any of the Securities shall be Outstanding, the Company will do or cause to be done all things necessary to preserve and keep in full force and effect its corporate existence, rights and franchises to carry on its business; provided, however, that nothing in this Section 5.06 shall (i) require the Company to preserve any such right or franchise if the Board of Directors shall determine that the preservation thereof is no longer desirable in the conduct of the business of the Company and that the loss thereof is not disadvantageous in any material respect to the Holders, (ii) prevent any consolidation or merger of the Company, or any conveyance or transfer of its property and assets substantially as an entirety to any person, permitted by Article Ten, (iii) prevent the liquidation or dissolution of the Company after any conveyance or transfer of its property and assets substantially as an entirety to any person permitted by Article Ten. ARTICLE SIX HOLDERS' LISTS AND REPORTS BY TRUSTEE AND COMPANY SECTION 6.01. Company To Furnish Trustee Names and Addresses of Holders. The Company will furnish or cause to be furnished to the Trustee (i) semiannually, not more than 10 days after each March 1 and September 1, a list, in such form as the Trustee may reasonably require, containing all the information in the possession or control of the Company, any of its Paying Agents (other than the Trustee) or the Security Registrar, if other than the Trustee, as to the names and addresses of the Holders of Securities as of the preceding February 15 and August 15, as the case may be, and (ii) at such other times as the Trustee may request in writing, within 30 days after receipt by the Company of any such request, a list of similar form and content as of a date not more than 15 days prior to the time such list is requested to be furnished; provided, however, that if and so long as the Trustee is the Security Registrar for Securities of a series, no such list need be furnished with respect to such Series of Securities. SECTION 6.02. Preservation of Information; Communications to Holders. (i) The Trustee shall preserve, in as current a form as is reasonably practicable, the names and addresses of Holders of Securities contained in the most recent list furnished to the Trustee as provided in Section 6.01 and the names and addresses of Holders of Securities received by the Trustee in its capacity as the Security Registrar, if so acting. The Trustee may destroy any list furnished to it as provided in Section 6.01 upon receipt of a new list so furnished. (ii) If three or more Holders of Securities of any series (hereinafter referred to as "applicants") apply in writing to the Trustee, and furnish to the Trustee reasonable proof that each such applicant has owned a Security of such series for a period of at least six months preceding the date of such application, and such application states that the applicants desire to communicate with other Holders of Securities of such series or with the Holders of all Securities with respect to their rights under this Indenture or under such Securities and is accompanied by a copy of the form of proxy or other communication which such applicants propose to transmit, then the Trustee shall, within five Business Days after the receipt of such application, at its election, either: (a) afford such applicants access to the information preserved at the time by the Trustee in accordance with Section 6.02(i); or (b) inform such applicants as to the approximate number of Holders of Securities of such series or all Securities, as the case may be, whose names and addresses appear in the information preserved at the time by the Trustee in accordance with Section 6.02(i), and as to the approximate cost of mailing to such Holders the form of proxy or other communication, if any, specified in such application. If the Trustee shall elect not to afford such applicants access to such information, the Trustee shall, upon the written request of such applicants, mail to each Holder of a Security of such series or all Holders of Securities, as the case may be, whose names and addresses appear in the information preserved at the time by the Trustee in accordance with Section 6.02(i), a copy of the form of proxy or other communication which is specified in such request, with reasonable promptness after a tender to the Trustee of the material to be mailed and of payment, or provision for the payment, of the reasonable expenses of mailing, unless, within five days after such tender, the Trustee shall mail to such applicants and file with the Commission, together with a copy of the material to be mailed, a written statement to the effect that, in the opinion of the Trustee, such mailing would be contrary to the best interests of the Holders of Securities of such series or all Securities, as the case may be, or would be in violation of applicable law. Such written 35
statement shall specify the basis of such opinion. If the Commission, after opportunity for a hearing upon the objections specified in the written statement so filed, shall enter an order refusing to sustain any of such objections or if, after the entry of an order sustaining one or more of such objections, the Commission shall find, after notice and opportunity for hearing, that all the objections so sustained have been met and shall enter an order so declaring, the Trustee shall mail copies of such material to all such Holders of Securities with reasonable promptness after the entry of such order and the renewal of such tender; otherwise, the Trustee shall be relieved of any obligation or duty to such applicants respecting their application. (iii) Every Holder of Securities, by receiving and holding the same, agrees with the Company and the Trustee that neither the Company nor the Trustee shall be held accountable by reason of the disclosure of any such information as to the names and addresses of the Holders of Securities in accordance with Section 6.02(ii), regardless of the source from which such information was derived, and that the Trustee shall not be held accountable by reason of mailing any material pursuant to a request made under Section 6.02(ii). SECTION 6.03. Reports by Trustee. (i) Within 60 days after May l of each year commencing with the year 1996, the Trustee shall mail to each Holder reports concerning the Trustee and its action under the Indenture as may be required pursuant to the Trust Indenture Act if and to the extent and in the manner provided pursuant thereto. (ii) Reports pursuant to this Section shall be transmitted by mail (1) to all Holders of Registered Securities, as their names and addresses appear in the Security Register and (2) to such Holders of Bearer Securities as have, within the two years preceding such transmission, filed their names and addresses with the Trustee for that purpose, and (3) except in the cases of reports under Section 313(b)(2) of the Trust Indenture Act, to each Holder of a Security of any series whose name and address appear in the information preserved at the time by the Trustee in accordance with Section 6.02(i). (iii) A copy of each such report shall, at the time of such transmission to Holders, be filed by the Trustee with each securities exchange upon which any Securities are listed, and also with the Commission. The Company will notify the Trustee when any Securities are listed on any securities exchange. SECTION 6.04. Reports by Company. The Company will: (i) file with the Trustee, within 15 days after the Company is required to file the same with the Commission, copies of the annual reports and of the information, documents and other reports (or copies of such portions of any of the foregoing as the Commission may from time to time by rules and regulations prescribe) which the Company may be required to file with the Commission pursuant to Section 13 or Section 15(d) of the Exchange Act; or, if the Company is not required to file information, documents or reports pursuant to either of said Sections, then it will file with the Trustee and the Commission, in accordance with rules and regulations prescribed from time to time by the Commission, such of the supplementary and periodic information, documents and reports which may be required pursuant to Section 13 of the Exchange Act in respect of a security listed and registered on a national securities exchange as may be prescribed from time to time in such rules and regulations; (ii) file with the Trustee and the Commission, in accordance with rules and regulations prescribed from time to time by the Commission, such additional information, documents and reports with respect to compliance by the Company with the conditions and covenants of this Indenture as may be required from time to time by such rules and regulations; and (iii) transmit by mail to Holders of Securities, in the manner and to the extent provided in Section 6.03(ii), within 30 days after the filing thereof with the Trustee, such summaries of any information, documents and reports required to be filed by the Company pursuant to paragraphs (i) and (ii) of this Section as may be required by rules and regulations prescribed from time to time by the Commission. ARTICLE SEVEN REMEDIES SECTION 7.01. Events of Default. "Event of Default", with respect to any series of Securities, wherever used herein, means any one of the following events (whatever the reason for such Event of Default and whether it shall be voluntary or involuntary or be effected by operation of law or pursuant to any judgment, decree or order of any court or any order, rule or regulation of any administrative or governmental body), unless it is either inapplicable to a particular series or it is specifically deleted or modified in the supplemental indenture or Board Resolution under which such series of Securities is issued or in the form of Security for such series: (i) the entry of a decree or order by a court having jurisdiction in the premises granting relief in respect of the Company in an involuntary case under the Federal Bankruptcy Code, adjudging the Company a bankrupt, or approving as properly filed a petition seeking reorganization, arrangement, adjustment or composition of or in respect of the Company under the Federal Bankruptcy Code or any other applicable Federal or State bankruptcy, insolvency or similar law, or appointing a receiver, liquidator, custodian, 36
assignee, trustee, sequestrator (or other similar official) of the Company, or of substantially all of its properties, or ordering the winding up or liquidation of its affairs under any such law, and the continuance of any such decree or order unstayed and in effect for a period of 60 consecutive days; or (ii) the institution by the Company of proceedings to be adjudicated a bankrupt, or the consent of the Company to the institution of bankruptcy proceedings against it, or the filing by the Company of a petition or answer or consent seeking reorganization or relief under the Federal Bankruptcy Code or any other applicable Federal or State bankruptcy, insolvency or similar law, or the consent by the Company to the filing of any such petition or to the appointment of a receiver, liquidator, custodian, assignee, trustee, sequestrator (or other similar official) of the Company, or of substantially all of its properties under any such law; or (iii) any other Event of Default provided with respect to Securities of that series. SECTION 7.02. Acceleration of Maturity; Rescission and Annulment. If an Event of Default with respect to any series of Securities for which there are Securities Outstanding occurs and is continuing, then, and in every such case, the Trustee or the Holders of not less than 25% in principal amount of the Outstanding Securities of such series may declare the principal of all the Securities of such series (or, if the Securities of that series are Original Issue Discount Securities, such portion of the principal amount as may be specified in the terms of that series) to be immediately due and payable, by a notice in writing to the Company (and to the Trustee if given by Holders), and upon any such declaration the same shall become immediately due and payable. At any time after such a declaration of acceleration with respect to Securities of any series has been made and before a judgment or decree for payment of the money due has been obtained by the Trustee as hereinafter in this Article provided, the Holders of a majority in principal amount of the Outstanding Securities of such series, by written notice to the Company and the Trustee, may rescind and annul such declaration and its consequences, and any Event of Default giving rise to such declaration shall not be deemed to have occurred, if: (i) the Company has paid or deposited with the Trustee a sum sufficient to pay: (a) all overdue installments of interest on all Securities of such series; (b) the principal of and premium, if any, on any Securities of such series which have become due otherwise than by such declaration of acceleration and interest thereon at the rate or rates prescribed therefor by the terms of the Securities of such series; (c) to the extent that payment of such interest is lawful, interest upon overdue installments of interest at the rate or rates prescribed therefor by the terms of the Securities of such series; and (d) all sums paid or advanced by the Trustee hereunder and the reasonable compensation, expenses, disbursements and advances of the Trustee, the Security Registrar, any Paying Agent, and their agents and counsel and all other amounts due the Trustee under Section 8.07. (ii) all other Defaults with respect to Securities of that series, other than the nonpayment of the principal of Securities of that series which have become due solely by such declaration of acceleration, have been cured or waived as provided in Section 7.13. No such recession shall affect any subsequent default or impair any right consequent thereon. SECTION 7.03. Collection of Indebtedness and Suits for Enforcement by Trustee. The Company covenants that if: (i) default is made in the payment of any installment of interest on any Security of any series when such interest becomes due and payable and such default continues for a period of 30 days, or (ii) default is made in the payment of the principal of or premium, if any, on any Security of any series at the Maturity thereof, the Company will, upon demand of the Trustee, pay to it, for the benefit of the Holder of any such Security or coupon appertaining thereto, if any, the whole amount then due and payable on any such Security or coupon for principal, premium, if any, and interest, with interest upon the overdue principal and premium, if any, and (to the extent that payment of such interest shall be lawful) upon overdue installments of interest, at the rate or rates prescribed therefor by the terms of any such Security; and, in addition thereto, such further amount as shall be sufficient to cover the reasonable costs and expenses of collection, including the reasonable compensation, expenses, disbursements and advances of the Trustee, its agents and counsel and any other amounts due the Trustee under Section 8.07. If the Company fails to pay such amounts forthwith upon such demand, the Trustee, in its own name and as trustee of an express trust, may institute a judicial proceeding for the collection of the sums so due and unpaid, and may prosecute such proceeding to judgment or final decree, and may enforce the same against the Company or any other obligor upon such Securities and collect the moneys adjudged or decreed to be payable in the manner provided by law out of the property of the Company or any other obligor upon such Securities, wherever situated. 37
If a Default with respect to any series of Securities occurs and is continuing, the Trustee may in its discretion proceed to protect and enforce its rights and the rights of the Holders of Securities of such series by such appropriate judicial proceedings as the Trustee shall deem most effectual to protect and enforce any such rights, whether for the specific enforcement of any covenant or agreement in this Indenture or in aid of the exercise of any power granted herein, or to enforce any other proper remedy. SECTION 7.04. Trustee May File Proofs of Claim. In case of the pendency of any receivership, insolvency, liquidation, bankruptcy, reorganization, arrangement, adjustment, composition or other judicial proceeding relative to the Company or any other obligor upon the Securities or the property of the Company or of such other obligor or their creditors, the Trustee (irrespective of whether the principal of any Securities shall then be due and payable as therein expressed or by declaration or otherwise and irrespective of whether the Trustee shall have made any demand on the Company for the payment of overdue principal, premium, if any, or interest) shall be entitled and empowered, by intervention in such proceeding or otherwise: (i) to file and prove a claim for the whole amount of principal, premium, if any, and interest owing and unpaid in respect of the Securities and to file such other papers or documents as may be necessary or advisable in order to have the claims of the Trustee (including any claim for the reasonable compensation, expenses, disbursements and advances of the Trustee, its agents and counsel and any other amounts due the Trustee under Section 8.07) and of the Holders allowed in such judicial proceeding; and (ii) to collect and receive any moneys or other property payable or deliverable on any such claims and to distribute the same, and any receiver, assignee, trustee, liquidator, sequestrator or other similar official in any such judicial proceeding is hereby authorized by each Holder to make such payments to the Trustee, and in the event that the Trustee shall consent to the making of such payments directly to the Holders, to pay to the Trustee any amount due to it for the reasonable compensation, expenses, disbursements and advances of the Trustee, its agents and counsel, and any other amounts due the Trustee under Section 8.07. Nothing herein contained shall be deemed to authorize the Trustee to authorize or consent to or accept or adopt on behalf of any Holder of a Security or coupon any plan of reorganization, arrangement, adjustment or composition affecting the Securities or the rights of any Holder thereof, or to authorize the Trustee to vote in respect of the claim of any Holder of a Security or coupon in any such proceeding. SECTION 7.05. Trustee May Enforce Claims Without Possession of Securities. All rights of action and claims under this Indenture or under the Securities of any series, or coupons (if any) appertaining thereto, may be prosecuted and enforced by the Trustee without the possession of any of the Securities of such series or coupons appertaining thereto or the production thereof in any proceeding relating thereto, and any such proceeding instituted by the Trustee shall be brought in its own name as trustee of an express trust, and any recovery of judgment shall, after provision for the payment of the reasonable compensation, expenses, disbursements and advances of the Trustee, its agents and counsel and any other amounts due the Trustee under Section 8.07, be for the ratable benefit of the Holders of the Securities of such series and coupons appertaining thereto in respect of which such judgment has been recovered. SECTION 7.06. Application of Money Collected. Any money collected by the Trustee with respect to a series of Securities pursuant to this Article shall be applied in the following order, at the date or dates fixed by the Trustee, and, in case of the distribution of such money on account of principal, premium, if any, or interest, upon presentation of the Securities of such series or coupons appertaining thereto, if any, or both, as the case may be, and the notation thereon of the payment if only partially paid and upon surrender thereof if fully paid: FIRST: To the payment of all amounts due the Trustee under Section 8.07; SECOND: To the payment of the amounts then due and unpaid upon the Securities of such series and coupons for principal, premium, if any, and interest, in respect of which or for the benefit of which such money has been collected, ratably, without preference or priority of any kind, according to the amounts due and payable on Securities of such series and coupons, if any, for principal, premium, if any, and interest, respectively. The Holders of each series of Securities denominated in ECU, any other composite currency or a Foreign Currency and any matured coupons relating thereto shall be entitled to receive a ratable portion of the amount determined by the Exchange Rate Agent by converting the principal amount Outstanding of such series of Securities and matured but unpaid interest on such series of Securities in the currency in which such series of Securities is denominated into Dollars at the Exchange Rate as of the date of declaration of acceleration of the Maturity of the Securities; and THIRD: The balance, if any, to the Person or Persons entitled thereto. SECTION 7.07. Limitation on Suits. No Holder of any Security of any series or any related coupons shall have any right to institute any proceeding, judicial or otherwise, with respect to this Indenture, or for the appointment of a receiver or trustee, or for any other remedy hereunder, unless: (i) such Holder has previously given written notice to the Trustee of a continuing Default with respect to Securities of such series; 38
(ii) the Holders of not less than a majority in principal amount of the Outstanding Securities of such series shall have made written request to the Trustee to institute proceedings in respect of such Default in its own name as Trustee hereunder; (iii) such Holder or Holders have offered to the Trustee reasonable indemnity against the costs, expenses and liabilities to be incurred in compliance with such request; (iv) the Trustee for 60 days after its receipt of such notice, request and offer of indemnity has failed to institute any such proceeding; and (v) no direction inconsistent with such written request has been given to the Trustee during such 60-day period by the Holders of a majority in principal amount of the Outstanding Securities of such series; it being understood and intended that no one or more Holders of Securities of such series shall have any right in any manner whatever by virtue of, or by availing of, any provision of this Indenture to affect, disturb or prejudice the rights of any other Holders of Securities of such series or to obtain or to seek to obtain priority or preference over any other such Holders or to enforce any right under this Indenture, except in the manner herein provided and for the equal and ratable benefit of all the Holders of Securities of such series. The following events shall be "Defaults" with respect to any series of Securities under this Indenture: (a) an Event of Default with respect to such series specified in Section 7.01; or (b) default in the payment of the principal of or premium, if any, on any Security of such series at its Maturity; or (c) default in the payment of any interest upon any Security of such series as and when the same shall become due and payable, and continuance of such default for a period of 90 days; or (d) failure on the part of the Company duly to observe or perform any of the other covenants or agreements on its part in the Securities of such series or in this Indenture and continuance of such failure for a period of 90 days after the date on which written notice of such failure, requiring the Company to remedy the same and stating that such notice is a "Notice of Default" hereunder, shall have been given by registered mail to the Company by the Trustee, or to the Company and the Trustee by the holders of at least 25% in aggregate principal amount of the Securities of such series at the time Outstanding; or (e) any other Default provided with respect to Securities of that Series. SECTION 7.08. Unconditional Right of Holders To Receive Principal, Premium and Interest. Notwithstanding any other provision in this Indenture, the Holder of any Security or coupon shall have the right, which is absolute and unconditional, to receive payment of the principal of, premium, if any, and (subject to Section 3.07) interest on such Security or payment of such coupon on the respective Stated Maturities expressed in such Security or coupon (or, in the case of redemption or repayment on the Redemption Date or Repayment Date) and to institute suit for the enforcement of such payment, and such rights shall not be impaired without the consent of such Holder. SECTION 7.09. Restoration of Rights and Remedies. If the Trustee or any Holder of a Security or coupon has instituted any proceeding to enforce any right or remedy under this Indenture and such proceeding has been discontinued or abandoned for any reason, or has been determined adversely to the Trustee or to such Holder, then and in every such case the Company, the Trustee and the Holders shall, subject to any determination in such proceeding, be restored severally and respectively to their former positions hereunder, and thereafter all rights and remedies of the Trustee and the Holders shall continue as though no such proceeding had been instituted. SECTION 7.10. Rights and Remedies Cumulative. Except as otherwise provided with respect to the replacement or payment of mutilated, lost, destroyed or stolen Secur-ities or coupons in the last paragraph of Section 3.06, no right or remedy herein conferred upon or reserved to the Trustee or to the Holders is intended to be exclusive of any other right or remedy, and every right and remedy shall, to the extent permitted by law, be cumulative and in addition to every other right and remedy given hereunder or now or hereafter existing at law or in equity or otherwise. The assertion or employment of any right or remedy hereunder, or otherwise, shall not prevent the concurrent assertion or employment of any other appropriate right or remedy. SECTION 7.11. Delay or Omission Not Waiver. No delay or omission of the Trustee or of any Holder of any Security or coupon to exercise any right or remedy accruing upon any Default shall impair any such right or remedy or constitute a waiver of any such Default or an acquiescence therein. Every right and remedy given by this Article or by law to the Trustee or to the Holders may be exercised from time to time, and as often as may be deemed expedient, by the Trustee or by the Holders, as the case may be. 39
SECTION 7.12. Control by Holders. The Holders of a majority in principal amount of the Outstanding Securities of any series shall have the right to direct the time, method and place of conducting any proceeding for any remedy available to the Trustee or exercising any trust or power conferred on the Trustee with respect to the Securities of such series; provided that (i) such direction shall not be in conflict with any rule of law or with this Indenture, (ii) the Trustee shall not determine that the action so directed would be unjustly prejudicial to the Holders not taking part in such direction, (iii) subject to the provisions of Section 8.01, the Trustee shall have the right to decline to follow any such direction if the Trustee in good faith shall, by a Responsible Officer or Officers of the Trustee, determine that the proceeding so directed would involve the Trustee in personal liability, and (iv) the Trustee may take any other action deemed proper by the Trustee which is not inconsistent with such direction. SECTION 7.13. Waiver of Past Defaults. The Holders of a majority in principal amount of the Outstanding Securities of any series may on behalf of the Holders of all the Securities of such series waive any past default hereunder and its consequences, except a default not theretofore cured (i) in the payment of the principal of, premium, if any, or interest on any Security of such series, or (ii) in respect of a covenant or provision hereof which under Article Nine cannot be modified or amended without the consent of the Holder of each Outstanding Security of such series affected. Upon any such waiver, such default shall cease to exist, and any Default or Event of Default arising therefrom shall be deemed to have been cured, for every purpose of the Securities of such series under this Indenture; but no such waiver shall extend to any subsequent or other default or impair any right consequent thereon. SECTION 7.14. Undertaking for Costs. All parties to this Indenture agree, and each Holder of any Security by his acceptance thereof shall be deemed to have agreed, that any court may in its discretion require, in any suit for the enforcement of any right or remedy under this Indenture, or in any suit against the Trustee for any action taken, suffered or omitted by it as Trustee, the filing by any party litigant in such suit of an undertaking to pay the costs of such suit, and that such court may in its discretion assess reasonable costs, including reasonable attorneys' fees, against any party litigant in such suit, having due regard to the merits and good faith of the claims or defenses made by such party litigant; but the provisions of this Section shall not apply to any suit instituted by the Company, to any suit instituted by the Trustee, to any suit instituted by any Holder, or group of Holders, holding in the aggregate more than 10% in principal amount of the Outstanding Securities of any series, or to any suit instituted by any Holder of Securities or coupons for the enforcement of the payment of the principal of, premium, if any, or interest on any Security or payment of any coupon on or after the respective Stated Maturities expressed in such Security or coupon (or, in the case of redemption or repayment, on or after the Redemption Date or Repayment Date). SECTION 7.15. Waiver of Stay or Extension Laws. The Company covenants (to the extent that it may lawfully do so) that it will not at any time insist upon, or plead, or in any manner whatsoever claim or take the benefit or advantage of, any stay or extension law wherever enacted, now or at any time hereafter in force, which may affect the covenants or the performance of this Indenture; and the Company (to the extent that it may lawfully do so) hereby expressly waives all benefit or advantage of any such law, and covenants that it will not hinder, delay or impede the execution of any power herein granted to the Trustee, but will suffer and permit the execution of every such power as though no such law had been enacted. ARTICLE EIGHT THE TRUSTEE SECTION 8.01. Certain Duties and Responsibilities. (i) Except during the continuance of a Default with respect to any series of Securities: (a) the Trustee undertakes to perform such duties and only such duties as are specifically set forth in this Indenture with respect to Securities of such series, and no implied covenants or obligations shall be read into this Indenture against the Trustee with respect to such series; and (b) in the absence of bad faith on its part, the Trustee may conclusively rely with respect to such series, as to the truth of the statements and the correctness of the opinions expressed therein, upon certificates or opinions furnished to the Trustee and conforming to the requirements of this Indenture; but in the case of any such certificate or opinions which by any provision hereof are specifically required to be furnished to the Trustee, the Trustee shall be under a duty to examine the same to determine whether or not they conform as to form to the requirements of the Indenture. 40
(ii) In case a Default with respect to any series of Securities has occurred and is continuing, the Trustee shall exercise such of the rights and powers vested in it by this Indenture with respect to such series, and use the same degree of care and skill in their exercise, as a prudent person would exercise or use under the circumstances in the conduct of his or her own affairs. (iii) No provision of this Indenture shall be construed to relieve the Trustee from liability for its own negligent action, its own negligent failure to act, or its own wilful misconduct, except that (a) this Subsection shall not be construed to limit the effect of Subsection (i) of this Section; (b) the Trustee shall not be liable for any error or judgment made in good faith by a Responsible Officer, unless it shall be proved that the Trustee was negligent in ascertaining the pertinent facts; (c) the Trustee shall not be liable with respect to any action taken, suffered or omitted to be taken by it in good faith in accordance with the direction of the Holders of a majority in principal amount of the Outstanding Securities of any series relating to the time, method and place of conducting any proceeding for any remedy available to the Trustee, or exercising any trust or power conferred upon the Trustee, under this Indenture with respect to Securities of such series; and (d) no provision of this Indenture shall require the Trustee to expend or risk its own funds or otherwise incur any financial liability in the performance of any of its duties hereunder, or in the exercise of any of its rights or powers, if it shall have reasonable grounds for believing that repayment of such funds or adequate indemnity against such risk or liability is not reasonably assured to it. (iv) Whether or not therein expressly so provided, every provision of this Indenture relating to the conduct or affecting the liability of or affording protection to the Trustee shall be subject to the provisions of this Section. SECTION 8.02. Notice of Default. Within 90 days after the occurrence of any default hereunder with respect to Securities of any series, the Trustee shall transmit by mail to all Holders of Securities of such series entitled to receive reports pursuant to Section 6.03(ii) notice of such default hereunder known to the Trustee, unless such default shall have been cured or waived; provided, however, that, except in the case of a default in the payment of the principal of, premium, if any, or interest on any Security of such series, or any related coupons or in the payment of any sinking fund installment with respect to Securities of such series the Trustee shall be protected in withholding such notice if and so long as the board of directors, the executive committee or a trust committee of directors and/or Responsible Officers of the Trustee in good faith determines that the withholding of such notice is in the interests of the Holders of Securities of such series; and provided further that in the case of any default of the character specified in Section 7.07(d) with respect to Securities of such series, no such notice to Holders of Securities of such series shall be given until at least 90 days after the occurrence thereof. For the purpose of this Section, the term "default", with respect to Securities of any series, means any event which is, or after notice or lapse of time, or both, would become, a Default or an Event of Default with respect to Securities of such series. SECTION 8.03. Certain Rights of Trustee. Except as otherwise provided in Section 8.01: (i) the Trustee may rely and shall be protected in acting or refraining from acting upon any resolution, certificate, statement, instrument, opinion, report, notice, request, direction, consent, order, bond, note or other paper or document believed by it to be genuine and to have been signed or presented by the proper party or parties; (ii) any request or direction of the Company mentioned herein shall be sufficiently evidenced by a Company Request or Company Order and any resolution of the Board of Directors may be sufficiently evidenced by a Board Resolution; (iii) whenever in the administration of this Indenture the Trustee shall deem it desirable that a matter be proved or established prior to taking, suffering or omitting any action hereunder, the Trustee (unless other evidence be herein specifically prescribed) may, in the absence of bad faith on its part, rely upon an Officers' Certificate; (iv) the Trustee may consult with counsel and the advice of such counsel or any Opinion of Counsel shall be full and complete authorization and protection in respect of any action taken, suffered or omitted by it hereunder in good faith and in reliance thereon; (v) the Trustee shall be under no obligation to exercise any of the rights or powers vested in it by this Indenture at the request or direction of any of the Holders pursuant to this Indenture, unless such Holders shall have offered to the Trustee reasonable security or indemnity against the costs, expenses and liabilities which might be incurred by it in compliance with such request or direction; (vi) the Trustee shall not be bound to make any investigation into the facts or matters stated in any resolution, certificate, statement, instrument, opinion, report, notice, request, direction, consent, order, bond, security or other paper or document, but the Trustee, in its discretion, may make further inquiry or investigation into such facts or matters as it may see fit, and, if the Trustee shall determine to make such further inquiry or investigation, it shall be entitled to examine the books, records and premises of the Company, personally or by agent or attorney and, if so requested to do so by any of the Holders, at the sole cost and expense of the Holders; 41
(vii) the Trustee may execute any of the trusts or powers hereunder or perform any duties hereunder either directly or by or through agents or attorneys and the Trustee shall not be responsible for any misconduct or negligence on the part of any agent or attorney appointed with due care by it hereunder; and (viii) in the event that the Trustee is also acting as Paying Agent, Authenticating Agent or Security Registrar hereunder, the rights and protections afforded to the Trustee pursuant to this Article Eight shall also be afforded to such Paying Agent, Authenticating Agent or Security Registrar. SECTION 8.04. Not Responsible for Recitals or Issuance of Securities. The recitals contained herein and in the Securities, except the Trustee's certificates of authentication, shall be taken as the statements of the Company, and neither the Trustee nor any Authenticating Agent assumes responsibility for their correctness. The Trustee makes no representations as to the validity or sufficiency of this Indenture or of the Securities. The Trustee shall not be accountable for the use or application by the Company of Securities or the proceeds thereof. SECTION 8.05. May Hold Securities. The Trustee, any Authenticating Agent, any Paying Agent, the Security Registrar or any other agent of the Company, in its individual or any other capacity, may become the owner or pledgee of Securities and, subject to Sections 8.08 and 8.13, may otherwise deal with the Company with the same rights it would have if it were not Trustee, Authenticating Agent, Paying Agent, Security Registrar or such other agent. SECTION 8.06. Money Held in Trust. Money held by the Trustee in trust hereunder need not be segregated from other funds except to the extent required by law. The Trustee shall be under no liability for interest on any money received by it hereunder except as otherwise agreed in writing with the Company. SECTION 8.07. Compensation and Reimbursement. The Company agrees (i) to pay to the Trustee from time to time reasonable compensation for all services rendered by it hereunder (which compensation shall not be limited by any provision of law in regard to the compensation of a trustee of an express trust); (ii) except as otherwise expressly provided herein, to reimburse the Trustee upon its request for all reasonable expenses, disbursements and advances incurred or made by the Trustee in accordance with any provision of this Indenture (including the reasonable compensation and the expenses and disbursements of its agents and counsel), except any such expense, disbursement or advance as may be attributable to its negligence or bad faith; and (iii) to indemnify the Trustee for, and to hold it harmless against, any loss, liability or expense incurred without negligence or bad faith on its part, arising out of or in connection with the acceptance or administration of this trust, including the costs and expenses of defending itself against any claim or liability in connection with the exercise or performance of any of its powers or duties hereunder. As security for the performance of the obligations of the Company under this Section the Trustee shall have a lien prior to the Securities upon all property and funds held or collected by the Trustee as such, except funds held in trust for the payment of principal of, premium, if any, or interest on particular Securities. When the Trustee incurs expenses or renders services in connection with an Event of Default specified in 7.01, the expenses (including the reasonable fees and expenses of its counsel) and the compensation for the services are intended to constitute expenses of administration under any applicable bankruptcy, insolvency or other similar law. The obligations of the Company set forth in this Section 8.07 and any lien arising hereunder shall survive the resignation or removal of any Trustee, the discharge of the Company's obligations pursuant to Article Eleven of this Indenture and the termination of this Indenture and the repayment of the Securities whether at the Stated Maturity or otherwise. SECTION 8.08. Disqualification; Conflicting Interests. If the Trustee has or shall acquire a conflicting interest within the meaning of Section 310 of the Trust Indenture Act, the Trustee shall either eliminate such conflicting interest or resign, to the extent and in the manner provided by, and subject to the provisions of, the Trust Indenture Act and this Indenture. To the extent permitted by the Trust Indenture Act, the Trustee shall not be deemed to have a conflicting interest with respect to the Securities of any series by virtue of being Trustee with respect to the Securities of any particular series of Securities other than that series. SECTION 8.09. Corporate Trustee Required; Eligibility. There shall at all times be a Trustee with respect to each series of Securities hereunder which shall be a corporation organized and doing business under the laws of the United States of America, any State thereof or the District of Columbia, authorized under such laws to exercise corporate trust powers, having a combined capital and surplus of at least $5,000,000, subject to supervision or examination by Federal or State authority; provided, however, that if Section 310( a) of the Trust Indenture Act or the rules and regulations of the Commission under the Trust Indenture Act at any time permit a corporation organized and doing business under the laws of any other jurisdiction to serve as trustee of an indenture qualified under the Trust 42
Indenture Act, this Section 8.09 shall be automatically deemed amended to permit a corporation organized and doing business under the laws of any such jurisdiction to serve as Trustee hereunder. If such corporation publishes reports of condition at least annually, pursuant to law or to the requirements of the aforesaid supervising or examining authority, then for the purposes of this Section, the combined capital and surplus of such corporation shall be deemed to be its combined capital and surplus as set forth in its most recent report of condition so published. Neither the Company nor any person directly or indirectly controlling, controlled by or under common control with the Company may serve as Trustee. If at any time the Trustee with respect to any series of Securities shall cease to be eligible in accordance with the provisions of this Section, it shall resign immediately in the manner and with the effect hereinafter specified in this Article. SECTION 8.10. Resignation and Removal; Appointment of Successor. (i) No resignation or removal of the Trustee and no appointment of a successor Trustee pursuant to this Article shall become effective until the acceptance of appointment by the successor Trustee under Section 8.11. (ii) The Trustee may resign with respect to any series of Securities at any time by giving written notice thereof to the Company. If an instrument of acceptance by a successor Trustee shall not have been delivered to the resigning Trustee within 30 days after the giving of such notice of resignation, the resigning Trustee may petition any court of competent jurisdiction for the appointment of a successor Trustee with respect to Securities of such series. (iii) The Trustee may be removed with respect to any series of Securities at any time by Act of the Holders of a majority in principal amount of the Outstanding Securities of such series, delivered to the Trustee and to the Company. (iv) If at any time: (a) the Trustee shall fail to comply with Section 8.08 with respect to any series of Securities after written request therefor by the Company or by any Holder who has been a bona fide Holder of a Security of such series for at least six months, or (b) the Trustee shall cease to be eligible under Section 8.09 with respect to any series of Securities and shall fail to resign after written request therefor by the Company or by any Holder of Securities of such series, or (c) the Trustee shall become incapable of acting with respect to any series of Securities or shall be adjudged a bankrupt or insolvent or a receiver of the Trustee or of its property shall be appointed or any public officer shall take charge or control of the Trustee or of its property or affairs for the purpose of rehabilitation, conservation or liquidation, then, in any such case, (1) the Company by a Board Resolution may remove the Trustee with respect to such series, or (2) subject to Section 7.14, any Holder who has been a bona fide Holder of a Security of such series for at least six months may, on behalf of himself and all others similarly situated, petition any court of competent jurisdiction for the removal of the Trustee and the appointment of a successor Trustee with respect to such series. (v) If the Trustee shall resign, be removed or become incapable of acting with respect to any series of Securities, or if a vacancy shall occur in the office of Trustee with respect to any series of Securities for any cause, the Company, by a Board Resolution, shall promptly appoint a successor Trustee or Trustees with respect to the Securities of that or those series (it being understood that any such successor Trustee may be appointed with respect to the Securities of one or more or all of such series and that at any time there shall be only one Trustee with respect to the Securities of any particular series) and shall comply with the applicable requirements of Section 8.11. If, within one year after such resignation, removal or incapability, or the occurrence of such vacancy, a successor Trustee with respect to such series of Securities shall be appointed by the Act of the Holders of a majority in principal amount of the Outstanding Securities of such series delivered to the Company and the retiring Trustee with respect to such series, the successor Trustee so appointed shall, forthwith upon its acceptance of such appointment, become the successor Trustee with respect to such series and to that extent supersede the successor Trustee appointed by the Company with respect to such series. If no successor Trustee with respect to such series shall have been so appointed by the Company or the Holders of Securities of such series and accepted appointment in the manner hereinafter provided, any Holder who has been A bona fide Holder of a Security of such series for at least six months may, on behalf of himself and all others similarly situated, petition any court of competent jurisdiction for the appointment of a successor Trustee with respect to such series. (vi) The Company shall give notice of each resignation and each removal of the Trustee with respect to the Securities of any series and each appointment of a successor Trustee with respect to the Securities of any series by mailing written notice of such event by first- class mail, postage prepaid, to the Holders of Registered Securities of such series as their names and addresses appear in the Security Register and, if Securities of such series are issuable as Bearer Securities, by publishing notice of such event once in an Authorized Newspaper in each Place of Payment located outside the United States. Each notice shall include the name of the successor Trustee with respect to the Securities of such series and the address of its Principal Corporate Trust Office. SECTION 8.11. Acceptance of Appointment by Successor. (i) In the case of the appointment hereunder of a successor Trustee with respect to any series of Securities, every such successor Trustee so appointed shall execute, acknowledge and deliver to the Company and to the retiring Trustee an instrument accepting such appointment, and thereupon the resignation or removal of the retiring Trustee shall become effective with respect to all or any series as to which it is resigning as Trustee, and such successor Trustee, without any 43
further act, deed or conveyance, shall become vested with all the rights, powers, trusts and duties of the retiring Trustee with respect to all or any such series; but, on request of the Company or such successor Trustee, such retiring Trustee shall upon payment of its charges, execute and deliver an instrument transferring to such successor Trustee all the rights, powers and trusts of such retiring Trustee with respect to all or any such series; and shall duly assign, transfer and deliver to such successor Trustee all property and money held by such retiring Trustee hereunder with respect to all or any such series. (ii) In case of the appointment hereunder of a successor Trustee with respect to the Securities of one or more (but not all) series, the Company, the retiring Trustee and each successor Trustee with respect to the Securities of one or more series shall execute and deliver an indenture supplemental hereto wherein each successor Trustee shall accept such appointment and which (a) shall contain such provisions as shall be necessary or desirable to transfer and confirm to, and to vest in, each successor Trustee all the rights, powers, trusts and duties of the retiring Trustee with respect to the Securities of that or those series to which the appointment of such successor Trustee relates, (b) if the retiring Trustee is not retiring with respect to all Securities, shall contain such provisions as shall be deemed necessary or desirable to confirm that all the rights, powers, trusts and duties of the retiring Trustee with respect to the Securities of that or those series as to which the retiring Trustee is not retiring shall continue to be vested in the retiring Trustee, and (c) shall add to or change any of the provisions of this Indenture as shall be necessary to provide for or facilitate the administration of the trusts hereunder by more than one Trustee, it being understood that nothing herein or in such supplemental indenture shall constitute such Trustees co-trustees of the same trust and that each such Trustee shall be Trustee of a trust or trusts hereunder separate and apart from any trust or trusts hereunder administered by any other such Trustee; and upon the execution and delivery of such supplemental indenture the resignation or removal of the retiring Trustee shall become effective to the extent provided therein and each such successor Trustee, without any further act, deed or conveyance, shall become vested with all the rights, powers, trusts and duties of the retiring Trustee with respect to the Securities of that or those series to which the appointment of such successor Trustee relates; but, on request of the Company or any successor Trustee, such retiring Trustee shall duly assign, transfer and deliver to such successor Trustee all property and money held by such retiring Trustee hereunder with respect to the Securities of that or those series to which the appointment of such successor Trustee relates, subject nevertheless to its lien, if any, provided for in Section 8.07. (iii) Upon request of any such successor Trustee, the Company shall execute any and all instruments for more fully and certainly vesting in and confirming to such successor Trustee all such rights, powers and trusts referred to in Paragraph (i) or (ii) of this Section, as the case may be. (iv) No successor Trustee with respect to a series of Securities shall accept its appointment unless at the time of such acceptance such successor Trustee shall be qualified and eligible with respect to such series under this Article. SECTION 8.12. Merger, Conversion, Consolidation or Succession to Business of Trustee. Any corporation into which the Trustee may be merged or converted or with which it may be consolidated, or any corporation resulting from any merger, conversion or consolidation to which the Trustee shall be a party, or any corporation succeeding to all or substantially all of the corporate trust business of the Trustee, shall be the successor of the Trustee hereunder, provided that such corporation shall be otherwise qualified and eligible under this Article, without the execution or filing of any paper or any further act on the part of any of the parties hereto. In case any Securities shall have been authenticated, but not delivered, by the Trustee then in office, any successor by merger, conversion or consolidation to such authenticating Trustee may adopt such authentication and deliver the Securities so authenticated with the same effect as if such successor Trustee had itself authenticated such Securities. SECTION 8.13. Preferential Collection of Claims against Company. If and when the Trustee shall be or become a creditor of the Company (or any other obligor upon the Securities), the Trustee shall be subject to the provisions of Section 311 of the Trust Indenture Act regarding the collection of such claims against the Company (or any such other obligor). A Trustee that has resigned or been removed shall be subject to and comply with said Section 311 to the extent required thereby. SECTION 8.14. Appointment of Authenticating Agents. The Trustee may appoint an Authenticating Agent or Agents, which may include any Affiliate of the Company, with respect to one or more series of Securities. Such Authenticating Agent or Agents at the option of the Trustee shall be authorized to act on behalf of the Trustee to authenticate Securities of such series issued upon original issuance, exchange, registration of transfer or partial redemption thereof or pursuant to Section 3.06, and Securities so authenticated shall be entitled to the benefits of this Indenture and shall be valid and obligatory for all purposes as if authenticated by the Trustee hereunder. Whenever reference is made in this Indenture to the authentication and delivery of Securities by the Trustee or the Trustee's certificate of authentication or the delivery of Securities to the Trustee for authentication, such reference shall be deemed to include authentication and delivery on behalf of the Trustee by an Authenticating Agent, a certificate of authentication executed on behalf of the Trustee by an Authenticating Agent and delivery of Securities to the Authenticating Agent on behalf of the Trustee. Each Authenticating Agent shall be acceptable to the Company and shall at all times be a corporation organized and doing business under the laws of the United States of America, any State thereof or the District of Columbia, authorized under such laws to act as Authen-ticating Agent, having a combined capital and surplus of not less than $5,000,000 and subject to supervision or examination by Federal or State authority. Notwithstanding the foregoing, an Authenticating Agent located outside the United States may be appointed by the Trustee if previously approved in writing by the Company and if such Authenticating Agent meets the minimum capitalization requirements of this Section 8.14. If such Authenticating Agent publishes reports of condition at least annually, pursuant to law or to the requirements of said supervising or examining authority, then for the purposes of this Section, the combined capital 44
and surplus of such Authenticating Agent shall be deemed to be its combined capital and surplus as set forth in its most recent report of condition so published. If at any time an Authenticating Agent shall cease to be eligible in accordance with the provisions of this Section, such Authenticating Agent shall resign immediately in the manner and with the effect specified in this Section. Any corporation into which an Authenticating Agent may be merged or converted or with which it may be consolidated, or any corporation resulting from any merger, conversion or consolidation to which such Authenticating Agent shall be a party, or any corporation succeeding to the corporate agency or corporate trust business of an Authenticating Agent, shall continue to be an Authenticating Agent, provided such corporation shall be otherwise eligible under this Section, without the execution or filing of any paper or any further act on the part of the Trustee or the Authenticating Agent. An Authenticating Agent may resign at any time by giving written notice thereof to the Trustee and to the Company. The Trustee may at any time (and upon request by the Company shall) terminate the agency of an Authenticating Agent by giving written notice thereof to such Authenticating Agent and to the Company. Upon receiving such a notice of resignation or upon such termination, or in case at any time such Authenticating Agent shall cease to be eligible in accordance with the provisions of this Section, the Trustee may appoint a successor Authenticating Agent which shall be acceptable to the Company. Any successor Authenticating Agent upon acceptance of its appointment hereunder shall become vested with all the rights, powers and duties of its predecessor hereunder, with like effect as if originally named as an Authenticating Agent. No successor Authenticating Agent shall be appointed unless eligible under the provisions of this Section. If an appointment with respect to one or more series is made pursuant to this Section, the Securities of such series may have endorsed thereon, in addition to the Trustee's certificate of authentication, an alternate certificate of authentication in the following form: This is one of the Securities of the series designated therein referred to in the within-mentioned Indenture. CITIBANK, N.A., as Trustee, by AS AUTHENTICATING AGENT by AUTHORIZED OFFICER ARTICLE NINE SUPPLEMENTAL INDENTURES SECTION 9.01. Supplemental Indentures Without Consent of Holders. Without the consent of any Holder of any Securities or coupons, the Company, when authorized by a Board Resolution, and the Trustee, at any time and from time to time, may enter into one or more indentures supplemental hereto, in form satisfactory to the Trustee, for any of the following purposes: (i) to evidence the succession of another corporation or Person to the Company, and the assumption by any such successor of the covenants of the Company herein and in the Securities contained; or (ii) to evidence and provide for the acceptance of appointment by another corporation as a successor Trustee hereunder with respect to one or more series of Securities and to add to or change any of the provisions of this Indenture as shall be necessary to provide for or facilitate the administration of the trusts hereunder by more than one Trustee, pursuant to Section 8.11; or (iii) to add to the covenants of the Company, for the benefit of the Holders of Securities of all or any series of Securities or coupons (and if such covenants are to be for the benefit of less than all series of Securities or coupons, stating that such covenants are expressly being included solely for the benefit of such series), or to surrender any right or power herein conferred upon the Company; or (iv) to cure any ambiguity, to correct or supplement any provision herein which may be inconsistent with any other provision herein, or to make any other provisions with respect to matters or questions arising under the Indenture; provided that such action shall not adversely affect the interests of the Holders of Securities of any series or any related coupons in any material respect, or (v) to add any additional Defaults or Events of Default with respect to all or any series of the Securities (and, if such Default or Event of Default is applicable to less than all series of Securities, specifying the series to which such Default or Event of Default is applicable); or (vi) to add to, change or eliminate any of the provisions of this Indenture to provide that Bearer Securities may be registrable as to principal, to change or eliminate any restrictions on the payment of principal of (or premium, if any) or any interest on Bearer Securities, to permit Bearer Securities to be issued in exchange for Registered Securities, to permit Bearer Securities to be issued in 45
exchange for Bearer Securities of other authorized denominations or to permit or facilitate the issuance of Securities in uncertificated form; provided any such action shall not adversely affect the interests of the Holders of Securities of any series or any related coupons in any material respect; or (vii) to add to, change or eliminate any of the provisions of this Indenture, provided that any such addition, change or elimination (a) shall become effective only when there is no Security Outstanding of any series created prior to the execution of such supplemental indenture which is adversely affected by such change in or elimination of such provision or (b) shall not apply to any Securities Outstanding; or (viii) to establish the form or terms of Securities of any series as permitted by Sections 2.01 and 3.01, or (ix) to add to or change any provisions of this Indenture to such extent as shall be necessary to permit or facilitate the issuance of Securities convertible into other securities; or (x) to evidence any changes to Section 8.09 as permitted by the terms thereof; or (xi) to add to or change or eliminate any provision of this Indenture as shall be necessary or desirable in accordance with any amendments to the Trust Indenture Act, provided such action shall not adversely affect the interest of Holders of Securities of any series or any appurtenant coupons in any material respect. SECTION 9.02. Supplemental Indentures With Consent of Holders. With the consent of the Holders of not less than a majority in aggregate principal amount of the Outstanding Securities of all series affected by such supplemental indenture or indentures (acting as one class), by Act of said Holders delivered to the Company and the Trustee, the Company, when authorized by a Board Resolution, and the Trustee may enter into an indenture or indentures supplemental hereto for the purpose of adding any provisions to or changing in any manner or eliminating any of the provisions of this Indenture or of modifying in any manner the rights of the Holders of Securities of each such series and any related coupons under this Indenture; provided, however, that no such supplemental indenture shall, without the consent of the Holder of each Outstanding Security affected thereby; (i) change the Maturity of the principal of, or the Stated Maturity of any installment of interest (or premium, if any) on, any Security, or reduce the principal amount thereof or any premium thereon or the rate of interest thereon, or change the obligation of the Company to pay additional amounts pursuant to Section 5.04 (except as contemplated by Section 10.01(i) and permitted by Section 9.01), or reduce the amount of the principal of an Original Issue Discount Security that would be due and payable upon a declaration of acceleration of the Maturity thereof pursuant to Section 7.02, or change the method of calculating interest thereon or the coin or currency in which any Security (or premium, if any, thereon) or the interest thereon is payable, or reduce the minimum rate of interest thereon, or impair the right to institute suit for the enforcement of any such payment on or after the Stated Maturity thereof (or, in the case of redemption or repayment, on or after the Redemption Date or Repayment Date); (ii) reduce the percentage in principal amount of the Outstanding Securities of any series, the consent of whose Holders is required for any such supplemental indenture or the consent of whose Holders is required for any waiver (of compliance with certain provisions of this Indenture or of certain defaults hereunder and their consequences) provided for in this Indenture or reduce the requirements of Section 16.04 for a quorum; (iii) change any obligation of the Company to maintain an office or agency in the places and for the purposes specified in Section 5.02; or (iv) modify any of the provisions of this Section or Section 7.13, except to increase any such percentage or to provide that certain other provisions of this Indenture cannot be modified or waived. A supplemental indenture which changes or eliminates any covenant or other provision of this Indenture which has expressly been included solely for the benefit of one or more particular series of Securities, or which modifies the rights of the Holders of Securities of such series with respect to such covenant or other provision, shall be deemed not to affect the rights under this Indenture of the Holders of Securities of any other series. It shall not be necessary for any Act of Holders under this Section to approve the particular form of any proposed supplemental indenture, but it shall be sufficient if such Act shall approve the substance thereof. SECTION 9.03. Execution of Supplemental Indentures. In executing, or accepting the additional trusts created by, any supplemental indenture permitted by this Article or the modifications thereby of the trusts created by this Indenture, the Trustee shall be entitled to receive, and (subject to Section 8.01) shall be fully protected in relying upon, an Opinion of Counsel stating that the execution of such supplemental indenture is authorized or permitted by and complies with this Indenture. The Trustee may, but shall not be obligated to, enter into any such supplemental indenture which affects the Trustee's own rights, liabilities, duties or immunities under this Indenture or otherwise. 46
SECTION 9.04. Effect of Supplemental Indentures. Upon the execution of any supplemental indenture under this Article, this Indenture shall be modified in accordance therewith, and such supplemental indenture shall form a part of this Indenture for all purposes; and every Holder of Securities theretofore or thereafter authenticated and delivered hereunder shall be bound thereby. SECTION 9.05. Conformity with Trust Indenture Act. Every supplemental indenture executed pursuant to this Article shall conform to the requirements of the TIA as then in effect. SECTION 9.06. Reference in Securities to Supplemental Indentures. Securities authenticated and delivered after the execution of any supplemental indenture pursuant to this Article may, and shall, if required by the Trustee, bear a notation in form approved by the Trustee as to any matter provided for in such supplemental indenture. If the Company shall so determine, new Securities so modified as to conform, in the opinion of the Trustee and the Company, to any such supplemental indenture may be prepared and executed by the Company and authenticated and delivered by the Trustee in exchange for Outstanding Securities. SECTION 9.07. Subordination Unimpaired. No supplemental indenture executed pursuant to this Article shall directly or indirectly modify the provisions of Article Fourteen in any manner which might alter the subordination of the Securities. ARTICLE TEN CONSOLIDATION, MERGER, CONVEYANCE OR TRANSFER SECTION 10.01. Company May Consolidate, etc., Only on Certain Terms. The Company shall not consolidate with or merge into any other corporation or convey or transfer its properties and assets substantially as an entirety to any Person, unless (i) the Person formed by such consolidation or into which the Company is merged or the Person which acquires by conveyance or transfer the properties and assets of the Company substantially as an entirety shall expressly assume, by an indenture supplemental hereto, executed and delivered to the Trustee, in form satisfactory to the Trustee, the due and punctual payment of the principal of, premium, if any, and interest (including all additional amounts, if any, payable pursuant to Section 5.04) on all the Securities and the performance of every covenant of this Indenture on the part of the Company to be performed or observed; (ii) immediately after giving effect to such transaction, no Default, and no event which, after notice or lapse of time, or both, would become a Default, shall have happened and be continuing; and (iii) the Company has delivered to the Trustee an Officers' Certificate and an Opinion of Counsel each stating that such consolidation, merger, conveyance or transfer and such supplemental indenture comply with this Article and that all conditions precedent herein provided for relating to such transaction have been complied with. SECTION 10.02. Successor Corporation Substituted. Upon any consolidation or merger, or any conveyance or transfer of the properties and assets of the Company substantially as an entirety in accordance with Section 10.01, the successor Person formed by such consolidation or into which the Company is merged or to which such conveyance or transfer is made shall succeed to, and be substituted for, and may exercise every right and power of, the Company under this Indenture with the same effect as if such successor Person had been named as the Company herein. In the event of any such conveyance or transfer, the Company as the predecessor corporation shall be relieved of all obligations and covenants under this Indenture and may be dissolved, wound up and liquidated at any time thereafter. ARTICLE ELEVEN SATISFACTION AND DISCHARGE SECTION 11.01. Satisfaction and Discharge of Indenture. This Indenture shall cease to be of further effect (except as to any surviving rights of registration of transfer or exchange of Securities herein expressly provided for and rights to receive payments thereon and any right to receive additional amounts, as provided in Section 5.04), and the Trustee, on receipt of a Company Request and at the expense of the Company, shall execute proper instruments acknowledging satisfaction and discharge of this Indenture, when (i) either (a) all Securities theretofore authenticated and delivered (other than (1) coupons appertaining to Bearer Securities surrendered for exchange for Registered Securities and maturing after such exchange, whose surrender is not required or has not been waived as provided in Section 3.05, (2) coupons appertaining to Bearer Securities called for redemption and maturing after the relevant Redemption Date, whose surrender has been waived as provided in Section 4.07, (3) Securities and coupons which have been destroyed, lost or stolen and which have been replaced or paid as provided in Section 3.06, and (4) Securities for whose payment money has theretofore been 47
deposited in trust or segregated and held in trust by the Company and thereafter repaid to the Company or discharged from such trust, as provided in Section 5.03) have been delivered to the Trustee for cancelation; or (b) all such Securities not theretofore delivered to the Trustee for cancelation (1) have become due and payable, or (2) will become due and payable at their Maturity within one year, or (3) are to be called for redemption within one year under arrangements satisfactory to the Trustee for the giving of notice of redemption by the Trustee in the name, and at the expense, of the Company, and the Company, in the case of (b) (1), (2) or (3) above, has deposited or caused to be deposited with the Trustee, as trust funds in trust for the purpose, an amount (said amount to be immediately due and payable to the Holders) sufficient to pay and discharge the entire indebtedness on such Securities and coupons not theretofore delivered to the Trustee for cancelation, for principal, premium, if any, and interest to the date of such deposit (in the case of Securities which have become due and payable), or to the Maturity or Redemption Date, as the case may be; (ii) the Company has paid or caused to be paid all other sums payable hereunder by the Company; and (iii) the Company has delivered to the Trustee an Officers' Certificate and an Opinion of Counsel each stating that all conditions precedent herein provided for relating to the satisfaction and discharge of this Indenture have been complied with. Notwithstanding the satisfaction and discharge of this Indenture, the obligations of the Company to the Trustee under Section 8.07 and, if money shall have been deposited with the Trustee pursuant to subclause (b) of clause (i) of this Section, the obligations of the Trustee under Section 11.02 and the last paragraph of Section 5.03 shall survive. The Trustee may give notice at the Company's expense to the Holders of Securities Outstanding of the immediate availability of the amount referred to in clause (i) of this Section 11.01. Funds held pursuant to this Section shall not be subject to the provisions of Article Fourteen. SECTION 11.02. Application of Trust Money. Subject to the provisions of the last paragraph of Section 5.03, all money deposited with the Trustee pursuant to Section 11.01 shall be held in trust and applied by it, in accordance with the provisions of the Securities, the coupons, if any, and this Indenture, to the payment, either directly or through any Paying Agent (including the Company acting as its own Paying Agent), as the Trustee may determine, to the Persons entitled thereto, of the principal, premium, if any, and interest for whose payment such money has been deposited with the Trustee; but such money need not be segregated from other funds except to the extent required by law. SECTION 11.03. Reinstatement. If the Trustee or any Paying Agent is unable to apply any money in accordance with Section 11.02 by reason of any legal proceeding or by reason of any order or judgment of any court or governmental authority enjoining, restraining or otherwise prohibiting such application, the Company's obligations under this Indenture and the Securities shall be revived and reinstated as though no deposit had occurred pursuant to Section 11.01 until such time as the Trustee or any Paying Agent is permitted to apply all such money in accordance with Section 11.02. ARTICLE TWELVE Immunity of Incorporators, Stockholders, OFFICERS AND DIRECTORS SECTION 12.01. Exemption from Individual Liability. No recourse under or upon any obligation, covenant or agreement of this Indenture, or of any Security or coupon, or for any claim based thereon or otherwise in respect thereof, shall be had against any incorporator, stockholder, officer or director, as such, past, present or future, of the Company or of any successor corporation, either directly or through the Company, whether by virtue of any constitution, statute or rule of law, or by the enforcement of any assessment or penalty or otherwise; it being expressly understood that this Indenture and the obligations issued hereunder are solely corporate obligations of the Company, and that no such personal liability whatever shall attach to, or is or shall be incurred by, the incorporators, stockholders, officers or directors, as such, of the Company or of any successor corporation, or any of them, because of the creation of the indebtedness hereby authorized, or under or by reason of the obligations, covenants or agreements contained in this Indenture or in any of the Securities or coupons or implied therefrom; and that any and all such personal liability, either at common law or in equity or by constitution or statute, of, and any and all such rights and claims against, every such incorporator, stockholder, officer or director, as such, because of the creation of the indebtedness hereby authorized, or under or by reason of the obligations, covenants or agreements contained in this Indenture or in any of the Securities or coupons or implied therefrom, are hereby expressly waived and released as a condition of, and as a consideration for, the execution of this Indenture and the issuance of the Securities. 48
ARTICLE THIRTEEN SINKING FUNDS SECTION 13.01. Applicability of Article. The provisions of this Article shall be applicable to any sinking fund for the retirement of Securities of a series except as otherwise specified as contemplated by Section 3.01 for Securities of such series. The minimum amount of any sinking fund payment provided for by the terms of Securities of any series is herein referred to as a "mandatory sinking fund payment", and any payment in excess of such minimum amount provided for by the terms of Securities of any series is herein referred to as an "optional sinking fund payment". If provided for by the terms of Securities of any series, the cash amount of any sinking fund payment may be subject to reduction as provided in Section 13.02. Each sinking fund payment shall be applied to the redemption of Securities of any series as provided for by the terms of Securities of such series. SECTION 13.02. Satisfaction of Sinking Fund Payments with Securities. The Company (i) may deliver Outstanding Securities of a series (other than any previously called for redemption), together in the case of any Bearer Securities of such series with all unmatured coupons appertaining thereto and (ii) may apply as a credit Securities of a series which have been redeemed either at the election of the Company pursuant to the terms of such Securities or through the application of permitted optional sinking fund payments pursuant to the terms of such Securities, in each case in satisfaction of all or any part of any sinking fund payment with respect to the Securities of such series required to be made pursuant to the terms of such Securities as provided for by the terms of such series; provided that such Securities have not been previously so credited. Such Securities shall be received and credited for such purpose by the Trustee at the Redemption Price specified in such Securities for redemption through operation of the sinking fund and the amount of such sinking fund payment shall be reduced accordingly. SECTION 13.03. Redemption of Securities for Sinking Fund. Not less than 60 days prior to each sinking fund payment date for any series of Securities, the Company will deliver to the Trustee and the Security Registrar an Officers' Certificate specifying (i) the amount of the next ensuing sinking fund payment for that series pursuant to the terms of that series, (ii) the portion thereof, if any, which is to be satisfied by payment of cash and the portion thereof, if any, which is to be satisfied by delivering and crediting Securities of that series pursuant to Section 13.02, and (iii) that none of such Securities has theretofore been so credited and stating the basis for such credit, and will also deliver to the Trustee any Securities to be so delivered. Not less than 30 days before each sinking fund payment date the Security Registrar shall select the Securities to be redeemed upon such sinking fund payment date in the manner specified in Section 4.03 and cause notice of the redemption thereof to be given in the name of and at the expense of the Company in the manner provided in Section 4.04. Such notice having been duly given, the redemption of such Securities shall be made upon the terms and in the manner stated in Sections 4.06 and 4.07. ARTICLE FOURTEEN SUBORDINATION OF SECURITIES SECTION 14.01. Agreement To Subordinate. The Company, for itself, its successors and assigns, covenants and agrees, and each Holder of a Security by his acceptance thereof, likewise covenants and agrees, that the payment of the principal and premium, if any, and interest on each and all of the Securities is hereby expressly subordinated, to the extent and in the manner hereinafter set forth, in right of payment to the prior payment in full of all Senior Indebtedness and, subject to the provisions of Section 14.09, General Obligations of the Company. SECTION 14.02. Distribution on Dissolution, Liquidation and Reorganization; Subrogation of Securities. Upon any distribution of assets of the Company upon any dissolution, winding up, liquidation or reorganization of the Company, whether in bankruptcy, insolvency, reorganization or receivership proceedings or upon an assignment for the benefit of creditors or any other marshalling of the assets and liabilities of the Company or otherwise (subject to the power of a court of competent jurisdiction to make other equitable provision reflecting the rights conferred in this Indenture upon the Senior Indebtedness and the holders thereof with respect to the Securities and the Holders thereof (and, upon the General Obligations and the creditors in respect thereof with respect to the Securities and the Holders thereof) by a lawful plan of reorganization under applicable bankruptcy law); (i) the holders of all Senior Indebtedness shall first be entitled to receive payment in full in accordance with the terms of such Senior Indebtedness of the principal thereof, premium, if any, and the interest due thereon (including interest accruing subsequent to the commencement of any proceeding for the bankruptcy or reorganization of the Company under any applicable bankruptcy, insolvency, or similar law now or hereafter in effect) before the Holders of the Securities are entitled to receive any payment upon the principal of or premium, if any, or interest on indebtedness evidenced by the Securities; (ii) any payment or distribution of assets of the Company of any kind or character, whether in cash, property or securities, to which the Holders of the Securities or the Trustee would be entitled except for the provisions of this Article Fourteen, including any such payment or distribution which may be payable or deliverable by reason of the payment of any other indebtedness of the Company being subordinated to the payment of the Securities, shall be paid by the liquidating trustee or agent or other person making such 49
payment or distribution, whether a trustee in bankruptcy, a receiver or liquidating trustee or otherwise, directly to the holders of Senior Indebtedness or their representative or representatives or to the trustee or trustees under any indenture under which any instruments evidencing any of such Senior Indebtedness may have been issued, in accordance with the priorities then existing among holders of Senior Indebtedness for payment of the aggregate amounts remaining unpaid on account of the principal of and premium, if any, and interest (including interest accruing subsequent to the commencement of any proceeding for the bankruptcy or reorganization of the Company under any applicable bankruptcy, insolvency or similar law now or hereafter in effect) on the Senior Indebtedness held or represented by each, to the extent necessary to make payment in full of all Senior Indebtedness remaining unpaid, after giving effect to any concurrent payment or distribution to the holders of such Senior Indebtedness; it being understood that if the Holders of Securities shall fail to file a proper claim in the form required by any proceeding referred to in this subparagraph (ii) prior to 30 days before the expiration of the time to file such claim or claims, then the holders of Senior Indebtedness are hereby authorized to file an appropriate claim or claims for and on behalf of the Holders of Securities in the form required in any such proceeding (as are the creditors in respect of General Obligations in the event Section 14.09 is applicable); and (iii) in the event that, notwithstanding the foregoing, any payment or distribution of assets of the Company of any kind or character, whether in cash, property or securities, including any such payment or distribution which may be payable or deliverable by reason of the payment of any other indebtedness of the Company being subordinate to the payment of the Securities, shall be received by the Trustee or Holders of the Securities before all Senior Indebtedness is paid in full, such payment or distribution shall be held in trust for the benefit of and shall be paid over to the holders of such Senior Indebtedness or their representative or representatives or to the trustee or trustees under any indenture under which any instruments evidencing any of such Senior Indebtedness may have been issued, ratably as aforesaid, for application to the payment of all Senior Indebtedness remaining unpaid until all such Senior Indebtedness shall have been paid in full, after giving effect to any concurrent payment or distribution to the holders of such Senior Indebtedness. Subject to the payment in full of all Senior Indebtedness, the Holders of the Securities shall be subrogated (equally and ratably with the holders of all indebtedness of the Company which by its express terms is subordinated to indebtedness of the Company to substantially the same extent as the Securities are subordinated and is entitled to like rights of subrogation) to the rights of the holders of Senior Indebtedness to receive payments or distributions of cash, property or securities of the Company applicable to the Senior Indebtedness until the principal of and premium, if any, and interest on the Securities shall be paid in full and no such payments or distributions to holders of such Senior Indebtedness to which the Holders of the Securities would be entitled except for the provisions hereof of cash, property or securities otherwise distributable to the Senior Indebtedness shall, as between the Company, its creditors, other than the holders of Senior Indebtedness and the Holders of the Securities, be deemed to be a payment by the Company to or on account of the Securities. It is understood that the provisions of this Article Fourteen are and are intended solely for the purpose of defining the relative rights of the Holders of the Securities, on the one hand, and the holders of Senior Indebtedness (and, in the case of Section 14.09, the Holders of the Securities, on the one hand, and creditors in respect of General Obligations) on the other hand. Nothing contained in this Article Fourteen or elsewhere in this Indenture or in the Securities is intended to or shall impair, as between the Company, its creditors, other than the holders of Senior Indebtedness, and the Holders of the Securities, the obligation of the Company, which is unconditional and absolute (and which, subject to the rights under this Article Fourteen of the holders of the Senior Indebtedness and the rights under Section 14.09 of creditors in respect of General Obligations, is intended to rank equally with all other general obligations of the Company), to pay to the Holders of the Securities the principal of, premium, if any, and interest on the Securities as and when the same shall become due and payable in accordance with their terms or to affect the relative rights of the Holders of the Securities and creditors of the Company, other than the holders of the Senior Indebtedness and creditors in respect of General Obligations, nor shall anything herein or in the Securities prevent the Trustee or the Holder of any Security from exercising all remedies otherwise permitted by applicable law upon Default under this Indenture, subject to the rights, if any, under this Article Fourteen of the holders of Senior Indebtedness and under Section 14.09 of creditors in respect of General Obligations in respect of cash, property or securities of the Company received upon the exercise of any such remedy. Upon any payment or distribution of assets of the Company referred to in this Article Fourteen, the Trustee, subject to the provisions of Section 8.01, and the Holders of the Securities shall be entitled to rely upon any order or decree of a court of competent jurisdiction in which such dissolution, winding up, liquidation or reorganization proceedings are pending or upon a certificate of the liquidating trustee or agent or other person making any distribution to the Trustee or to the Holders of the Securities for the purpose of ascertaining the persons entitled to participate in such distribution, the holders of the Senior Indebtedness and other indebtedness of the Company and the creditors in respect of General Obligations, the amount thereof or payable thereon, the amount or amounts paid or distributed thereon and all other facts pertinent thereto or to this Article Fourteen. In the absence of any such liquidating trustee, agent or other person, the Trustee shall be entitled to rely upon a written notice by a Person representing himself to be a holder of Senior Indebtedness (or a trustee or representative on behalf of such holder) or a creditor in respect of General Obligations as evidence that such Person is a holder of Senior Indebtedness (or is such a trustee or representative) or a creditor in respect of General Obligations, as the case may be. In the event that the Trustee determines, in good faith, that further evidence is required with respect to the right of any Person, as a holder of Senior Indebtedness or a creditor in respect of General Obligations, to participate in any payment or distribution pursuant to this Section or Section 14.09, the Trustee may request such Person to furnish evidence to the reasonable satisfaction of the Trustee as to the amount of Senior Indebtedness or General Obligations held by such Person, as to the extent to which such Person is entitled to participation in such payment or distribution, and as to other facts pertinent to the rights of such Person under this Section or Section 14.09, and if such evidence is not 50
furnished, the Trustee may defer any payment to such Person pending judicial determination as to the right of such Person to receive such payment. The obligations of the Company in respect of the Securities shall rank on a parity with the Existing Subordinated Indebtedness and any other obligations of the Company ranking on a parity with the Securities. With respect to the holders of Senior Indebtedness or creditors in respect of General Obligations, the Trustee undertakes to perform or to observe only such of its covenants and obligations as are specifically set forth in this Article, and no implied covenants or obligations with respect to the holders of Senior Indebtedness or creditors in respect of General Obligations shall be read into this Indenture against the Trustee. The Trustee, however, shall not be deemed to owe any fiduciary duty to the holders of Senior Indebtedness or creditors in respect of General Obligations, and shall not be liable to any such holders or creditors if it shall mistakenly pay over or distribute to or on behalf of Holders of Securities or the Company moneys or assets to which any holders of Senior Indebtedness or creditors in respect of General Obligations shall be entitled by virtue of this Article Fourteen. SECTION 14.03. Payments on Securities Prohibited During Event of Default under Senior Indebtedness. In the event and during the continuation of any default in the payment of principal of, or premium, if any, or interest on, any Senior Indebtedness beyond any applicable period of grace, or in the event that any event of default with respect to any Senior Indebtedness shall have occurred and be continuing, or would occur as a result of the payment referred to hereinafter, permitting the holders of such Senior Indebtedness (or a trustee on behalf of the holders thereof) to accelerate the maturity thereof, then, unless and until such default or event of default shall have been cured or waived or shall have ceased to exist, no payment of principal of, or premium or interest on the Securities, or in respect of any redemption, retirement, purchase or other acquisition of any of the Securities, shall be made by the Company. SECTION 14.04. Payments on Securities Permitted. Nothing contained in this Indenture or in any of the Securities shall (i) impair, as between the Company and Holders of Securities, the obligation of the Company to make, or prevent the Company from making, at any time except as provided in Sections 14.02, 14.03, 14.08 and 14.09, payments of principal of or premium, if any, or interest (including interest accruing subsequent to the commencement of any proceeding for the bankruptcy or reorganization of the Company under any applicable bankruptcy, insolvency or similar law now or hereafter in effect) on the Securities, as and when the same shall become due and payable in accordance with the terms of the Securities, (ii) affect the relative rights of the Holders of the Securities and creditors of the Company other than the holders of the Senior Indebtedness of the Company and the creditors in respect of General Obligations, (iii) prevent the Trustee or the Holder of any Security from exercising all remedies otherwise permitted by applicable law upon default thereunder, subject to the rights, if any, under Article Fourteen of the holders of Senior Indebtedness and the creditors in respect of General Obligations in respect of cash, property or securities of the Company received upon the exercise of such remedy, or (iv) prevent the application by the Trustee or any Paying Agent of any moneys deposited with it hereunder to the payment of or on account of the principal of or premium, if any, or interest on the Securities or prevent the receipt by the Trustee or any Paying Agent of such moneys, if, prior to the second Business Day prior to such deposit, the Trustee or such Paying Agent did not have written notice of any event prohibiting the making of such deposit by the Company. SECTION 14.05. Authorization of Holders to Trustee To Effect Subordination. Each Holder of a Security by his acceptance thereof authorizes and directs the Trustee in his behalf to take such action as may be necessary or appropriate to effectuate the subordination as provided in this Article Fourteen and appoints the Trustee his attorney-in-fact for any and all such purposes. SECTION 14.06. Notice to Trustee. Notwithstanding the provisions of this Article or any other provisions of this Indenture, neither the Trustee nor any Paying Agent shall be charged with knowledge of the existence of any Senior Indebtedness or General Obligations or of any event which would prohibit the making of any payment of moneys to or by the Trustee or such Paying Agent, unless and until the Trustee or such Paying Agent shall have received written notice thereof from the Company or from the holder of any Senior Indebtedness or from the representative of any such holder or from any creditor in respect of General Obligations. SECTION 14.07. Right of Trustee To Hold Senior Indebtedness or General Obligations. The Trustee shall be entitled to all of the rights set forth in this Article in respect of any Senior Indebtedness or General Obligation at any time held by it in its individual capacity to the same extent as any other holder of such Senior Indebtedness or creditor in respect of such General Obligation and nothing in this Indenture shall be construed to deprive the Trustee of any of its rights as such holder or creditor. SECTION 14.08. Article Fourteen Not To Prevent Defaults or Events of Default. The failure to make a payment pursuant to the Securities by reason of any provision in this Article shall not be construed as preventing the occurrence of a Default or an Event of Default. SECTION 14.09. Securities To Rank Pari Passu with Existing SUBORDINATED INDEBTEDNESS; PAYMENT OF PROCEEDS IN CERTAIN CASES. (i) SUBJECT TO the provisions of this Section and to any provisions established or determined with respect to Securities of any series pursuant to Section 3.01, the Securities shall rank pari passu in right of payment with the Existing Subordinated Indebtedness. (ii) Upon the occurrence of any of the events specified in the first paragraph of Section 14.02, the provisions of that Section and the corresponding provisions of each indenture or other instrument or document establishing or governing the terms of any Existing 51
Subordinated Indebtedness shall be given effect on a pro rata basis to determine the amount of cash, property or securities which may be payable or deliverable as between the holders of Senior Indebtedness, on the one hand, and the Holders of the Securities and holders of Existing Subordinated Indebtedness, on the other hand. (iii) If, after giving effect to the provisions of Section 14.02, and the respective corresponding provisions of each indenture or other instrument or document establishing or governing the terms of any Existing Subordinated Indebtedness on such pro rata basis, any amount of cash, property or securities shall be available for payment or distribution in respect of the Securities ("Excess Proceeds"), and any creditors in respect of General Obligations shall not have received payment in full of all amounts due or to become due on or in respect of such General Obligations (and provision shall not have been made for such payment in money or money's worth), then such Excess Proceeds shall first be applied (ratably with any amount of cash, property or securities available for payment or distribution in respect of any other indebtedness of the Company that by its express terms provides for the payment over of amounts corresponding to Excess Proceeds to creditors in respect of General Obligations) to pay or provide for the payment of the General Obligations remaining unpaid, to the extent necessary to pay all General Obligations in full, after giving effect to any concurrent payment or distribution to or for creditors in respect of General Obligations. Any Excess Proceeds remaining after payment (or provision for payment) in full of all General Obligations shall be available for payment or distribution in respect of the Securities. (iv) In the event that, notwithstanding the foregoing provisions of subsection (iii) of this Section, the Trustee or Holder of any Security shall, in the circumstances contemplated by such subsection, have received any payment or distribution of assets of the Company of any kind or character, whether in cash, property or securities, before all General Obligations are paid in full or payment thereof duly provided for, and if such fact shall, at or prior to the time of such payment or distribution have been made known to the Trustee or, as the case may be, such Holder, then and in such event, subject to any obligation that the Trustee or such Holder may have pursuant to Section 14.02, such payment or distribution shall be paid over or delivered forthwith to the trustee in bankruptcy, receiver, liquidating trustee, custodian, assignee, agent or other Person making payment or distribution of assets of the Company for payment in accordance with subsection (iii). (v) Subject to the payment in full of all General Obligations, the Holder of the Securities shall be subrogated (equally and ratably with the holders of all indebtedness of the Company that by its express terms provides for the payment over of amounts corresponding to Excess Proceeds to creditors in respect of General Obligations and is entitled to like rights of subrogation) to the rights of the creditors in respect of General Obligations to receive payments or distributions of cash, property or securities applicable to the General Obligations until the principal of and interest on the Securities shall be paid in full. For purposes of such subrogation, no payments or distributions to creditors in respect of General Obligations of any cash, property or securities to which Holders of the Securities or the Trustee would be entitled except for the provisions of this Section, and no payments over pursuant to the provisions of this Section to creditors in respect of General Obligations by Holders of Securities or the Trustee, shall, as among the Company, its creditors (other than creditors in respect of General Obligations) and the Holders of Securities be deemed to be a payment or distribution by the Company to or on account of the Securities. (vi) The provisions of subsections (iii), (iv) and (v) of this Section are and are intended solely for the purpose of defining the relative rights of the Holders of the Securities, on the one hand, and the creditors in respect of General Obligations, on the other hand, after giving effect to the rights of the holders of Senior Indebtedness, as provided in this Article. Nothing contained in subsections (iii), (iv) and (v) of this Section is intended to or shall affect the relative rights against the Company of the Holders of the Securities and (a) the holders of Senior Indebtedness (b) the holders of Existing Subordinated Indebtedness or (c) other creditors of the Company other than creditors in respect of General Obligations. ARTICLE FIFTEEN REPAYMENT AT THE OPTION OF HOLDERS SECTION 15.01. Applicability of Article. Securities of any series which are repayable at the option of the Holders thereof before their Stated Maturity shall be repaid in accordance with their terms and (except as otherwise specified pursuant to Section 3.01 for Securities of such series) in accordance with this Article. SECTION 15.02. Repayment of Securities. Each Security which is subject to repayment in whole or in part at the option of the Holder thereof on a Repayment Date shall be repaid at the applicable Repayment Price together with interest accrued to such Repayment Date as specified pursuant to Section 3.01. SECTION 15.03. Exercise of Option; Notice. Each Holder desiring to exercise such Holder's option for repayment shall, as conditions to such repayment, surrender the Security to be repaid in whole or in part together with written notice of the exercise of such option at any office or agency of the Company in a Place of Payment, not less than 30 nor more than 45 days prior to the Repayment Date; provided, however, that surrender of Bearer Securities together with written notice of exercise of such option shall be made at an office or agency located outside the United States except as otherwise provided in Section 5.02. Such notice, which shall be irrevocable, shall specify the principal amount of such Security to be repaid, which shall be equal to the minimum authorized 52
denomination for such Security or an integral multiple thereof, and shall identify the Security to be repaid and, in the case of a partial repayment of the Security, shall specify the denomination or denominations of the Security or Securities of the same series to be issued to the Holder for the portion of the principal of the Security surrendered which is not to be repaid. If any Bearer Security surrendered for repayment shall not be accompanied by all unmatured coupons and all matured coupons in default, such Bearer Security may be paid after deducting from the Repayment Price an amount equal to the face amount of all such missing coupons, or the surrender of such missing coupon or coupons may be waived by the Company and the Trustee if there be furnished to them such security or indemnity as they may require to save each of them and any Paying Agent harmless. If thereafter the Holder of such Bearer Security shall surrender to the Trustee or any Paying Agent any such missing coupon in respect of which a deduction shall have been made from the Repayment Price, such Holder shall be entitled to receive the amount so deducted without interest thereon; provided, however, that interest represented by coupons shall be payable only at an office or agency located outside the United States except as otherwise provided in Section 5.02. The Company shall execute and the Trustee shall authenticate and deliver without service charge to the Holder of any Registered Security so surrendered a new Registered Security or Securities of the same series and tender of any authorized denomination specified in the foregoing notice, in an aggregate principal amount equal to any portion of the principal of the Registered Security so surrendered which is not to be repaid. The Company shall execute and the Trustee shall authenticate and deliver without service charge to the Holder of any Bearer Security so surrendered a new Registered Security or Securities or new Bearer Security or Securities (and all appurtenant unmatured coupons and matured coupons in default) or any combination thereof of the same series and tenor of any authorized denomination or denominations specified in the foregoing notice, in an aggregate principal amount equal to any portion of the principal of the Security so surrendered which is not to be repaid; provided, however, that the issuance of a Registered Security therefor shall be subject to applicable laws and regulations, including provisions of the United States federal income tax laws and regulations in effect at the time of the exchange; neither the Company, the Trustee nor the Security Registrar shall issue Registered Securities for Bearer Securities if it has received an Opinion of Counsel that as a result of such issuance the Company would suffer adverse consequences under the United States federal income tax laws then in effect and the Company has delivered to the Trustee a Company Order directing the Trustee not to make such issuances thereafter unless and until the Trustee receives a subsequent Company Order to the contrary. The Company shall deliver copies of such Company Order to the Security Registrar. For all purposes of this Indenture, unless the context otherwise requires, all provisions relating to the repayment of Securities shall relate, in the case of any Security repaid or to be repaid only in part, to the portion of the principal of such Security which has been or is to be repaid. SECTION 15.04. Election of Repayment by Remarketing Entities. The Company may elect, with respect to Securities of any series which are repayable at the option of the Holders thereof before their Stated Maturity, at any time prior to any Repayment Date to designate one or more Remarketing Entities to purchase, at a price equal to the Repayment Price, Securities of such series from the Holders thereof who give notice and surrender their Debt Securities in accordance with Section 15.03. SECTION 15.05. Securities Payable on the Repayment Date. Notice of exercise of the option of repayment having been given and the Securities so to be repaid having been surrendered as aforesaid, such Securities shall, unless purchased in accordance with Section 15.04, on the Repayment Date become due and payable at the price therein specified and from and after the Repayment Date such Securities shall cease to bear interest and shall be paid on the Repayment Date, and the coupons for such interest appertaining to Bearer Securities so to be repaid, except to the extent provided above, shall be void, unless the Company shall default in the payment of such price, in which case the Company shall continue to be obligated for the principal amount of such Securities and shall be obligated to pay interest on such principal amount at the rate prescribed therefor by such Securities from time to time until payment in full of such principal amount. ARTICLE SIXTEEN MEETINGS OF HOLDERS OF SECURITIES SECTION 16.01. Purposes for Which Meetings May Be Called. If Securities of a series are issuable in whole or in part as Bearer Securities, a meeting of Holders of Securities of such series may be called at any time and from time to time pursuant to this Article to make, give or take any request, demand, authorization, direction, notice, consent, waiver or other Act provided by this Indenture to be made, given or taken by Holders of Securities of such series. SECTION 16.02. Call, Notice and Place of Meetings. (i) The Trustee may at any time call a meeting of Holders of Securities of any series issuable as Bearer Securities for any purpose specified in Section 16.01, to be held at such time and at such place in the City of Columbus, Ohio, the Borough of Manhattan, The City of New York, or in London as the Trustee shall determine. Notice of every meeting of Holders of Securities of any series, setting forth the time and the place of such meeting and in general terms the action proposed to be taken at such meeting, shall be given, in the manner provided in Section 1.06, not less than 21 nor more than 180 days 53
prior to the date fixed for the meeting. (ii) In case at any time the Company, pursuant to a Board Resolution, or the Holders of at least 10% in principal amount of the Outstanding Securities of any series shall have requested the Trustee to call a meeting of the Holders of Securities of such series for any purpose specified in Section 16.01, by written request setting forth in reasonable detail the action proposed to be taken at the meeting, and the Trustee shall not have made the first publication of the notice of such meeting within 21 days after receipt of such request or shall not thereafter proceed to cause the meeting to be held as provided herein, then the Company or the Holders of Securities of such series in the amount above specified, as the case may be, may determine the time and the place in the City of Columbus, Ohio, the Borough of Manhattan, The City of New York, or in London for such meeting and may call such meeting for such purposes by giving notice thereof as provided in subsection (i) of this Section. SECTION 16.03. Persons Entitled To Vote at Meetings. To be entitled to vote at any meeting of Holders of Securities of any series, a Person shall be (1) a Holder of one or more Outstanding Securities of such series, or (2) a Person appointed by an instrument in writing as proxy for a Holder or Holders of one or more Outstanding Securities of such series by such Holder or Holders. The only Persons who shall be entitled to be present or to speak at any meeting of Holders of Securities of any series shall be the Persons entitled to vote at such meeting and their counsel, any representatives of the Trustee and its counsel and any representatives of the Company and its counsel. SECTION 16.04. Quorum, Action. The Persons entitled to vote a majority in principal amount of the Outstanding Securities of a series shall constitute a quorum for a meeting of Holders of Securities of such series; provided, however, that if any action is to be taken at such meeting with respect to a consent or waiver which this Indenture expressly provides may be given by the Holders of a greater percentage in principal amount of the Outstanding Securities of a series, the Persons entitled to vote such greater percentage in principal amount of the Outstanding Securities of such series shall constitute a quorum. In the absence of a quorum within 30 minutes of the time appointed for any such meeting, the meeting shall, if convened at the request of Holders of Securities of such series, be dissolved. In the absence of a quorum in any other case the meeting may be adjourned for a period of not less than 10 days as determined by the chairman of the meeting prior to the adjournment of such meeting. In the absence of a quorum at any such adjourned meeting, such adjourned meeting may be further adjourned for a period of not less than 10 days as determined by the chairperson of the meeting prior to the adjournment of such adjourned meeting. Notice of the reconvening of any adjourned meeting shall be given as provided in Section 16.02(i), except that such notice need be given only once not less than five days prior to the date on which the meeting is scheduled to be reconvened. Notice of the reconvening of an adjourned meeting shall state expressly the percentage, as provided above, of the principal amount of the Outstanding Securities of such series which shall constitute a quorum. Except as limited by the provisos to Section 9.02, any resolution presented to a meeting or adjourned meeting duly reconvened at which a quorum is present as aforesaid may be adopted only by the affirmative vote of the Holders of a majority in principal amount of the Outstanding Securities of the series; provided, however, that, except as limited by the provisos to Section 9.02, any resolution with respect to any consent or waiver which this Indenture expressly provides may be given by the Holders of a greater percentage in principal amount of the Outstanding Securities of a series may be adopted at a meeting or an adjourned meeting duly reconvened and at which a quorum is present as aforesaid only by the affirmative vote of the Holders of such greater percentage in principal amount of the Outstanding Securities of that series; and provided further that, except as limited by the provisos to Section 9.02, any resolution with respect to any request, demand, authorization, direction, notice, consent, waiver or other Act which this Indenture expressly provides may be made, given or taken by the Holders of a specified percentage, which is less than a majority in principal amount of the Outstanding Securities of a series may be adopted at a meeting or an adjourned meeting duly reconvened and at which a quorum is present as aforesaid by the affirmative vote of the Holders of such specified percentage in principal amount of the Outstanding Securities of that series. Any resolution passed or decision taken at any meeting of Holders of Securities of any series duly held in accordance with this Section shall be binding on all the Holders of Securities of such series and the related coupons, whether or not present or represented at the meeting. SECTION 16.05. Determination of Voting Rights; Conduct and Adjournment of Meetings. (a) Notwithstanding any other provisions of this Indenture, the Trustee may make such reasonable regulations as it may deem advisable for any meeting of Holders of Securities of such series in regard to proof of the holding of Securities of such series and of the appointment of proxies and in regard to the appointment and duties of inspectors of votes, the submission and examination of proxies, certificates and other evidence of the right to vote, and such other matters concerning the conduct of the meeting as it shall deem appropriate. Except as otherwise permitted or required by any such regulations, the holding of Securities shall be proved in the manner specified in Section 1.04 and the appointment of any proxy shall be proved in the manner specified in Section 1.04 or, in the case of Bearer Securities, by having the signature of the person executing the proxy witnessed or guaranteed by any trust company, bank or banker authorized by Section 1.04 to certify to the holding of Bearer Securities. Such regulations may provide that written instruments appointing proxies, regular on their face, may be presumed valid and genuine without the proof specified in Section 1.04 or other proof. (b) The Trustee shall, by an instrument in writing, appoint a temporary chairperson of the meeting, unless the meeting shall have been called by the Company or by Holders of Securities as provided in Section 16.02(ii), in which case the Company or the Holders of Securities of the series calling the meeting, as the case may be, shall in like manner appoint a temporary chairperson. A permanent 54
chairperson and a permanent secretary of the meeting shall be elected by vote of the Persons entitled to vote a majority in principal amount of the Outstanding Securities of such series represented at the meeting. (c) At any meeting each Holder of a Security of such series or proxy shall be entitled to one vote for each $1,000 principal amount (or the equivalent in ECU, any other composite currency or a Foreign Currency) of Securities of such series held or represented by him; provided, however, that no vote shall be cast or counted at any meeting in respect of any Security challenged as not Outstanding and ruled by the chairperson of the meeting not to be Outstanding. The chairperson of the meeting shall have no right to vote, except as a Holder of a Security of such series or proxy. (d) Any meeting of Holders of Securities of any series duly called pursuant to Section 16.02 at which a quorum is present may be adjourned from time to time by Persons entitled to vote a majority in principal amount of the Outstanding Securities of such series represented at the meeting; and the meeting may be held as so adjourned without further notice. SECTION 16.06. Counting Votes and Recording Action of Meetings. The vote upon any resolution submitted to any meeting of Holders of Securities of any series shall be by written ballots on which shall be subscribed the signatures of the Holders of Securities of such series or of their representatives by proxy and the principal amounts and serial numbers of the Outstanding Securities of such series held or represented by them. The permanent chairperson of the meeting shall appoint two inspectors of votes who shall count all votes cast at the meeting for or against any resolution and who shall make and file with the secretary of the meeting their verified written reports in triplicate of all votes cast at the meeting. A record, at least in triplicate, of the proceedings of each meeting of Holders of Securities of any series shall be prepared by the secretary of the meeting and there shall be attached to said record the original reports of the inspectors of votes on any vote by ballot taken thereat and affidavits by one or more persons having knowledge of the facts setting forth a copy of the notice of the meeting and showing that said notice was given as provided in Section 16.02 and, if applicable, Section 16.04. Each copy shall be signed and verified by the affidavits of the permanent chairperson and secretary of the meeting and one such copy shall be delivered to the Company, and another to the Trustee to be preserved by the Trustee, the latter to have attached thereto the ballots voted at the meeting. Any record so signed and verified shall be conclusive evidence of the matters therein stated. ARTICLE SEVENTEEN MISCELLANEOUS SECTION 17.01. Counterparts. This Indenture may be executed in any number of counterparts, each of which shall be an original; but such counterparts shall together constitute but one and the same instrument. Citibank, N.A. hereby accepts the trusts in this Indenture declared and provided, upon the terms and conditions hereinabove set forth. IN WITNESS WHEREOF, the parties hereto have caused this Indenture to be duly executed, and their respective corporate seals to be hereunto affixed and attested, all as of the day and year first above written. BANC ONE CORPORATION, by Attest: ________________________ [CORPORATE SEAL] Assistant Secretary CITIBANK, N.A. as Trustee, by _______________________ Attest: ________________________ Assistant Secretary 55
111 STATE OF OHIO, ) ) ss.: COUNTY OF [ ] ) On this day of 1995, before me personally came to me known, , who, being by me duly sworn, did depose and say that he resides at []; THAT HE IS [ ] OF BANC ONE CORPORATION, ONE OF THE corporations described in and which executed the foregoing instrument; that he knows the corporate seal of said corporation; that the seal affixed to said instrument is such corporate seal; that it was so affixed by authority of the Board of Directors of said corporation; and that he signed his name thereto by like authority. Notary Public [Notarial Seal] STATE OF NEW YORK, ) ) ss.: COUNTY OF NEW YORK,) On this day of 1995, before me personally appeared , to me known, who, being by me duly sworn, did depose and say that he resides at ; that he is a of CITIBANK, N.A., one of the parties described in and which executed the foregoing instrument; that he knows the corporate seal of said corporation; that the seal affixed to said instrument is such corporate seal; that it was so affixed by authority of the Board of Directors of said corporation; and that he signed his name thereto by like authority. Notary Public [Notarial Seal] 56
Exhibit 4.12(a) FIRST CHICAGO NBD CORPORATION AND THE CHASE MANHATTAN BANK (NATIONAL ASSOCIATION) TRUSTEE ---------------- Indenture Dated as of December 1, 1995 ---------------- SUBORDINATED DEBT SECURITIES
TABLE OF CONTENTS* ARTICLE ONE DEFINITIONS AND OTHER PROVISIONS OF GENERAL APPLICATION PAGE ---- SECTION 1.01. Definitions.................................................. 11 "this Indenture" and certain other terms..................... 11 "Act"........................................................ 11 "Affiliate".................................................. 12 "Authenticating Agent"....................................... 12 "Authorized Newspaper"....................................... 12 "Authorized Officer"......................................... 12 "Bank"....................................................... 12 "Bearer Security"............................................ 12 "Board of Directors"......................................... 12 "Board Resolution"........................................... 12 "Business Day"............................................... 12 "CEDEL; CEDEL S.A.".......................................... 12 "Commission"................................................. 12 "Common Stock"............................................... 12 "Common Depositary".......................................... 12 "Company".................................................... 12 "Company Request" and "Company Order"........................ 13 "corporation"................................................ 13 "Co-Security Register"....................................... 13 "coupon"..................................................... 13 "Default".................................................... 13 "Defaulted Interest"......................................... 13 "Depositary"................................................. 13 "Designated Currency"........................................ 13 "Dollar"..................................................... 13 "ECU"........................................................ 13 "Euroclear".................................................. 13 "European Communities"....................................... 13 "Event of Default"........................................... 13 "Exchange Rate".............................................. 13 "Exchange Rate Agent"........................................ 13 "Exchange Rate Officer's Certificate"........................ 13 "Existing Subordinated Indebtedness"......................... 13 "Foreign Currency"........................................... 14 "General Obligations"........................................ 14 "Global Exchange Date"....................................... 14 "Global Security"............................................ 14 "Holder"..................................................... 14 "interest"................................................... 14 "Interest Payment Date"...................................... 14 "Maturity"................................................... 14 "Officers' Certificate"...................................... 14 "Opinion of Counsel"......................................... 15 - ------------------- *This table of Contents is not part of the Indenture. Page 2
PAGE ---- "Original Issue Discount Security"........................... 15 "Outstanding"................................................ 15 "Paying Agent"............................................... 15 "Person"..................................................... 15 "Place of Payment"........................................... 15 "Predecessor Security"....................................... 15 "Principal Corporate Trust Office"........................... 15 "Principal Paying Agent"..................................... 16 "Redemption Date"............................................ 16 "Redemption Price"........................................... 16 "Registered Security"........................................ 16 "Regular Record Date"........................................ 16 "Remarketing Entity"......................................... 16 "Repayment Date"............................................. 16 "Repayment Price"............................................ 16 "Responsible Officer"........................................ 16 "Security" or "Securities"................................... 16 "Security Register".......................................... 16 "Security Registrar"......................................... 16 "Senior Indebtedness"........................................ 16 "Special Record Date"........................................ 16 "Stated Maturity"............................................ 17 "Subsidiary of the Company" or "Subsidiary".................. 17 "Trustee".................................................... 17 "Trust Indenture Act" or "TIA"............................... 17 "United States".............................................. 17 "United States Alien"........................................ 17 "Vice President"............................................. 17 SECTION 1.02. Compliance Certificates and Opinions......................... 17 SECTION 1.03. Form of Documents Delivered to Trustee....................... 18 SECTION 1.04. Acts of Holders.............................................. 18 SECTION 1.05. Notices, etc., to Trustee and Company........................ 20 SECTION 1.06. Notices to Holders; Waiver................................... 20 SECTION 1.07. Language of Notices, Etc..................................... 21 SECTION 1.08. Conflict with Trust Indenture Act............................ 21 SECTION 1.09. Effect of Headings and Table of Contents..................... 21 SECTION 1.10. Successors and Assigns....................................... 21 SECTION 1.11. Separability Clause.......................................... 21 SECTION 1.12. Benefits of Indenture........................................ 21 SECTION 1.13. Legal Holidays............................................... 21 SECTION 1.14. Governing Law................................................ 22 ARTICLE TWO SECURITY FORMS SECTION 2.01. Forms Generally.............................................. 22 SECTION 2.02. Form of Securities........................................... 22 Page 3
PAGE ---- SECTION 2.03. Form of Trustee's Certificate of Authentication.............. 23 SECTION 2.04. Global Securities............................................ 23 ARTICLE THREE THE SECURITIES SECTION 3.01. Title and Terms.............................................. 23 SECTION 3.02. Denominations................................................ 25 SECTION 3.03. Execution, Authentication, Delivery and Dating............... 25 SECTION 3.04. Temporary Securities......................................... 27 SECTION 3.05. Registration, Registration of Transfer and Exchange.......... 29 SECTION 3.06. Mutilated, Destroyed, Lost and Stolen Securities............. 32 SECTION 3.07. Payment of Interest; Interest Rights Preserved............... 32 SECTION 3.08. Persons Deemed Owners........................................ 34 SECTION 3.09. Cancellation................................................. 34 SECTION 3.10. Computation of Interest...................................... 34 SECTION 3.11. Forms of Certification....................................... 34 SECTION 3.12. Judgments.................................................... 35 ARTICLE FOUR REDEMPTION OF SECURITIES SECTION 4.01. Applicability of Article..................................... 35 SECTION 4.02. Election to Redeem; Notice to Trustee........................ 35 SECTION 4.03. Selection by Security Registrar of Securities to be Redeemed.............................................. 36 SECTION 4.04. Notice of Redemption......................................... 36 SECTION 4.05. Deposit of Redemption Price.................................. 37 SECTION 4.06. Securities Payable on Redemption Date........................ 37 SECTION 4.07. Securities Redeemed in Part.................................. 37 SECTION 4.08. Redemption Suspended During Event of Default................. 37 ARTICLE FIVE COVENANTS SECTION 5.01. Payment of Principal, Premium and Interest................... 38 SECTION 5.02. Maintenance of Office or Agency.............................. 38 SECTION 5.03. Money for Security Payments to Be Held in Trust.............. 39 SECTION 5.04. Additional Amounts........................................... 40 SECTION 5.05. Statement as to Compliance................................... 41 SECTION 5.06. Maintenance of Corporate Existence, Rights and Franchises.... 41 Page 4
ARTICLE SIX HOLDERS' LISTS AND REPORTS BY TRUSTEE AND COMPANY PAGE ---- SECTION 6.01. Company to Furnish Trustee Names and Addresses of Holders.... 41 SECTION 6.02. Preservation of Information; Communications to Holders....... 42 SECTION 6.03. Reports by Trustee........................................... 42 SECTION 6.04. Reports by Company........................................... 43 ARTICLE SEVEN REMEDIES SECTION 7.01. Events of Default............................................ 43 SECTION 7.02. Acceleration of Maturity; Rescission and Annulment........... 44 SECTION 7.03. Collection of Indebtedness and Suits for Enforcement by Trustee...................................... 44 SECTION 7.04. Trustee May File Proofs of Claim............................. 45 SECTION 7.05. Trustee May Enforce Claims Without Possession of Securities............................................... 46 SECTION 7.06. Application of Money Collected............................... 46 SECTION 7.07. Limitation on Suits.......................................... 46 SECTION 7.08. Unconditional Right of Holders to Receive Principal, Premium and Interest............................. 47 SECTION 7.09. Restoration of Rights and Remedies........................... 47 SECTION 7.10. Rights and Remedies Cumulative............................... 47 SECTION 7.11. Delay or Omission Not Waiver................................. 47 SECTION 7.12. Control by Noteholders....................................... 48 SECTION 7.13. Waiver of Past Defaults...................................... 48 SECTION 7.14. Undertaking for Costs........................................ 48 SECTION 7.15. Waiver of Stay or Extension Laws............................. 48 ARTICLE EIGHT THE TRUSTEE SECTION 8.01. Certain Duties and Responsibilities.......................... 49 SECTION 8.02. Notice of Default............................................ 49 SECTION 8.03. Certain Rights of Trustee.................................... 50 SECTION 8.04. Not Responsible for Recitals or Issuance of Notes............ 50 SECTION 8.05. May Hold Securities.......................................... 51 SECTION 8.06. Money Held in Trust.......................................... 51 SECTION 8.07. Compensation and Reimbursement............................... 51 SECTION 8.08. Disqualification; Conflicting Interests...................... 51 Page 5
PAGE ---- SECTION 8.09. Corporate Trustee Required; Eligibility...................... 52 SECTION 8.10. Resignation and Removal; Appointment of Successor............ 52 SECTION 8.11. Acceptance of Appointment by Successor....................... 53 SECTION 8.12. Merger, Conversion, Consolidation or Succession to Business of Trustee........................... 54 SECTION 8.13. Preferential Collection of Claims against Company............ 54 SECTION 8.14. Appointment of Authenticating Agents......................... 54 ARTICLE NINE SUPPLEMENTAL INDENTURES SECTION 9.01. Supplemental Indentures Without Consent of Holders........... 56 SECTION 9.02. Supplemental Indentures With Consent of Holders.............. 56 SECTION 9.03. Execution of Supplemental Indentures......................... 57 SECTION 9.04. Effect of Supplemental Indentures............................ 57 SECTION 9.05. Conformity with Trust Indenture Act.......................... 57 SECTION 9.06. Reference in Securities to Supplemental Indentures........... 58 SECTION 9.07. Subordination Unimpaired..................................... 58 ARTICLE TEN CONSOLIDATION, MERGER, CONVEYANCE OR TRANSFER SECTION 10.01. Company May Consolidate, etc., Only on Certain Terms......... 58 SECTION 10.02. Successor Corporation Substituted............................ 58 ARTICLE ELEVEN SATISFACTION AND DISCHARGE SECTION 11.01. Satisfaction and Discharge of Indenture...................... 59 SECTION 11.02. Application of Trust Money................................... 59 SECTION 11.03. Reinstatement................................................ 60 ARTICLE TWELVE IMMUNITY OF INCORPORATORS, STOCKHOLDERS, OFFICERS AND DIRECTORS SECTION 12.01. Exemption from Individual Liability.......................... 60 ARTICLE THIRTEEN SINKING FUNDS SECTION 13.01. Applicability of Article..................................... 60 SECTION 13.02. Satisfaction of Sinking Fund Payments with Securities.................................................. 61 SECTION 13.03. Redemption of Securities for Sinking Fund.................... 61 Page 6
ARTICLE FOURTEEN SUBORDINATION OF SECURITIES PAGE ---- SECTION 14.01. Agreement to Subordinate..................................... 61 SECTION 14.02. Distribution on Dissolution, Liquidation and Reorganization; Subrogation of Securities................... 61 SECTION 14.03. Payments on Securities Prohibited During Event of Default under Senior Indebtedness........................ 63 SECTION 14.04. Payments on Securities Permitted............................. 64 SECTION 14.05. Authorization of Holders to Trustee to Effect Subordination............................................... 64 SECTION 14.06. Notice to Trustee............................................ 64 SECTION 14.07. Right of Trustee to Hold Senior Indebtedness or General Obligations...................................... 64 SECTION 14.08. Article Fourteen Not to Prevent Defaults or 64 Events of Default........................................... SECTION 14.09. Securities to Rank Pari Passu with Existing Subordinated Indebtedness; Payment of Proceeds in Certain Cases................................... 64 ARTICLE FIFTEEN REPAYMENT AT THE OPTION OF HOLDERS SECTION 15.01. Applicability of Article..................................... 66 SECTION 15.02. Repayment of Securities...................................... 66 SECTION 15.03. Exercise of Option; Notice................................... 66 SECTION 15.04. Election of Repayment by Remarketing Entities................ 67 SECTION 15.05. Securities Payable on the Repayment Date..................... 67 ARTICLE SIXTEEN MEETINGS OF HOLDERS OF SECURITIES SECTION 16.01. Purposes for Which Meetings May Be Called.................... 67 SECTION 16.02. Call, Notice and Place of Meetings........................... 67 SECTION 16.03. Persons Entitled to Vote at Meetings......................... 68 SECTION 16.04. Quorum; Action............................................... 68 SECTION 16.05. Determination of Voting Rights; Conduct and Adjournment of Meetings..................................... 69 SECTION 16.06. Counting Votes and Recording Action of Meetings.................................................... 69 Page 7
ARTICLE SEVENTEEN MISCELLANEOUS PAGE ---- SECTION 17.01. Counterparts................................................... 65 TESTIMONIUM................................................................... 65 SIGNATURES AND SEALS.......................................................... 65 ACKNOWLEDGMENTS............................................................... 65 EXHIBIT A. Form of Certificate to be Given by Person En- titled to Receive Bearer Security EXHIBIT B. Form of Certificate to be Given by Euroclear and CEDEL S.A. in Connection with the Exchange of a Portion of a Temporary Global Security EXHIBIT C. Form of Certificate to be Given by Euroclear and CEDEL S.A. to Obtain Interest Prior to an Exchange Date EXHIBIT D. Form of Certificate to be Given by Beneficial Owners to Obtain Interest Prior to an Exchange Date Page 8
TABLE SHOWING REFLECTION IN INDENTURE OF CERTAIN PROVISIONS OF TRUST INDENTURE ACT OF 1939 REFLECTED IN INDENTURE ---------------------- SECTION ------- TIA (S) 310(a)(1) ......................................... 8.09 (a)(2) .............................................. 8.09 (a)(3) .............................................. Not Applicable (a)(4) .............................................. Not Applicable (a)(5) .............................................. 8.09 (b) ................................................. 8.08 8.10 (c) ................................................. Not Applicable (S) 311(a) ........................................... 8.13 (b) ................................................. 8.13 (S) 312(a) ............................................ 6.01 6.02(i) (b) ................................................. 6.02(ii) (c) ................................................. 6.02(iii) (S) 313(a) ........................................... 6.03(i) (b) ................................................. 6.03(ii) (c) ................................................. 6.03(i), (ii) and (iii) (d) ................................................. 6.03(iii) (S) 314(a) ............................................ 6.04 5.05 (b) ................................................. Not Applicable (c)(1) .............................................. 1.02 (c)(2) .............................................. 1.02 (c)(3) .............................................. Not Applicable (d) ................................................. Not Applicable (e) ................................................. 1.02 (f) ................................................. Not Applicable (S) 315(a) ........................................... 8.01(i) 8.01(iii) (b) ................................................. 8.02 (c) ................................................. 8.01(ii) (d) ................................................. 8.01 (d)(1) .............................................. 8.01(i) (d)(2) .............................................. 8.01(iii)(b) (d)(3) .............................................. 8.01(iii)(c) (e) ................................................. 7.14 (S) 316(a) ........................................... 1.01 (S) 316(a)(1)(A) ...................................... 7.02 7.12 (a)(1)(B) ........................................... 7.13 (a)(2) .............................................. Not Applicable (b) ................................................. 7.08 (c) ................................................. 1.04(viii) Page 9
REFLECTED IN INDENTURE ---------------------- SECTION ------- (S) 317(a)(1) .......................................... 7.03 (a)(2) ............................................... 7.04 (b) .................................................. 5.03 (S) 318(a) ............................................. 1.08 (c) .................................................. 1.08 Page 10
THIS INDENTURE is entered into as of December 1, 1995, between FIRST CHICAGO NBD CORPORATION, a corporation organized and existing under the laws of the State of Delaware (hereinafter called the "Company"), having its principal executive office at One First National Plaza, Chicago, Illinois 60670, and THE CHASE MANHATTAN BANK (NATIONAL ASSOCIATION), a national banking association, as trustee (hereinafter called the "Trustee"), having its principal corporate trust office at 4 Chase MetroTech Center, New York, New York 11245, Attention: Institutional Trust Group. RECITALS OF THE COMPANY The Company deems it necessary from time to time to issue its unsecured subordinated debentures, notes, bonds and other evidences of indebtedness to be issued in one or more series (hereinafter called the "Securities") as hereinafter set forth, and to provide therefor the Company has duly authorized the execution and delivery of this Indenture. All things necessary to make this Indenture a valid agreement of the Company, in accordance with its terms, have been done. NOW, THEREFORE, THIS INDENTURE WITNESSETH: For and in consideration of the premises and the purchase of the Securities by the Holders thereof, it is mutually covenanted and agreed, for the equal and proportionate benefit of all Holders of the Securities or of any series thereof, as follows: ARTICLE ONE DEFINITIONS AND OTHER PROVISIONS OF GENERAL APPLICATION SECTION 1.01. Definitions. For all purposes of this Indenture, except as otherwise expressly provided or unless the context otherwise requires: (i) the term "this Indenture" means this instrument as originally executed or as it may from time to time be supplemented or amended by one or more indentures supplemental hereto entered into pursuant to the applicable provisions hereof and shall include the terms of particular series of Securities established as contemplated by Section 3.01; (ii) all references in this instrument to designated "Articles", "Sections" and other subdivisions are to the designated Articles, Sections and other subdivisions of this Indenture. The words "herein", "hereof" and "hereunder" and other words of similar import refer to this Indenture as a whole and not to any particular Article, Section or other subdivision; (iii) the terms defined in this Article have the meanings assigned to them in this Article and include the plural as well as the singular; (iv) all other terms used herein which are defined in the Trust Indenture Act, either directly or by reference therein, have the meanings assigned to them therein; and (v) all accounting terms not otherwise defined herein have the meanings assigned to them in accordance with generally accepted accounting principles, and, except as may be otherwise expressly provided herein or in one or more indentures supplemental hereto, the term "generally accepted accounting principles" with respect to any computation required or permitted hereunder shall mean such accounting principles as are generally accepted at the date of such computation. "Act", when used with respect to any Holder, has the meaning specified in Section 1.04. Page 11
"Affiliate" of any specified Person means any other Person directly or indirectly controlling or controlled by or under direct or indirect common control with such specified Person. For the purposes of this definition, "control" when used with respect to any specified Person means the power to direct the management and policies of such Person, directly or indirectly, whether through the ownership of voting securities, by contract or otherwise; and the terms "controlling" and "controlled" have meanings correlative to the foregoing. "Authenticating Agent" means any Person authorized to act on behalf of the Trustee to authenticate Securities pursuant to Section 8.14. "Authorized Newspaper" means a newspaper, in an official language of the country of publication or in the English language, customarily published on each Business Day, whether or not published on Saturdays, Sundays or holidays, and of general circulation in the place in connection with which the term is used or in the financial community of such place. Where successive publications are required to be made in Authorized Newspapers, the successive publications may be made in the same or in different newspapers in the same city meeting the foregoing requirements and in each case on any Business Day. "Authorized Officer" means the Chairman of the Board, the President, any Vice Chairman of the Board, the Chief Financial Officer, any Vice President, the Treasurer, the Secretary, the Comptroller, any Assistant Comptroller, any Assistant Treasurer or any Assistant Secretary of the Company. "Bank" means The First National Bank of Chicago, a national banking association duly organized and existing under the laws of the United States of America. "Bearer Security" means any Security in the form established pursuant to Section 2.02 which is payable to bearer, including, without limitation, unless the context otherwise indicates, a Security in global bearer form. "Board of Directors" means either the board of directors of the Company or any duly authorized committee of that board. "Board Resolution" means a copy of a resolution certified by the Secretary or an Assistant Secretary of the Company to have been duly adopted by the Board of Directors and to be in full force and effect on the date of such certification, and delivered to the Trustee. "Business Day" means any day, other than a Saturday or Sunday, on which banking institutions in the City of Chicago and any Place of Payment for the Securities are open for business. "CEDEL" or "CEDEL S.A." means Cedel Bank, societe anonyme or its successors. "Commission" means the Securities and Exchange Commission, as from time to time constituted, created under the Securities Exchange Act of 1934, or if any time after the execution and delivery of this instrument such Commission is not existing and performing the duties now assigned to it under the Trust Indenture Act, then the body performing such duties on such date. "Common Stock" means any stock of any class of the Company which has no preference in respect of dividends or of amounts payable in the event of any voluntary or involuntary liquidation, dissolution or winding up of the Company and which is not subject to redemption by the Company and includes the common stock, $1 par value per share, of the Company as the same exists at the date of this Indenture or as such stock may be constituted from time to time. "Common Depositary" has the meaning specified in Section 3.04(ii). "Company" means the Person named as the "Company" in the first paragraph of this instrument until any successor corporation shall have become such pursuant to the applicable provisions of this Indenture, and thereafter "Company" shall mean any such successor corporation. Page 12
"Company Request" and "Company Order" mean, respectively, a written request or order signed in the name of the Company by its Chairman of the Board, its President, a Vice Chairman of the Board, its Chief Financial Officer or a Vice President, and by its Treasurer, an Assistant Treasurer, its Comptroller, an Assistant Comptroller, its Secretary or an Assistant Secretary, and delivered to the Trustee. "corporation" includes corporations, associations, companies and business trusts. "Co-Security Registrar" has the meaning specified in Section 3.05. "coupon" means any interest coupon appertaining to a Bearer Security. "Default" has the meaning specified in Section 7.07. "Defaulted Interest" has the meaning specified in Section 3.07. "Depositary" means, with respect to the Securities of any series issuable or issued in the form of a Global Security, the Person designated as Depositary by the Company pursuant to Section 3.01 until a successor Depositary shall have been appointed pursuant to Section 3.05, and thereafter "Depositary" shall mean or include each Person who is then a Depositary hereunder, and if at any time there is more than one such Person, "Depositary" as used with respect to the Securities of any such series shall mean the Depositary with respect to the Securities of that series. "Designated Currency" has the meaning specified in Section 3.12. "Dollar" or "$" means the coin or currency of the United States of America as at the time of payment is legal tender for the payment of public and private debts. "ECU" means the European Currency Unit as defined and revised from time to time by the Council of the European Communities. "Euroclear" means Morgan Guaranty Trust Company of New York, Brussels Office, as operator of the Euroclear System. "European Communities" means the European Economic Community, the European Coal and Steel Community and the European Atomic Energy Community. "Event of Default" has the meaning specified in Article Seven. "Exchange Rate" shall have the meaning specified as contemplated in Section 3.01. "Exchange Rate Agent" shall have the meaning specified as contemplated in Section 3.01. "Exchange Rate Officer's Certificate" with respect to any date for the payment of principal of (and premium, if any) and interest on any series of Securities, means a certificate setting forth the applicable Exchange Rate and the amounts payable in Dollars and Foreign Currencies in respect of the principal of (and premium, if any) and interest on Securities denominated in ECU, and other composite currency or Foreign Currency, and signed by the Chairman of the Board, a Vice Chairman of the Board, the President, the Chief Financial Officer, any Vice President, the Treasurer or any Assistant Treasurer of the Company or the Exchange Rate Agent appointed pursuant to Section 3.01 and delivered to the Trustee. "Existing Subordinated Indebtedness" means, unless otherwise determined with respect to any series of Securities pursuant to Section 3.01, the Company's Floating Rate Subordinated Capital Notes Due December 1996, the Company's 9 7/8% Subordinated Notes Due July 1999, the Company's 9% Subordinated Notes Due June 15, 1999, the Company's 9 7/8% Subordinated Notes Due August 15, 2000, the Company's 11 1/4% Page 13
Subordinated Notes Due February 20, 2001, the Company's 10 1/4% Subordinated Notes Due May 1, 2001, the Company's 9 1/4% Subordinated Notes Due November 15, 2001, the Company's 8 7/8% Subordinated Notes Due March 15, 2002, the Company's 8 1/4% Subordinated Notes Due June 15, 2002, the Company's 9 1/5% Subordinated Notes Due December 17, 2001, the Company's 7 5/8% Subordinated Notes Due January 15, 2003, the Company's 6 7/8% Subordinated Notes Due June 15, 2003, the Company's Floating Rate Subordinated Notes Due July 28, 2003, the Company's 6 3/8% Subordinated Notes Due January 30, 2009, the Company's 7.125% Subordinated Notes Due 2007, the Company's 7 1/4% Subordinated Debentures Due 2004, the Company's 8.10% Subordinated Notes Due 2002, the Company's 7.40% Subordinated Debentures due May 10, 2023 and the Company's Floating Rate Subordinated Notes Due 2005. "Foreign Currency" means a currency issued by the government of any country other than the United States of America. "General Obligations" means, unless otherwise determined with respect to any series of Securities pursuant to Section 3.01, all obligations of the Company to make payment on account of claims in respect of derivative products such as interest and foreign exchange rate contracts, commodity contracts and similar arrangements, other than (i) obligations on account of Senior Indebtedness, (ii) obligations on account of indebtedness for money borrowed ranking pari passu with or subordinate to the Securities and (iii) obligations which by their terms are expressly stated not to be superior in right of payment to the Securities or to rank on a parity with the Securities; provided, however, that notwithstanding the foregoing, in the event that any rule, guideline or interpretation promulgated or issued by the Board of Governors of the Federal Reserve System (or other competent regulatory agency or authority), as from time to time in effect, establishes or specifies criteria for the inclusion in regulatory capital of subordinated debt of a bank holding company requiring that such subordinated debt be subordinated to obligations to creditors in addition to those set forth above, then the term "General Obligations" shall also include such additional obligations to creditors, as from time to time in effect pursuant to such rules, guidelines or interpretations. For purposes of this definition, "claim" shall have the meaning assigned thereto in Section 101(4) of the Bankruptcy Code of 1978, as amended to the date of this instrument. "Global Exchange Date" has the meaning specified in Section 3.04 (iv). "Global Security" means a Security issued to evidence all or a part of a series of Securities in accordance with Section 3.03. "Holder", with respect to a Registered Security, means a Person in whose name such Registered Security is registered in the Security Register and, with respect to a Bearer Security (or any temporary Global Security) or a coupon, means the bearer thereof. "interest", when used with respect to an Original Issue Discount Security which by its terms bears interest only after Maturity, means interest payable after Maturity. "Interest Payment Date", when used with respect to any series of Securities, means the Stated Maturity of an instalment of interest on such Securities. "Maturity", when used with respect to any Security, means the date on which the principal of such Security (or any instalment of principal) becomes due and payable as therein or herein provided, whether at the Stated Maturity or by declaration of acceleration, call for redemption or otherwise. "Officers' Certificate" means a certificate signed by the Chairman of the Board, the President, a Vice Chairman of the Board, the Chief Financial Officer or a Vice President, and by the Treasurer, an Assistant Treasurer, the Comptroller, an Assistant Comptroller, the Secretary or an Assistant Secretary of the Company, and delivered to the Trustee. Each such certificate shall contain the statements set forth in Section 1.02, if applicable. Page 14
"Opinion of Counsel" means a written opinion of counsel, who may (except as otherwise expressly provided in this Indenture) be an employee of the Company, and who shall be reasonably acceptable to the Trustee. Each such opinion shall contain the statements set forth in Section 1.02, if applicable. "Original Issue Discount Security" means any Security which provides for an amount less than the principal amount thereof to be due and payable upon a declaration of acceleration of the Maturity thereof pursuant to Section 7.02. "Outstanding", when used with respect to Securities or Securities of any series, means, as of the date of determination, all such Securities theretofore authenticated and delivered under this Indenture, except: (i) such Securities theretofore canceled by the Trustee or delivered to the Trustee for cancellation; (ii) such Securities for whose payment or redemption money in the necessary amount has been theretofore deposited with the Trustee or any Paying Agent (other than the Company) in trust or set aside and segregated in trust by the Company (if the Company shall act as its own Paying Agent) for the Holders of such Securities, provided that, if such Securities are to be redeemed, notice of such redemption has been duly given pursuant to this Indenture or provision therefor satisfactory to the Trustee has been made; and (iii) such Securities in lieu of which other Securities have been authenticated and delivered pursuant to Section 3.06 of this Indenture; provided, however, that in determining whether the Holders of the requisite principal amount of such Securities Outstanding have given any request, demand, authorization, direction, notice, consent or waiver hereunder or whether a quorum is present at a meeting of Holders of Securities, the principal amount of Original Issue Discount Securities that shall be deemed to be Outstanding for such purposes shall be the amount of the principal thereof that would be due and payable as of the date of such determination upon a declaration of acceleration of the Maturity thereof pursuant to Section 7.02, and Securities owned by the Company or any other obligor upon the Securities or any Affiliate of the Company or such other obligor shall be disregarded and deemed not to be Outstanding, except that, in determining whether the Trustee shall be protected in relying upon any such request, demand, authorization, direction, notice, consent or waiver, only Securities which a Responsible Officer of the Trustee actually knows to be so owned shall be disregarded. Securities so owned which have been pledged in good faith may be regarded as Outstanding if the pledgee establishes to the satisfaction of the Trustee the pledgee's right so to act with respect to such Securities and that the pledgee is not the Company or any other obligor upon the Securities or any Affiliate of the Company or such other obligor. "Paying Agent" means any Person authorized by the Company to pay the principal of, premium, if any, or interest on any Securities or any coupons appertaining thereto on behalf of the Company. "Person" means any individual, corporation, partnership, joint venture, association, joint-stock company, trust, unincorporated organization or government or any agency or political subdivision thereof. "Place of Payment", when used with respect to the Securities of any series, means the place or places where, subject to the provisions of Section 5.02, the principal of (and premium, if any) and interest on the Securities of that series are payable as specified in accordance with Section 3.01. "Predecessor Security" of any particular Security means every previous Security evidencing all or a portion of the same debt as that evidenced by such particular Security; and for the purposes of this definition, any Security authenticated and delivered under Section 3.06 in lieu of a lost, destroyed or stolen Security shall be deemed to evidence the same debt as the lost, destroyed or stolen Security. "Principal Corporate Trust Office" means the principal office of the Trustee, at which at any particular time its corporate trust business shall be principally administered, which office at the date of execution of this instrument is at the address set forth in the first paragraph of this instrument. Page 15
"Principal Paying Agent" means the Paying Agent, if any, designated as such by the Company pursuant to Section 3.01 of this Indenture. "Redemption Date", when used with respect to any Security to be redeemed, means the date fixed for such redemption by or pursuant to this Indenture. "Redemption Price", when used with respect to any Security to be redeemed, means the price specified in such Security at which it is to be redeemed pursuant to this Indenture. "Registered Security" means any Security in the form established pursuant to Section 2.02 which is registered in the Security Register. "Regular Record Date" for the interest payable on any Security on any Interest Payment Date means the date, if any, specified in such Security as the "Regular Record Date". "Remarketing Entity", when used with respect to the Securities of any series which are repayable at the option of the Holders thereof before their Stated Maturity, means any Person designated by the Company to purchase any such Securities. "Repayment Date", when used with respect to any Security to be repaid upon exercise of option for repayment by the Holder, means the date fixed for such repayment pursuant to this Indenture. "Repayment Price", when used with respect to any Security to be repaid upon exercise of option for repayment by the Holder, means the price at which it is to be repaid pursuant to this Indenture. "Responsible Officer", when used with respect to the Trustee, means any vice president, assistant vice president or corporate trust officer of the Corporate Trust Department of the Trustee and also means, with respect to a particular corporate trust matter, any other officer of the Trustee to whom such matter is referred because of his knowledge of and familiarity with the particular subject. "Security" or "Securities" means any Security or Securities, as the case may be, authenticated and delivered under this Indenture; provided, however, that, if at any time there is more than one Person acting as Trustee under this Indenture, "Securities," with respect to any such Person, shall mean Securities authenticated and delivered under this Indenture, exclusive, however, of Securities of any series as to which such Person is not Trustee. "Security Register" has the meaning specified in Section 3.05. "Security Registrar" has the meaning specified in Section 3.05. "Senior Indebtedness" means the principal of, premium, if any, and interest on (i) all of the Company's indebtedness for money borrowed, other than the Securities and the Existing Subordinated Indebtedness whether outstanding on the date of execution of the Indenture or thereafter created, assumed or incurred, except such indebtedness as is by its terms expressly stated to be not superior in right of payment to the Securities or the Existing Subordinated Indebtedness and (ii) any deferrals, renewals or extensions of any such Senior Indebtedness. The term "indebtedness for money borrowed" as used in the foregoing sentence shall include, without limitation, any obligation of, or any obligation guaranteed by, the Company for the repayment of borrowed money, whether or not evidenced by bonds, debentures, notes or other written instruments, and any deferred obligation for the payment of the purchase price of property or assets. "Special Record Date" for the payment of any Defaulted Interest means the date fixed by the Trustee pursuant to Section 3.07. Page 16
"Stated Maturity", when used with respect to any Security, or any instalment of principal thereof or interest thereon, means the date specified in such Security as the fixed date on which the principal of such Security, or such instalment of principal or interest, is due and payable. "Subsidiary of the Company" or "Subsidiary" means a corporation at least a majority of the outstanding voting stock of which is owned, directly or indirectly, by the Company or by one or more Subsidiaries of the Company, or by the Company and one or more Subsidiaries of the Company. As used under this heading, the term "voting stock" means stock having ordinary voting power for the election of directors irrespective of whether or not stock of any other class or classes shall have or might have voting power by reason of the happening of any contingency. "Trustee" means the Person named as the "Trustee" in the first paragraph of this instrument until a successor Trustee shall have become such pursuant to the applicable provisions of this Indenture, and thereafter "Trustee" shall mean or include each Person who is then a Trustee hereunder, and if at any time there is more than one such Person, "Trustee" as used with respect to the Securities of any series shall mean the Trustee with respect to Securities of that series. "Trust Indenture Act" or "TIA" (except as herein otherwise expressly provided) means the Trust Indenture Act of 1939, as in force at the date as of which this instrument was executed, and, to the extent required by law, as amended. "United States" means the United States of America (including the States and the District of Columbia), its territories, its possessions and other areas subject to its jurisdiction. "United States Alien", except as otherwise provided in or pursuant to this Indenture, means any Person who, for United States Federal income tax purposes, is a foreign corporation, a non-resident alien individual, a non-resident alien fiduciary of a foreign estate or trust, or a foreign partnership one or more of the members of which is, for United States Federal income tax purposes, a foreign corporation, a non-resident alien individual or a non-resident alien fiduciary of a foreign estate or trust. "Vice President", when used with respect to the Company or the Trustee, means any vice president, whether or not designated by a number or a word or words added before or after the title "vice president". SECTION 1.02. Compliance Certificates and Opinions. Upon any application or request by the Company to the Trustee to take any action under any provision of this Indenture, the Company shall furnish to the Trustee an Officers' Certificate stating that all conditions precedent, if any, provided for in this Indenture relating to the proposed action have been complied with and an Opinion of Counsel stating that in the opinion of such counsel all such conditions precedent, if any, have been complied with, except that in the case of any such application or request as to which the furnishing of such documents is specifically required by any provision of this Indenture relating to such particular application or request, no additional certificate or opinion need be furnished. Every certificate or opinion with respect to compliance with a condition or covenant provided for in this Indenture (other than the Officers' Certificate required by Section 5.05) shall include: (i) a statement that each individual signing such certificate or opinion has read such covenant or condition and the definitions herein relating thereto; (ii) a brief statement as to the nature and scope of the examination or investigation upon which the statements or opinions contained in such certificate or opinion are based; (iii) a statement that, in the opinion of each such individual, he has made such examination or investigation as is necessary to enable him to express an informed opinion as to whether or not such covenant or condition has been complied with; and Page 17
(iv) a statement as to whether, in the opinion of each such individual, such condition or covenant has been complied with. SECTION 1.03. Form of Documents Delivered to Trustee. In any case where several matters are required to be certified by, or covered by an opinion of, any specified Person, it is not necessary that all such matters be certified by, or covered by the opinion of, only one such Person, or that they be so certified or covered by only one document, but one such Person may certify or give an opinion with respect to some matters and one or more other such Persons as to other matters, and any such Person may certify or give an opinion as to such matters in one or several documents. Any certificate or opinion of an officer of the Company may be based, insofar as it relates to legal matters, upon a certificate or opinion of, or representations by, counsel, unless such officer knows, or in the exercise of reasonable care should know, that the certificate or opinion or representations with respect to the matters upon which his certificate or opinion is based are erroneous. Any such certificate or Opinion of Counsel may be based, insofar as it relates to factual matters, upon a certificate or opinion of, or representations by, an officer or officers of the Company stating that the information with respect to such factual matters is in the possession of the Company, unless such counsel knows, or in the exercise of reasonable care should know, that the certificate or opinion or representations with respect to such matters are erroneous. Where any Person is required to make, give or execute two or more applications, requests, consents, certificates, statements, opinions or other instruments under this Indenture, they may, but need not, be consolidated and form one instrument. SECTION 1.04. Acts of Holders. (i) Any request, demand, authorization, direction, notice, consent, waiver or other action provided by this Indenture to be given or taken by Holders or Holders of any series may be embodied in and evidenced by one or more instruments of substantially similar tenor signed by such Holders in person or by an agent duly appointed in writing. If Securities of a series are issuable in whole or in part as Bearer Securities, any request, demand, authorization, direction, notice, consent, waiver or other action provided by this Indenture to be given or taken by Holders may, alternatively, be embodied in and evidenced by the record of Holders of Securities voting in favor thereof, either in person or by proxies duly appointed in writing, at any meeting of Holders of Securities duly called and held in accordance with the provisions of Article Sixteen, or a combination of such instruments and any such record. Except as herein otherwise expressly provided, such action shall become effective when such instrument or instruments or record or both are delivered to the Trustee, and, where it is hereby expressly required, to the Company. Such instrument or instruments and any such record (and the action embodied therein and evidenced thereby) are herein sometimes referred to as the "Act" of the Holders signing such instrument or instruments and so voting at any such meeting. Proof of execution of any such instrument or of a writing appointing any such agent, or the holding by any Person of a Security shall be sufficient for any purpose of this Indenture and (subject to Section 8.01) conclusive in favor of the Trustee and the Company, if made in the manner provided in this Section. The record of any meeting of Holders of Securities shall be proved in the manner provided in Section 16.06. (ii) The fact and date of the execution by any Person of any such instrument or writing may be proved by the affidavit of a witness of such execution or by the certificate of any notary public or other officer authorized by law to take acknowledgments of deeds, certifying that the individual signing such instrument or writing acknowledged to him the execution thereof. Where such execution is by or on behalf of any legal entity other than an individual, such certificate or affidavit shall also constitute proof of the authority of the Person executing the same. The fact and date of the execution of any such instrument or writing, or the authority of the Person executing the same, may also be proved in any other manner which the Trustee deems sufficient. (iii) The ownership of Registered Securities shall be proved by the Security Register. Page 18
(iv) The principal amount and serial numbers of Bearer Securities held by any Person, and the date of holding the same, may be proved by the production of such Bearer Securities or by a certificate executed, as depositary, by any trust company, bank or other depositary, wherever situated, if such certificate shall be deemed by the Trustee to be satisfactory, showing that at the date therein mentioned such Person had on deposit with such depositary, or exhibited to it, the Bearer Securities therein described; or such facts may be proved by the certificate or affidavit of the Person holding such Bearer Securities, if such certificate or affidavit is deemed by the Trustee to be satisfactory. The Trustee and the Company may assume that such ownership of any Bearer Security continues until (1) another certificate or affidavit bearing a later date issued in respect of the same Bearer Security is produced, or (2) such Bearer Security is produced to the Trustee by some other Person, or (3) such Bearer Security is surrendered in exchange for a Registered Security, or (4) such Bearer Security is no longer Outstanding. (v) The fact and date of execution of any such instrument or writing, the authority of the Person executing the same and the principal amount and serial numbers of Bearer Securities held by the Person so executing such instrument or writing and the date of holding the same may also be proved in any other manner which the Trustee deems sufficient; and the Trustee may in any instance require further proof with respect to any of the matters referred to in this Section. (vi) Any request, demand, authorization, direction, notice, consent, waiver or other action by the Holder of any Security shall bind every future Holder of the same Security and the Holder of every Security issued upon the registration of transfer thereof or in exchange therefor or in lieu thereof, in respect of any action taken, suffered or omitted by the Trustee or the Company in reliance thereon, whether or not notation of such action is made upon such Security. (vii) For purposes of determining the principal amount of Outstanding Securities of any series the Holders of which are required, requested or permitted to give any request, demand, authorization, direction, notice, consent, waiver or take any other Act under the Indenture, each Security denominated in a Foreign Currency or composite currency shall be deemed to have the principal amount determined by the Exchange Rate Agent by converting the principal amount of such Security in the currency in which such Security is denominated into Dollars at the Exchange Rate as of the date such Act is delivered to the Trustee and, where it is hereby expressly required, to the Company, by Holders of the required aggregate principal amount of the Outstanding Securities of such series (or, if there is no such rate on such date, such rate on the date determined as specified as contemplated in Section 3.01). (viii) The Company may, in the circumstances permitted by the Trust Indenture Act, set a record date for purposes of determining the identity of Holders of Securities of any series entitled to give any request, demand, authorization, direction, notice, consent, waiver or take any other Act, or to vote or consent to any action by vote or consent authorized or permitted to be given or taken by Holders of Securities of such series. If not set by the Company prior to the first solicitation of a Holder of Securities of such Series made by any Person in respect of any such action, or in the case of any such vote, prior to such vote, such record date shall be the later of 30 days prior to the first solicitation of such consent or the date of the most recent list of Holders of such Securities furnished to the Trustee pursuant to Section 6.01 prior to such solicitation. (ix) Without limiting the foregoing, a Holder entitled hereunder to take any action hereunder with regard to any particular Security may do so with regard to all or any part of the principal amount of such Security or by one or more duly appointed agents each of which may do so pursuant to such appointment with regard to all or any part of such principal amount. Any notice given or action taken by a Holder or its agents with regard to different parts of such principal amount pursuant to this paragraph shall have the same effect as if given or taken by separate Holders of each such different part. (x) Without limiting the generality of the foregoing, unless otherwise specified pursuant to Section 3.01 or pursuant to one or more indentures supplemental hereto, a Holder, including a Depositary that is the Holder of a Page 19
Global Security, may make, give or take, by a proxy or proxies duly appointed in writing, any request, demand, authorization, direction, notice, consent, waiver or other action provided in this Indenture to be made, given or taken by Holders, and a Depositary that is the Holder of a Global Security may provide its proxy or proxies to the beneficial owners of interests in any such Global Security through such Depositary's standing instructions and customary practices. (xi) The Company may fix a record date for the purpose of determining the Persons who are beneficial owners of interests in any Global Security held by a Depositary entitled under the procedures of such Depositary to make, give or take, by a proxy or proxies duly appointed in writing, any request, demand, authorization, direction, notice, consent, waiver or other action provided in this Indenture to be made, given or taken by Holders. If such a record date is fixed, the Holders on such record date or their duly appointed proxy or proxies, and only such Persons, shall be entitled to make, give or take such request, demand, authorization, direction, notice, consent, waiver or other action, whether or not such Holders remain Holders after such record date. No such request, demand, authorization, direction, notice, consent, waiver or other action shall be valid or effective if made, given or taken more than 90 days after such record date. SECTION 1.05. Notices, etc., to Trustee and Company. Any request, demand, authorization, direction, notice, consent, waiver or Act of Holders or other document provided or permitted by this Indenture to be made upon, given or furnished to, or filed with, (i) the Trustee by any Holder or by the Company shall be sufficient for every purpose hereunder if made, given, furnished or filed in writing to or with the Trustee at its Principal Corporate Trust Office, or (ii) the Company by any Holder or by the Trustee shall be sufficient for every purpose hereunder (unless otherwise herein expressly provided) if in writing and mailed, first-class, postage prepaid, to the Company, to the attention of its Treasurer, addressed to it at the address of its principal office specified in the first paragraph of this Indenture or at any other address previously furnished in writing to the Trustee by the Company. SECTION 1.06. Notices to Holders; Waiver. Where this Indenture or any Security provides for notice to Holders of any event, (1) such notice shall be sufficiently given (unless otherwise herein or in such Security expressly provided) if in writing and mailed, first-class, postage prepaid, to each Holder of Registered Securities affected by such event, at his address as it appears in the Security Register, not later than the latest date, and not earlier than the earliest date, prescribed for the giving of such notice. (2) such notice shall be sufficiently given to Holders of Bearer Securities if published in an Authorized Newspaper in The City of New York and, if the Securities of such series are then listed on The International Stock Exchange of the United Kingdom and the Republic of Ireland Limited and such stock exchange shall so require, in London and, if the Securities of such series are then listed on the Luxembourg Stock Exchange and such stock exchange shall so require, in Luxembourg and, if the Securities of such series are then listed on any other stock exchange and such stock exchange shall so require, in any other required city outside the United States, or, if not practicable, elsewhere in Europe on a Business Day at least twice, the first such publication to be not earlier than the earliest date, and not later than the latest date, prescribed for the giving of such notice. In case by reason of the suspension of regular mail service or by reason of any other cause it shall be impracticable to give such notice to Holders of Registered Securities by mail, then such notification as shall be made with the approval of the Trustee shall constitute a sufficient notification for every purpose hereunder. In any case where notice to Holders of Registered Securities is given by mail, neither the failure to mail such notice, nor any defect in any notice so mailed, to any particular Holder of Registered Securities shall affect the sufficiency of such notice with respect to other Holders of Registered Securities or the sufficiency of any notice by publication to Holders of Bearer Securities given as provided above. Page 20
In case by reason of the suspension of publication of any Authorized Newspaper or Authorized Newspapers or by reason of any other cause it shall be impracticable to publish any notice to Holders of Bearer Securities as provided above, then such notification to Holders of Bearer Securities as shall be given with the approval of the Trustee shall constitute sufficient notice to such Holders for every purpose hereunder. Neither the failure to give notice by publication to Holders of Bearer Securities as provided above, nor any defect in any notice so published, shall affect the sufficiency of any notice mailed to Holders of Registered Securities as provided above. Where this Indenture provides for notice in any manner, such notice may be waived in writing by the Person entitled to receive such notice, either before or after the event, and such waiver shall be the equivalent of such notice. Waivers of notice by Holders shall be filed with the Trustee, but such filing shall not be a condition precedent to the validity of any action taken in reliance upon such waiver. SECTION 1.07. Language of Notices, Etc. Any request, demand, authorization, direction, notice, consent, or waiver required or permitted under this Indenture shall be in the English language, except that any published notice may be in an official language of the country of publication. SECTION 1.08. Conflict with Trust Indenture Act. If and to the extent that any provision of this Indenture limits, qualifies or conflicts with the duties imposed by, or with another provision (an "incorporated provision") included in this Indenture by operation of Sections 310 and 318, inclusive, of the TIA, such imposed duties or incorporated provision shall control. SECTION 1.09. Effect of Headings and Table of Contents. The Article and Section headings herein and the Table of Contents are for convenience only and shall not affect the construction hereof. SECTION 1.10. Successors and Assigns. All convenants and agreements in this Indenture by the Company shall bind its successors and assigns, whether so expressed or not. SECTION 1.11. Separability Clause. In case any provision in this Indenture or in the Securities shall be invalid, illegal or unenforceable, the validity, legality and enforceability of the remaining provisions shall not in any way be affected or impaired thereby. SECTION 1.12. Benefits of Indenture. Nothing in this Indenture or in the Securities, express or implied, shall give to any Person, other than the parties hereto and their successors hereunder, the Holders and, to the extent provided in Article Fourteen hereof, the holders of Senior Indebtedness and creditors in respect of General Obligations, any benefit or any legal or equitable right, remedy or claim under this Indenture. SECTION 1.13. Legal Holidays. In any case where any Interest Payment Date, Stated Maturity, Repayment Date or Redemption Date of any Security or any date on which any Defaulted Interest is proposed to be paid shall not be a Business Day at any Place of Payment, then (notwithstanding any other provisions of the Securities or this Indenture) payment of the principal of, premium, if any, or interest on any Securities need not be made at such Place of Payment on such date, but may be made on the next succeeding Business Day with the same force and effect as if made on the Page 21
Interest Payment Date, Stated Maturity, Repayment Date or Redemption Date or on the date on which Defaulted Interest is proposed to be paid, and, if such payment is made, no interest shall accrue on such payment for the period from and after any such Interest Payment Date, Stated Maturity, Repayment Date or Redemption Date, as the case may be. SECTION 1.14. Governing Law. This Indenture and the Securities shall be construed in accordance with and governed by the laws of the State of New York. ARTICLE TWO SECURITY FORMS SECTION 2.01. Forms Generally. All Securities and any related coupons shall have such appropriate insertions, omissions, substitutions and other variations as are required or permitted by this Indenture, and may have such letters, numbers or other marks of identification and such legends or endorsements placed thereon as may be required to comply with the rules of any securities exchange or as may, consistently herewith, be determined by the officers executing such Securities or coupons, as evidenced by their execution of the Securities or coupons. The Trustee's certificates of authentication shall be in substantially the form set forth in this Article. Unless otherwise provided as contemplated by Section 3.01 with respect to any series of Securities, the Securities of each series shall be issuable in registered form without coupons. If so provided as contemplated by Section 3.01, the Securities of a series shall be issuable solely in bearer form, or in both registered form and bearer form. Unless otherwise specified as contemplated by Section 3.01, Securities in bearer form shall have interest coupons attached. The definitive Securities and coupons shall be printed, lithographed or engraved or produced by any combination of these methods on a steel engraved border or steel engraved borders or may be produced in any other manner, all as determined by the officers executing such Securities or coupons, as evidenced by their execution of such Securities or coupons. SECTION 2.02. Form of Securities. Each Security and coupon shall be in one of the forms approved from time to time by or pursuant to a Board Resolution. Upon or prior to the delivery of a Security or coupons in any such form to the Trustee for authentication, the Company shall deliver to the Trustee the following: (i) the Board Resolution by or pursuant to which such form of Security or coupons has been approved, certified by the Secretary or an Assistant Secretary of the Company; (ii) the Officers' Certificate required by Section 3.01 of this Indenture; (iii) the Company Order required by Section 3.03 of this Indenture; and (iv) the Opinion of Counsel required by Section 3.03 of this Indenture. If temporary Securities of any series are issued in global form as permitted by Section 3.04, the form thereof shall be established as provided in this Section 2.02. Page 22
SECTION 2.03. Form of Trustee's Certificate of Authentication. TRUSTEE'S CERTIFICATE OF AUTHENTICATION This is one of the Securities of the series designated therein referred to in the within-mentioned Indenture. The Chase Manhattan Bank (National Association), as Trustee By __________________________________ Authorized Officer Section 2.04. Global Securities. If Securities of a series are issuable in whole or in part in global form, as specified as contemplated by Section 3.01, then, notwithstanding clause (xi) of Section 3.01 and the provisions of Section 3.02, such Global Security shall represent such of the outstanding Securities of such series as shall be specified therein and may provide that it shall represent the aggregate amount of Outstanding Securities from time to time endorsed thereon and that the aggregate amount of Outstanding Securities represented thereby may from time to time be reduced to reflect exchanges or increased to reflect the issuance of additional uncertificated securities of such series. Any endorsement of a Global Security to reflect the amount, or any increase or decrease in the amount, of Outstanding Securities represented thereby shall be made in such manner and upon instructions given by such Person or Persons as shall be specified therein or in the Company Order to be delivered to the Trustee pursuant to Section 3.03 or Section 3.04. Global Securities may be issued in either registered or bearer form and in either temporary or permanent form. ARTICLE THREE THE SECURITIES SECTION 3.01. Title and Terms. The aggregate principal amount of Securities which may be authenticated and delivered under this Indenture is unlimited. The Securities may be issued up to the aggregate principal amount of Securities from time to time authorized by or pursuant to a Board Resolution. The Securities may be issued in one or more series. All Securities of each series issued under this Indenture shall in all respects be equally and ratably entitled to the benefits hereof with respect to such series without preference, priority or distinction on account of the actual time or times of the authentication and delivery or Maturity of the Securities of such series. There shall be established in or pursuant to a Board Resolution, and set forth in, or determined in the manner provided in, an Officers' Certificate, or established in one or more indentures supplemental hereto, prior to the issuance of Securities of any series, (i) the title of the Securities of the series (which shall distinguish the Securities of the series from all other Securities); (ii) any limit upon the aggregate principal amount of the Securities of the series which may be authenticated and delivered under this Indenture (except for Securities authenticated and delivered upon registration of transfer of, or in exchange for, or in lieu of, other Securities of that series pursuant to this Article Three or Sections 4.07, 9.06 or 14.03); (iii) the date or dates on which the principal and premium, if any, of the Securities of the series is payable; Page 23
(iv) the rate or rates at which the Securities of the series shall bear interest, if any, or the method or methods by which such rates may be determined, if any, the date or dates from which such interest shall accrue, the Interest Payment Dates on which such interest shall be payable, the Regular Record Date for the interest payable on any Interest Payment Date and the basis upon which interest shall be calculated if other than that of a 360-day year consisting of twelve 30-day months; (v) the place or places where, subject to the provisions of Section 5.02, the principal of (and premium, if any) and interest, if any, on Securities of the series shall be payable; (vi) the extent to which any of the Securities will be issuable in temporary or permanent global form, and in such case, the Depositary for such Global Security or Securities, the terms and conditions, if any, upon which such Global Security may be exchanged in whole or in part for definitive securities, and the manner in which any interest payable on a temporary or permanent Global Security will be paid, whether or not consistent with Section 3.04 or 3.05; (vii) the office or offices or agency where, subject to Section 5.02, the Securities may be presented for registration of transfer or exchange; (viii) the period or periods within which, the price or prices at which and the terms and conditions upon which Securities of the series may be redeemed, in whole or in part, at the option of the Company; (ix) the obligation, if any, of the Company to redeem or purchase Securities of the series pursuant to any sinking fund or analogous provisions or at the option of a Holder thereof and the period or periods within which, the price or prices at which and the terms and conditions upon which Securities of the series shall be redeemed or purchased, in whole or in part, pursuant to such obligation; (x) whether, and under what conditions, additional amounts will be payable to Holders of Securities of the series pursuant to Section 5.04; (xi) if other than denominations of $1,000 and any integral multiple thereof, the denominations in which Registered Securities of the series shall be issuable; and, if other than $5,000 or any integral multiple thereof, the denominations in which Bearer Securities of the series shall be issuable; (xii) whether Securities of the series are to be issuable as Registered Securities, Bearer Securities or both, whether Securities of the series are to be issuable with or without coupons or both and, in the case of Bearer Securities, the date as of which such Bearer Securities shall be dated if other than the date of original issuance of the first Security of such series of like tenor and term to be issued; (xiii) the currency or currencies of denominations of the Securities of any series, which may be in Dollars, any Foreign Currency or any composite currency, including but not limited to the ECU, and, if any such currency of denomination is a composite currency other than the ECU, the agency or organization, if any, responsible for overseeing such composite currency; (xiv) the currency or currencies in which payment of the principal of (and premium, if any) and interest on the Securities will be made, the currency or currencies, if any, in which payment of the principal of (and premium, if any) or the interest on Registered Securities, at the election of each of the Holders thereof, may also be payable and the periods within which and the terms and conditions upon which such election is to be made and the Exchange Rate and the Exchange Rate Agent; (xv) if payments of principal of (and premium, if any), or interest on the Securities of the series are to be made in a Foreign Currency other than the currency in which such Securities are denominated, the manner in which the Exchange Rate with respect to such payments shall be determined; (xvi) the terms, if any, upon which the Securities of the series may be convertible into or exchanged for Common Stock, preferred stock (which may be represented by depositary shares), other debt securities or warrants for Common Stock, preferred stock or indebtedness or other securities of any kind of the Company or any other obligor, and the terms and conditions upon which such conversion or exchange shall be effected, including the initial conversion or exchange price or rate, the conversion or exchange period and any other provision in addition to or in lieu of those described herein; Page 24
(xvii) if the amount of payments of principal of (and premium, if any) or any interest on Securities of the series may be determined with reference to an index, the method or methods by which such amounts shall be determined; (xviii) if other than the principal amount thereof, the portion of the principal amount of Securities of the series which shall be payable upon declaration of acceleration of the Maturity thereof pursuant to Section 7.02; (xix) any addition to or change in the Events of Default or covenants of the Company pertaining to the Securities of the series; and (xx) any other terms of the series. All Securities of any one series and the coupons appertaining to Bearer Securities of such series, if any, shall be substantially identical except, in the case of Registered Securities, as to denomination and except as may otherwise be provided in or pursuant to such Board Resolution and set forth, or determined in the manner provided, in such Officers' Certificate or in any such indenture supplemental hereto. Securities of any particular series may be issued at various times, with different dates on which the principal or any instalment of principal is payable, with different rates of interest, if any, or different methods by which rates of interest may be determined, with different dates on which such interest may be payable and with different Redemption Dates or Repayment Dates and may be denominated in different currencies or payable in different currencies. All Securities shall be subordinate and junior in right of payment to the obligations of the Company to holders of Senior Indebtedness and creditors in respect of General Obligations of the Company as provided in Article Fourteen. SECTION 3.02. Denominations. The Securities of each series shall be issuable in such form and denominations as shall be specified as contemplated by Section 3.01. In the absence of any specification with respect to the Securities of any series, the Registered Securities of each series shall be issuable only as Securities without coupons in denominations of $1,000 and any integral multiple thereof and the Bearer Securities of each series, if any, shall be issuable with coupons and in denominations of $5,000 and any integral multiple thereof. SECTION 3.03. Execution, Authentication, Delivery and Dating. The Securities shall be executed on behalf of the Company by its Chairman of the Board, its President, a Vice Chairman of the Board, its Chief Financial Officer or one of its Executive Vice Presidents and by its Secretary or one of its Assistant Secretaries. The signatures of any or all of these officers on the Securities may be manual or facsimile. Coupons shall bear the facsimile signature of the Company's Chairman of the Board, its President, a Vice Chairman of the Board, its Chief Financial Officer, one of its Executive Vice Presidents or the Treasurer. Securities and coupons bearing the manual or facsimile signatures of individuals who were at any time the proper officers of the Company shall bind the Company, notwithstanding that such individuals or any of them have ceased to hold such offices prior to the authentication and delivery of such Securities or did not hold such offices at the date of such Securities. At any time and from time to time after the execution and delivery of this Indenture, the Company may deliver Securities of any series, together with any coupons appertaining thereto, executed by the Company to the Trustee for authentication, together with a Company Order for the authentication and delivery of such Securities, and the Trustee shall, upon receipt of the Company Order, authenticate and deliver such Securities as in this Indenture provided and not otherwise; provided, however, that, in connection with its original issuance, no Bearer Page 25
Security shall be mailed or otherwise delivered to any location in the United States; and provided, further, that a Bearer Security may be delivered in connection with its original issuance only if the Person entitled to receive such Bearer Security shall have delivered to the Trustee, or such other Person as shall be specified in a temporary Global Security delivered pursuant to Section 3.04, a certificate in the form required by Section 3.11(i). If the Company shall establish pursuant to Section 3.01 that the Securities of a series are to be issued in whole or in part in the form of one or more Global Securities in registered or permanent bearer form, then the Company shall execute and the Trustee shall, in accordance with this Section and a Company Order for the authentication and delivery of such Global Securities with respect to such series, authenticate and deliver one or more Global Securities in permanent or temporary form that (i) shall represent and shall be denominated in an aggregate amount equal to the aggregate principal amount of the Outstanding Securities of such series to be represented by one or more Global Securities, (ii) shall be registered, if in registered form, in the name of the Depositary for such Global Security or Securities or the nominee of such Depositary and (iii) shall be delivered by the Trustee to such Depositary or pursuant to such Depositary's instructions. Each Depositary designated pursuant to Section 3.01 for a Global Security in registered form must, at the time of its designation and at all times while it serves as Depositary, be a clearing agency registered under the Securities Exchange Act of 1934, as amended, and any other applicable statute or regulation. In authenticating such Securities, and accepting the additional responsibilities under this Indenture in relation to such Securities, the Trustee shall be entitled to receive, and (subject to Section 8.01) shall be fully protected in relying upon, an Opinion of Counsel complying with Section 1.02 and stating that, (i) the form of such Securities and coupons, if any, has been established in conformity with the provisions of this Indenture; (ii) the terms of such Securities and coupons, if any, or the manner of determining such terms have been established in conformity with the provisions of this Indenture; (iii) that such Securities and coupons, when authenticated and delivered by the Trustee and issued by the Company in the manner and subject to any conditions specified in such Opinion of Counsel, will constitute valid and legally binding obligations of the Company, enforceable against the Company in accordance with their terms, subject to bankruptcy, insolvency, reorganization, moratorium and other laws of general applicability relating to or affecting the enforcement of creditors' rights and to general principles of equity; and (iv) such other matters as the Trustee may reasonably request. The Trustee shall not be required to authenticate such Securities if the issue thereof will adversely affect the Trustee's own rights, duties or immunities under the Securities and this Indenture or otherwise in a manner which is not reasonably acceptable to the Trustee. Notwithstanding the provisions of Section 3.01 and of this Section 3.03, if all Securities of a series are not to be originally issued at one time, it shall not be necessary to deliver the Board Resolution or Officers' Certificate otherwise required pursuant to Section 3.01 or the Company Order and Opinion of Counsel otherwise required pursuant to this Section 3.03 at or prior to the time of authentication of each Security of such series if such documents are delivered at or prior to the authentication upon original issuance of the first Security of such series to be issued and such documents reasonably contemplate the issuance of all Securities of such series; provided that any subsequent request by the Company to the Trustee to authenticate Securities of such series upon original issuance shall constitute a representation and warranty by the Company that as of the date of such request, the statements made in the Officers' Certificate or other certificates delivered pursuant to Sections 1.02 and 3.01 shall be true and correct as if made on such date. A Company Order, Officers' Certificate or Board Resolution or supplemental indenture delivered by the Company to the Trustee in the circumstances set forth in the preceding paragraph may provide that Securities Page 26
which are the subject thereof will be authenticated and delivered by the Trustee or its agent on original issue from time to time in the aggregate principal amount, if any, established for such series pursuant to such procedures acceptable to the Trustee as may be specified from time to time by Company Order upon the telephonic, electronic or written order of Persons designated in such Company Order, Officers' Certificate, supplemental indenture or Board Resolution and that such Persons are authorized to determine, consistent with such Company Order, Officers' Certificate, supplemental indenture or Board Resolution, such terms and conditions of said Securities as are specified in such Company Order, Officers' Certificate, supplemental indenture or Board Resolution. Each Registered Security shall be dated the date of its authentication; and unless otherwise specified as contemplated by Section 3.01, each Bearer Security and any temporary Global Security referred to in Section 3.04 shall be dated as of the date of original issuance of such Security. No Security or coupon appertaining thereto shall be entitled to any benefit under this Indenture or be valid or obligatory for any purpose, unless there appears on such Security a certificate of authentication substantially in the form provided for herein executed by the Trustee by manual signature, and such certificate upon any Security shall be conclusive evidence, and the only evidence, that such Security has been duly authenticated and delivered hereunder. Except as permitted by Section 3.06, the Trustee shall not authenticate and deliver any Bearer Security unless all appurtenant coupons for interest then matured have been detached and cancelled. Notwithstanding the foregoing, if any Security or portion thereof shall have been duly authenticated and delivered hereunder but never issued and sold by the Company, and the Company shall deliver such Security to the Trustee for cancellation as provided in Section 3.09 together with a written statement (which need not comply with Section 1.02 and need not be accompanied by an Opinion of Counsel) stating that such Security or portion thereof has never been issued and sold by the Company, for all purposes of this Indenture such Security shall be deemed never to have been authenticated and delivered hereunder and shall never be entitled to the benefits of this Indenture. SECTION 3.04. Temporary Securities. (a) Pending the preparation of definitive Securities of any series, the Company may execute, and upon Company Order and the receipt of the certifications and opinions required under Sections 3.01 and 3.03, the Trustee shall authenticate and deliver, temporary Securities which are printed, lithographed, typewritten, mimeographed or otherwise produced, in any authorized denominations, substantially of the tenor of the definitive Securities in lieu of which they are issued in registered form or, if authorized, in bearer form with one or more coupons or without coupons, and with such appropriate insertions, omissions, substitutions and other variations as the officers executing such Securities may determine, as evidenced by their execution of such Securities. In the case of any series which may be issuable as Bearer Securities, such temporary Securities may be in global form, representing such of the Outstanding Securities of such series as shall be specified therein. (b) Unless otherwise provided pursuant to Section 3.01: (i) Except in the case of temporary Securities in global form, each of which shall be exchanged in accordance with the provisions of the following paragraphs, if temporary Securities of any series are issued, the Company will cause definitive Securities of such series to be prepared without unreasonable delay. After the preparation of definitive Securities, the temporary Securities of such series shall be exchangeable for definitive Securities of such series upon surrender of the temporary Securities of such series at the office or agency of the Company in a Place of Payment for that series, without charge to the Holder. Upon surrender for cancellation of any one or more temporary Securities of any series (accompanied, if applicable, by all unmatured coupons and all matured coupons in default appertaining thereto), the Company shall execute and the Trustee shall authenticate and deliver in exchange therefor a like principal amount of definitive Securities of such series of authorized denominations; provided, however, that no definitive Bearer Security shall be delivered in exchange for a temporary Registered Security; and provided, further, that a definitive Bearer Security shall be delivered in exchange for a temporary Bearer Security only in compliance with the Page 27
conditions set forth in Section 3.03. Until so exchanged, the temporary Securities of any series shall in all respects be entitled to the same benefits under this Indenture as definitive Securities of such series. (ii) If temporary Securities of any series are issued in global form, any such temporary Global Security shall, unless otherwise provided in such temporary Global Security, be delivered to the London office of a depositary or common depositary (the "Common Depositary"), for the benefit of the operator of Euroclear and CEDEL S.A., for credit to the respective accounts of the beneficial owners of such Securities (or to such other accounts as they may direct). Upon receipt of written instructions (which need not comply with Section 1.02) signed on behalf of the Company by any Person authorized to give such instructions, the Trustee or any Authenticating Agent shall endorse such temporary Global Security to reflect the initial principal amount, or an increase in the principal amount, of Outstanding Securities represented thereby. Until such initial endorsement, such temporary Global Security shall not evidence any obligation of the Company. Such temporary Global Security shall at any time represent the aggregate principal amount of Outstanding Securities theretofore endorsed thereon as provided above, subject to reduction to reflect exchanges as described below. (iii) Unless otherwise specified in such temporary Global Security, and subject to the second proviso in the following paragraph, the interest of a beneficial owner of Securities of a series in a temporary Global Security shall be exchanged for definitive Securities (including a definitive global Bearer Security) of such series and of like tenor following the Global Exchange Date (as defined below) when the account holder instructs Euroclear or CEDEL S.A., as the case may be, to request such exchange on his behalf and delivers to Euroclear or CEDEL S.A., as the case may be, a certificate in the form required by Section 3.11(i), dated no earlier than 15 days prior to the Global Exchange Date, copies of which certificate shall be available from the offices of Euroclear and CEDEL S.A., the Trustee, any Authenticating Agent appointed for such series of Securities and each Paying Agent. Unless otherwise specified in such temporary Global Security, any such exchange shall be made free of charge to the beneficial owners of such temporary Global Security, except that a Person receiving definitive Securities must bear the cost of insurance, postage, transportation and the like in the event that such Person does not take delivery of such definitive Securities in person at the offices of Euroclear or CEDEL S.A. Definitive Securities in bearer form to be delivered in exchange for any portion of a temporary Global Security shall be delivered only outside the United States. (iv) Without unnecessary delay but in any event not later than the date specified in, or determined pursuant to the terms of, any such temporary Global Security as the "Global Exchange Date" (the "Global Exchange Date"), the Company shall deliver to the Trustee, or, if the Trustee appoints an Authenticating Agent pursuant to Section 8.14, to any such Authenticating Agent, definitive Securities in aggregate principal amount equal to the principal amount of such temporary Global Security, executed by the Company. Unless otherwise specified as contemplated by Section 3.01, such definitive Securities shall be in the form of Bearer Securities or Registered Securities, or any combination thereof, as may be specified by the Company, the Trustee or any such Authenticating Agent, as may be appropriate. On or after the Global Exchange Date, such temporary Global Security shall be surrendered by the Common Depositary to the Trustee or any such Authenticating Agent, as the Company's agent for such purpose, to be exchanged, in whole or from time to time in part, for definitive Securities without charge and the Trustee or any such Authenticating Agent shall authenticate and deliver, in exchange for each portion of such temporary Global Security, an equal aggregate principal amount of definitive Securities of the same series, of authorized denominations and of like tenor as the portion of such temporary Global Security to be exchanged, which, except as otherwise specified as contemplated by Section 3.01, shall be in the form of Bearer Securities or Registered Securities, or any combination thereof, provided, however, that, unless otherwise specified in such temporary Global Security, upon such presentation by the Common Depositary, such temporary Global Security is accompanied by a certificate dated the Global Exchange Date or a subsequent date and signed by Euroclear as to the portion of such temporary Global Security held for its account then to be exchanged and a certificate dated the Global Exchange Date or a subsequent date and signed by CEDEL S.A., as to the portion of such temporary Global Security held for its account then to be exchanged, each in the form required by Section 3.11(ii); and provided, further, that a definitive Bearer Security (including a definitive Page 28
global Bearer Security) shall be delivered in exchange for a portion of a temporary Global Security only in compliance with the conditions set forth in Section 3.03. (v) Upon any exchange of a portion of any such temporary Global Security, such temporary Global Security shall be endorsed by the Trustee or any such Authenticating Agent, as the case may be, to reflect the reduction of the principal amount evidenced thereby, whereupon its remaining principal amount shall be reduced for all purposes by the amount so exchanged. Until so exchanged in full, such temporary Global Security shall in all respects be entitled to the same benefits under this Indenture as definitive Securities of such series authenticated and delivered hereunder, except that, unless otherwise specified as contemplated by Section 3.01, interest payable on such temporary Global Security on an Interest Payment Date for Securities of such series occurring prior to the applicable Global Exchange Date shall be payable, without interest, to Euroclear and CEDEL S.A. on or after such Interest Payment Date upon delivery by Euroclear and CEDEL S.A. to the Trustee or the Paying Agent, as the case may be, of a certificate or certificates in the form required by Section 3.11(iii), for credit on or after such Interest Payment Date to the respective accounts of the Persons who are the beneficial owners of such temporary Global Security on such Interest Payment Date and who have each delivered to Euroclear or CEDEL S.A., as the case may be, a certificate in the form required by Section 3.11(iv). Any interest so received by Euroclear and Cedel S.A. and not paid as herein provided prior to the Global Exchange Date shall be returned to the Trustee or Paying Agent, as the case may be, which, upon expiration of two years after such Interest Payment Date, shall repay such interest on Company Request in accordance with Section 5.03. SECTION 3.05. Registration, Registration of Transfer and Exchange. With respect to Registered Securities, the Company shall keep or cause to be kept a register (sometimes referred to as the "Security Register") in which, subject to such reasonable regulations as it may prescribe, the Company shall provide for the registration of Registered Securities and the registration of transfers of Registered Securities and the Company shall appoint a "Security Registrar", and may appoint any "Co-Security Registrar", as may be appropriate, to keep the Security Register. Such Security Register shall be in written form or in any other form capable of being converted into written form within a reasonable time. At all reasonable times the information contained in such Security Register shall be available for inspection by the Trustee at the office of the Security Registrar. In the event that any Registered Securities issued hereunder have The City of New York as a Place of Payment, the Company shall appoint either a Security Registrar or Co-Security Registrar located in The City of New York. Upon surrender for registration of transfer of any Registered Security of any series at the office or agency of the Company maintained pursuant to Section 5.02 for such purpose in a Place of Payment for such series, the Company shall execute, and the Trustee shall authenticate and deliver, in the name of the designated transferee or transferees, one or more new Registered Securities of such series of any authorized denominations and of a like aggregate principal amount, tenor and Stated Maturity. At the option of the Holder, Registered Securities of any series may be exchanged for other Registered Securities of such series, of any authorized denominations and of like aggregate principal amount, tenor and Stated Maturity, upon surrender of the Securities to be exchanged at such office or agency. Whenever any Securities are so surrendered for exchange, the Company shall execute, and the Trustee shall authenticate and deliver, the Securities which the Holder making the exchange is entitled to receive. Registered Securities may not be exchanged for Bearer Securities. At the option of the Holder, Bearer Securities of any series may be exchanged for Registered Securities of the same series of any authorized denominations and of a like aggregate principal amount and tenor, upon surrender of the Bearer Securities to be exchanged at any such office or agency, with all unmatured coupons and all matured coupons in default thereto appertaining. If the Holder of a Bearer Security is unable to produce any such unmatured coupon or coupons or matured coupon or coupons in default, such exchange may be effected if Page 29
the Bearer Securities are accompanied by payment in funds acceptable to the Company in an amount equal to the face amount of such missing coupon or coupons, or the surrender of such missing coupon or coupons may be waived by the Company and the Trustee if there be furnished to them such security or indemnity as they may require to save each of them and any Paying Agent harmless. If thereafter the Holder of such Security shall surrender to any Paying Agent any such missing coupon in respect of which such a payment shall have been made, such Holder shall be entitled to receive the amount of such payment from the Company; provided, however, that interest represented by coupons shall be payable only upon presentation and surrender of those coupons at an office or agency of a Paying Agent, maintained pursuant to Section 5.02 for such purpose, located outside the United States. Notwithstanding the foregoing, in case a Bearer Security of any series is surrendered at any such office or agency in exchange for a Registered Security of the same series and like tenor after the close of business at such office or agency on (i) any Regular Record Date and before the opening of business at such office or agency on the relevant Interest Payment Date, or (ii) any Special Record Date and before the opening of business at such office or agency on the related date for payment of Defaulted Interest, such Bearer Security shall be surrendered without the coupon relating to such Interest Payment Date or proposed date for payment, as the case may be. Notwithstanding any other provision of this Section, unless and until it is exchanged in whole or in part for individual Securities represented thereby, a Global Security representing all or a portion of the Securities of a series may not be transferred except as a whole by the Depositary for such series to a nominee of such Depositary or by a nominee of such Depositary to such Depositary or another nominee of such Depositary or by such Depositary or any such nominee to a successor Depositary for such series or a nominee of such successor Depositary. Whenever any Securities are so surrendered for exchange, the Company shall execute, and the Trustee shall authenticate and deliver, the Securities which the Holder making the exchange is entitled to receive. If at any time the Depositary for the Securities of a series notifies the Company that it is unwilling or unable to continue as Depositary for the Securities of such series or if at any time the Depositary for the Securities of such series shall no longer be eligible under Section 3.03, the Company shall appoint a successor Depositary with respect to the Securities of such series. If a successor Depositary for the Securities of such series is not appointed by the Company within 90 days after the Company receives such notice or becomes aware of such ineligibility, the Company's election pursuant to Section 3.01(vi) shall no longer be effective with respect to the Securities of such series and the Company will execute, and the Trustee, upon receipt of a Company Order for the authentication and delivery of definitive Securities of such series, will authenticate and deliver Securities of such series of like tenor and terms in definitive form in an aggregate principal amount equal to the principal amount of the Global Security or Securities representing such series in exchange for such Global Security or Securities. The Company may at any time and in its sole discretion determine that the Securities of any series issued in the form of one or more Global Securities shall no longer be represented by such Global Security or Securities. In such event, the Company will execute, and the Trustee, upon receipt of a Company Order for the authentication and delivery of definitive Securities of such series, will deliver, Securities of such series of like tenor and terms in definitive form in an aggregate principal amount equal to the principal amount of the Global Security or Securities representing such series in exchange for such Global Security or Securities. If specified by the Company pursuant to Section 3.01 with respect to a series of Securities, the Depositary for such series of Securities may surrender a Global Security for such series of Securities in exchange in whole or in part for Securities of such series of like tenor and terms and in definitive form on such terms as are acceptable to the Company, the Trustee and such Depositary. Thereupon, the Company shall execute, and the Trustee upon receipt of a Company Order for the authentication and delivery of definitive Securities of such series, shall authenticate and deliver, without service charge: (a) to the Depositary or to each Person specified by such Depositary a new Security or Securities of the same series, of like tenor and terms and of any authorized denomination as requested by such Person in Page 30
aggregate principal amount equal to and in exchange for such Person's beneficial interest in the Global Security; and (b) to such Depositary a new Global Security of like tenor and terms and in an authorized denomination equal to the difference, if any, between the principal amount of the surrendered Global Security and the aggregate principal amount of Securities delivered to Holders thereof. In any exchange provided for in any of the preceding three paragraphs, the Company will execute and the Trustee, pursuant to a Company Order, will authenticate and deliver, Securities (a) in definitive registered form in authorized denominations, if the Securities of such series are issuable as Registered Securities, (b) in definitive bearer form in authorized denominations, with coupons attached, if the Securities of such series are issuable as Bearer Securities or (c) as either Registered or Bearer Securities, if the Securities of such series are issuable in either form; provided, however, that no definitive Bearer Security shall be delivered in exchange for a temporary Global Security other than in accordance with the provisions of Sections 3.03 and 3.04. Upon the exchange of Global Securities for Securities in definitive form, such Global Securities shall be cancelled by the Trustee. Registered Securities issued in exchange for a Global Security pursuant to this Section 3.05 shall be registered in such names and in such authorized denominations, and delivered to such addresses, as the Depositary for such Global Security, pursuant to instructions from its direct or indirect participants or otherwise, shall instruct the Trustee in writing. The Trustee shall deliver such Registered Securities to the Persons in whose names such Securities are so registered or to the Depositary. The Trustee shall deliver Bearer Securities issued in exchange for a Global Security pursuant to this Section 3.05 to the Depositary or to the Persons at such addresses, and in such authorized denominations, as the Depositary for such Global Security, pursuant to instructions from its direct or indirect participants or otherwise, shall instruct the Trustee in writing; provided, however, that no definitive Bearer Security shall be delivered in exchange for a temporary Global Security other than in accordance with the provisions of Sections 3.03 and 3.04. All Securities issued upon any registration of transfer or exchange of Securities shall be the valid obligations of the Company, evidencing the same debt, and entitled to the same benefits under this Indenture, as the Securities surrendered upon such registration of transfer or exchange. Every Security presented or surrendered for registration of transfer or exchange shall (if so required by the Company or the Security Registrar) be duly endorsed, or be accompanied by a written instrument of transfer in form satisfactory to the Company and the Security Registrar duly executed, by the Holder thereof or his attorney duly authorized in writing. Unless otherwise provided in the Securities to be registered for transfer or exchanged, no service charge shall be made for any registration of transfer or exchange of Securities, but the Company may (unless otherwise provided in such Securities) require payment of a sum sufficient to cover any tax or other governmental charge that may be imposed in connection with any registration of transfer or exchange of Securities, other than exchanges expressly provided in this Indenture to be made at the Company's own expense or without expense or without charge to Holders. Neither the Company, the Security Registrar nor any Co-Security Registrar shall be required (i) to issue, register the transfer of or exchange any Securities of any series during a period beginning at the opening of business 15 days before the day of selection of Securities of such series to be redeemed and ending at the close of business on (A) if Securities of the series are issuable only as Registered Securities, the day of the mailing of the relevant notice of redemption of Registered Securities of such series so selected for redemption or (B) if Securities of the series are issuable as Bearer Securities, the day of the first publication of the relevant notice of redemption or, if Securities of the series are also issuable as Registered Securities and there is no publication, the mailing of the relevant notice of redemption, or (ii) to register the transfer or exchange of any Securities or portions thereof so selected for redemption. Page 31
Notwithstanding anything herein to the contrary, the exchange of Bearer Securities into Registered Securities shall be subject to applicable laws and regulations in effect at the time of exchange; none of the Company, the Trustee nor the Security Registrar shall exchange any Bearer Securities into Registered Securities if it has received an Opinion of Counsel that as a result of such exchanges the Company would suffer adverse consequences under the United States federal income tax laws and regulations then in effect and the Company has delivered to the Trustee a Company Order directing the Trustee not to make such exchanges unless and until the Trustee receives a subsequent Company Order to the contrary. The Company shall deliver copies of such Company Orders to the Security Registrar. SECTION 3.06. Mutilated, Destroyed, Lost and Stolen Securities. If (i) any mutilated Security or Security with a mutilated coupon is surrendered to the Trustee or the Security Registrar, or if the Company, the Trustee and the Security Registrar receive evidence to their satisfaction of the destruction, loss or theft of any Security or coupon and (ii) there is delivered to the Company, the Trustee and the Security Registrar such security or indemnity as may be required by them to save each of them harmless, then, in the absence of notice to the Company, the Trustee or the Security Registrar that such Security has been acquired by a bona fide purchaser, the Company shall execute and upon its request the Trustee shall authenticate and deliver, in lieu of any such mutilated, destroyed, lost or stolen Security or in exchange for the Security to which a destroyed, lost or stolen coupon appertains (with all appurtenant coupons not destroyed, lost or stolen), a new Security of the same series and Stated Maturity and of like tenor and principal amount, bearing a number not contemporaneously outstanding and, if applicable, with coupons corresponding to the coupons appertaining thereto; provided, however, that any new Bearer Security will be delivered only in compliance with the conditions set forth in Section 3.05. In case any such mutilated, destroyed, lost or stolen Security or coupon has become or is about to become due and payable, the Company in its discretion may, instead of issuing a new Security, pay such Security; provided, however, that payment of principal of (and premium, if any) and any interest on Bearer Securities shall be payable only at an office or agency located outside the United States, and, in the case of interest, unless otherwise specified as contemplated by Section 3.01, only upon presentation and surrender of the coupons appertaining thereto. Upon the issuance of any new Security under this Section, the Company may require the payment of a sum sufficient to cover any tax or other governmental charge that may be imposed in relation thereto and any other expenses (including the fees and expenses of the Trustee) connected therewith. Every new Security of any series, with its coupons, if any, issued pursuant to this Section in lieu of any destroyed, lost or stolen Security, or in exchange for a Security with a destroyed, lost or stolen coupon, shall constitute an original additional contractual obligation of the Company, whether or not the destroyed, lost or stolen Security and its coupons, if any, or the destroyed, lost or stolen coupon shall be at any time enforceable by anyone, and shall be entitled to all the benefits of this Indenture equally and proportionately with any and all other Securities of the same series and their coupons, if any, duly issued hereunder. The provisions of this Section are exclusive and shall preclude (to the extent lawful) all other rights and remedies with respect to the replacement or payment of mutilated, destroyed, lost or stolen Securities or coupons. SECTION 3.07. Payment of Interest; Interest Rights Preserved. Unless otherwise provided as contemplated by Section 3.01, interest on any Registered Security which is payable, and is punctually paid or duly provided for, on any Interest Payment Date shall unless otherwise provided in such Security be paid to the Person in whose name that Security (or one or more Predecessor Securities) is registered at the close of business on the Regular Record Date for such interest. Unless otherwise specified as contemplated by Section 3.01, in case a Bearer Security of any series is surrendered in exchange for a Registered Security of such series after the close of business (at an office or agency referred to in Section 3.05) Page 32
on any Regular Record Date and before the opening of business (at such office or agency) on the next succeeding Interest Payment Date, such Bearer Security shall be surrendered without the coupon relating to such Interest Payment Date and interest will not be payable on such Interest Payment Date in respect of the Registered Security issued in exchange for such Bearer Security, but will be payable only to the Holder of such coupon when due in accordance with the provisions of this Indenture. At the option of the Company, payment of interest on any Registered Security may be made by check in the currency designated for such payment pursuant to the terms of such Registered Security mailed to the address of the Person entitled thereto as such address shall appear in the Security Register or by wire transfer to an account in such currency designated by such Person in writing not later than ten days prior to the date of such payment. Any interest on any Registered Security which is payable, but is not punctually paid or duly provided for, on any Interest Payment Date (herein called "Defaulted Interest") shall forthwith cease to be payable to the Holder on the relevant Regular Record Date by virtue of his having been such Holder, and such Defaulted Interest may be paid by the Company, at its election in each case, as provided in clause (i) or clause (ii) below. (i) The Company may elect to make payments of any Defaulted Interest to the Persons in whose names any such Registered Securities (or their respective Predecessor Securities) are registered at the close of business on a Special Record Date for the payment of such Defaulted Interest, which shall be fixed in the following manner. The Company shall notify the Trustee in writing of the amount of Defaulted Interest proposed to be paid on each Registered Security and the date of the proposed payment, and at the same time the Company shall deposit with the Trustee an amount of money equal to the aggregate amount proposed to be paid in respect of such Defaulted Interest or shall make arrangements satisfactory to the Trustee for such deposit prior to the date of the proposed payment, such money when deposited to be held in trust for the benefit of the Persons entitled to such Defaulted Interest as in this clause provided. Thereupon the Trustee shall fix a Special Record Date for the payment of such Defaulted Interest which shall be not more than 15 nor less than 10 days prior to the date of the proposed payment and not less than 10 days after the receipt by the Trustee of the notice of the proposed payment. The Trustee shall promptly notify the Company of such Special Record Date and, in the name and at the expense of the Company, shall cause notice of the proposed payment of such Defaulted Interest and the Special Record Date therefor to be mailed, first-class, postage prepaid, to each Holder at his address as it appears in the Security Register, not less than 10 days prior to such Special Record Date. Notice of the proposed payment of such Defaulted Interest and the Special Record Date therefor having been mailed as aforesaid, such Defaulted Interest shall be paid to the Persons in whose names such Registered Securities (or their respective Predecessor Securities) are registered on such Special Record Date and shall no longer be payable pursuant to the following clause (ii). In case a Bearer Security of any series is surrendered at the office or agency in a Place of Payment for such series in exchange for a Registered Security of such series after the close of business at such office or agency on any Special Record Date and before the opening of business at such office or agency on the related proposed date of payment of Defaulted Interest, such Bearer Security shall be surrendered without the coupon relating to such proposed date for payment and Defaulted Interest will not be payable on such proposed date for payment in respect of the Registered Security issued in exchange for such Bearer Security, but will be payable only to the Holder of such coupon when due in accordance with the provisions of this Indenture. (ii) The Company may make payment of any Defaulted Interest in any other lawful manner not inconsistent with the requirements of any securities exchange on which the Securities with respect to which there exists such default may be listed, and upon such notice as may be required by such exchange, if, after notice given by the Company to the Trustee of the proposed payment pursuant to this clause, such payment shall be deemed practicable by the Trustee. Subject to the foregoing provisions of this Section, each Security delivered under this Indenture upon registration of transfer of, or in exchange for, or in lieu of, any other Security shall carry the rights to interest accrued and unpaid, and to accrue, which were carried by such other Security. Page 33
Subject to the limitations set forth in Section 5.02, the Holder of any coupon appertaining to a Bearer Security shall be entitled to receive the interest payable on such coupon upon presentation and surrender of such coupon on or after the Interest Payment Date of such coupon at an office or agency maintained for such purpose pursuant to Section 5.02. SECTION 3.08. Persons Deemed Owners. Title to any Bearer Security, any coupons appertaining thereto and any temporary Global Security shall pass by delivery. Prior to due presentment for registration of transfer of any Registered Security, the Company, the Trustee and any agent of the Company or the Trustee may treat the Person in whose name such Security is registered as the owner of such Security for the purpose of receiving payment of principal of, premium, if any, and (subject to Section 3.07) interest on such Security, and for all purposes whatsoever, whether or not such Security be overdue, and neither the Company, the Trustee nor any agent of the Company or the Trustee shall be affected by notice to the contrary. The Company, the Trustee and any agent of the Company or the Trustee may treat the bearer of any Bearer Security and the bearer of any coupon as the absolute owner of such Security or coupon for the purpose of receiving payment thereof or on account thereof and for all other purposes whatsoever, whether or not such Security or coupon be overdue, and neither the Company, the Trustee nor any agent of the Company or the Trustee shall be affected by notice to the contrary. None of the Company, the Trustee, any Paying Agent, any Authenticating Agent or the Security Registrar will have the responsibility or liability for any aspect of the records relating to or payments made on account of beneficial ownership interest of a Global Security or for maintaining, supervising or reviewing any records relating to such beneficial ownership interest, and they shall be fully protected in acting or refraining from acting on any such information provided by the Depositary. SECTION 3.09. Cancellation. Unless otherwise provided with respect to a series of Securities, all Securities and coupons surrendered for payment, registration of transfer, exchange, repayment or redemption shall, if surrendered to any Person other than the Trustee, be delivered to the Trustee. All Securities so delivered or surrendered directly to the Trustee for any such purpose shall be promptly cancelled by it. The Company may at any time deliver to the Trustee for cancellation any Securities previously authenticated and delivered hereunder which the Company may have acquired in any manner whatsoever, and all Securities so delivered shall be promptly cancelled by the Trustee. No Securities shall be authenticated in lieu of or in exchange for any Securities cancelled as provided in this Section, except as expressly permitted by this Indenture or such Securities. All cancelled Securities or coupons held by the Trustee shall be destroyed by the Trustee and the Trustee shall deliver a certificate of such destruction to the Company. SECTION 3.10. Computation of Interest. Interest on the Securities of each series shall be computed as shall be specified as contemplated by Section 3.01. SECTION 3.11. Forms of Certification. Unless otherwise provided pursuant to Section 3.01: (i) Whenever any provision of this Indenture or the forms of Securities contemplate that certification be given by a Person entitled to receive a Bearer Security, such certification shall be provided substantially in the form of Exhibit A hereto, with only such changes as shall be approved by the Company. Page 34
(ii) Whenever any provision of this Indenture or the forms of Securities contemplate that certification be given by Euroclear and CEDEL S.A. in connection with the exchange of a portion of a temporary Global Security, such certification shall be provided substantially in the form of Exhibit B hereto, with only such changes as shall be approved by the Company. (iii) Whenever any provision of the Indenture or the forms of Securities contemplate that certification be given by Euroclear and CEDEL S.A. in connection with payment of interest with respect to a temporary Global Security prior to the related Global Exchange Date, such certification shall be provided substantially in the form of Exhibit C hereto, with only such changes as shall be approved by the Company. (iv) Whenever any provision of the Indenture or the forms of Securities contemplate that certification be given by a beneficial owner of a portion of a temporary Global Security in connection with payment of interest with respect to a temporary Global Security prior to the related Global Exchange Date, such certification shall be provided substantially in the form of Exhibit D hereto, with only such changes as shall be approved by the Company. SECTION 3.12. Judgments The Company may provide, pursuant to Section 3.01, for the Securities of any series that, to the fullest extent possible under applicable law and except as may otherwise be specified as contemplated in Section 3.01, (a) the obligation, if any, of the Company to pay the principal of (and premium, if any) and interest of the Securities of any series and any appurtenant coupons in a Foreign Currency, composite currency or Dollars (the "Designated Currency") as may be specified pursuant to Section 3.01 is of the essence and agrees that judgments in respect of such Securities shall be given in the Designated Currency; (b) the obligation of the Company to make payments in the Designated Currency of the principal of (and premium, if any) and interest on such Securities and any appurtenant coupons shall, notwithstanding any payment in any other currency (whether pursuant to a judgment or otherwise), be discharged only to the extent of the amount in the Designated Currency that the Holder receiving such payment may, in accordance with normal banking procedures, purchase with the sum paid in such other currency (after any premium and cost of exchange) in the country of issue of the Designated Currency in the case of Foreign Currency or Dollars or in the international banking community in the case of a composite currency on the Business Day immediately following the day on which such Holder receives such payment; (c) if the amount in the Designated Currency that may be so purchased for any reason falls short of the amount originally due, the Company shall pay such additional amounts as may be necessary to compensate for such shortfall; and (d) any obligation of the Company not discharged by such payment shall be due as a separate and independent obligation and, until discharged as provided herein, shall continue in full force and effect. ARTICLE FOUR Redemption of Securities SECTION 4.01. Applicability of Article. Securities of any series which are redeemable before their Stated Maturity shall be redeemable in accordance with their terms and, except as otherwise specified as contemplated by Section 3.01 for Securities of any series, in accordance with this Article. SECTION 4.02. Election to Redeem; Notice to Trustee. The election of the Company to redeem any Securities redeemable at the option of the Company shall be evidenced by an Officers' Certificate. In case of any redemption at the election of the Company of less than all the Securities of any series, the Company shall, at least 60 days prior to the Redemption Date fixed by the Company (unless a shorter notice shall be satisfactory to the Trustee), notify the Trustee and the Security Registrar of such Redemption Date and of the principal amount of Securities of such series to be redeemed. In the case of any redemption of Securities (i) prior to the expiration of any restriction on such redemption provided Page 35
in the terms of such Securities or elsewhere in this Indenture, or (ii) pursuant to an election of the Company which is subject to a condition specified in the terms of such Securities, the Company shall furnish the Trustee with an Officers' Certificate evidencing compliance with such restriction or condition. SECTION 4.03. Selection by Security Registrar of Securities to be Redeemed. If less than all the Securities of any series with the same terms are to be redeemed, the particular Securities to be redeemed shall be selected not more than 60 days prior to the Redemption Date by the Security Registrar from the Outstanding Securities of such series having such terms not previously called for redemption, by such method as the Security Registrar shall deem fair and appropriate and which may provide for the selection for redemption of portions of the principal amount of Securities of such series of a denomination equal to or larger than the minimum authorized denomination for Securities of such series. Unless otherwise provided by the terms of the Securities of any series so selected for partial redemption, the portions of the principal of Securities of such series so selected for partial redemption shall be, in the case of Registered Securities, equal to $1,000 or an integral multiple thereof or, in the case of Bearer Securities, equal to $5,000 or an integral multiple thereof, and the principal amount of any such Security which remains outstanding shall not be less than the minimum authorized denomination for Securities of such series. The Security Registrar shall promptly notify the Company, the Trustee and the Co-Security Registrar, if any, in writing of the Securities selected for redemption and, in the case of any Security selected for partial redemption, the principal amount thereof to be redeemed. For all purposes of this Indenture, unless the context otherwise requires, all provisions relating to the redemption of Securities shall relate, in the case of any Security redeemed or to be redeemed only in part, to the portion of the principal of such Security which has been or is to be redeemed. SECTION 4.04. Notice of Redemption. Notice of redemption shall be given in the manner provided in Section 1.06, not less than 30 nor more than 60 days prior to the Redemption Date, to each Holder of Securities to be redeemed. All notices of redemption shall state: (i) the Redemption Date, (ii) the Redemption Price, (iii) if less than all Outstanding Securities of any series having the same terms are to be redeemed, the identification (and, in the case of partial redemption, the respective principal amounts) of the particular Securities to be redeemed, (iv) that on the Redemption Date the Redemption Price will become due and payable upon each such Security to be redeemed, and that interest, if any, thereon shall cease to accrue on and after said date, (v) the place or places where such Securities, together in the case of Bearer Securities with all remaining coupons appertaining thereto, if any, maturing after the Redemption Date, are to be surrendered for payment of the Redemption Price, (vi) that the redemption is for a sinking fund, if such is the case, and (vii) the CUSIP number or the Euroclear or the CEDEL reference number (or any other number used by a Depositary to identify such Securities), if any, of the Securities to be redeemed. A notice of redemption published as contemplated by Section 1.06 need not identify particular Registered Securities to be redeemed. Notice of redemption of Securities to be redeemed at the election of the Company shall be given by the Company or, on Company Request, by the Trustee in the name and at the expense of the Company. Page 36
SECTION 4.05. Deposit of Redemption Price. At or prior to the opening of business on any Redemption Date, the Company shall deposit or cause to be deposited with the Trustee or with a Paying Agent (or, if the Company is acting as its own Paying Agent, segregate and hold in trust as provided in Section 5.03) an amount of money sufficient to pay the Redemption Price of all the Securities which are to be redeemed on that date; provided, however, that deposits with respect to Bearer Securities shall be made with a Paying Agent or Paying Agents located outside the United States except as otherwise provided in Section 5.02, unless otherwise specified as contemplated by Section 3.01. SECTION 4.06. Securities Payable on Redemption Date. Notice of redemption having been given as aforesaid, the Securities so to be redeemed shall, on the Redemption Date, become due and payable at the Redemption Price therein specified and from and after such date (unless the Company shall default in the payment of the Redemption Price) such Securities shall cease to bear interest and the coupons for such interest appertaining to any Bearer Securities so to be redeemed, except to the extent provided below, shall be void. Upon surrender of any such Securities for redemption in accordance with said notice, such Securities shall be paid by the Company at the Redemption Price; provided, however, that instalments of interest on Bearer Securities whose Stated Maturity is on or prior to the Redemption Date shall be payable only at an office or agency located outside the United States and, unless otherwise specified as contemplated by Section 3.01, only upon presentation and surrender of coupons for such interest. Instalments of interest on Registered Securities whose Stated Maturity is on or prior to the Redemption Date shall be payable to the Holders of such Securities, or one or more Predecessor Securities, registered as such on the close of business on the relevant Regular Record Dates according to their terms and the provisions of Section 3.07. If any Bearer Security surrendered for redemption shall not be accompanied by all appurtenant coupons maturing after the Redemption Date, such Security may be paid after deducting from the Redemption Price an amount equal to the face amount of all such missing coupons, or the surrender of such missing coupon or coupons may be waived by the Company and the Trustee if there be furnished to them such security or indemnity as they may require to save each of them and any Paying Agent harmless. If thereafter the Holder of such Security shall surrender to the Trustee or any Paying Agent any such missing coupon in respect of which a deduction shall have been made from the Redemption Price, such Holder shall be entitled to receive the amount so deducted; provided, however, that interest represented by coupons shall be payable only at an office or agency located outside the United States and, unless otherwise specified as contemplated by Section 3.01, only upon presentation and surrender of those coupons. If any Security called for redemption shall not be paid upon surrender thereof for redemption, the principal shall, until paid, bear interest from the Redemption Date at the rate borne by such Security, or as otherwise provided in such Security. SECTION 4.07. Securities Redeemed in Part. Any Security which is to be redeemed only in part shall be surrendered at the office or agency of the Company in a Place of Payment therefor (with, if the Company or the Security Registrar so requires, due endorsement by, or a written instrument of transfer in form satisfactory to the Company and the Security Registrar duly executed by, the Holder of such Security or his attorney duly authorized in writing), and the Company shall execute, and the Trustee shall authenticate and deliver to the Holder of such Security without service charge, a new Security or Securities of the same series and Stated Maturity, containing identical terms and conditions, of any authorized denominations as requested by such Holder, in aggregate principal amount equal to and in exchange for the unredeemed portion of the principal of the Security so surrendered. SECTION 4.08. Redemption Suspended During Event of Default. The Trustee shall not redeem any Securities (unless all Securities then Outstanding are to be redeemed) or commence the giving of any notice of redemption of Securities during the continuance of any Event of Default Page 37
known to the Trustee, except that where the giving of notice of redemption of any Securities shall theretofore have been made, the Trustee shall, subject to the provisions of Section 14.04, redeem such Securities, provided funds are deposited with it for such purpose. Subject to the rights of the holders of Senior Indebtedness and creditors in respect of General Obligations, except as aforesaid, any moneys theretofore or thereafter received by the Trustee shall, during the continuance of such Event of Default, be held in trust for the benefit of the Holders and applied in the manner set forth in Section 7.06; provided, however, that in case such Event of Default shall have been waived as provided herein or otherwise cured, such moneys shall thereafter be held and applied in accordance with the provisions of this Article. ARTICLE FIVE COVENANTS SECTION 5.01. Payment of Principal, Premium and Interest. The Company covenants and agrees for the benefit of each series of Securities that it will duly and punctually pay the principal of, premium, if any, and interest on the Securities of such series in accordance with the terms of the Securities of such series, any coupons appertaining thereto and this Indenture. Unless otherwise specified as contemplated by Section 3.01 with respect to any series of Securities, any interest due on Bearer Securities on or before Maturity shall be payable only outside the United States upon presentation and surrender of the several coupons for such interest instalments as are evidenced thereby as they severally mature. SECTION 5.02. Maintenance of Office or Agency. If Securities of a series are issuable only as Registered Securities, the Company will maintain in each Place of Payment for any series of Securities an office or agency where Securities of that series may be presented or surrendered for payment, where Securities of that series may be surrendered for registration of transfer or exchange and where notices and demands to or upon the Company in respect of the Securities of that series and this Indenture may be served. The Company will give prompt written notice to the Trustee of the location, and of any change in the location, of such office or agency. If Securities of a series may be issuable as Bearer Securities, the Company will maintain (A) in the Borough of Manhattan, The City of New York an office or agency where any Registered Securities of that series may be presented or surrendered for payment, where any Registered Securities of that series may be surrendered for registration of transfer, where Securities of that series may be surrendered for exchange and where notices and demands to or upon the Company in respect of the Securities of that series and this Indenture may be served, (B) subject to any laws or regulations applicable thereto, in a Place of Payment for that series which is located outside the United States, an office or agency where Securities of that series and related coupons may be presented and surrendered for payment (including payment of any additional amounts payable on Securities of that series pursuant to Section 5.04); provided, however, that if the Securities of that series are listed on The International Stock Exchange of the United Kingdom and the Republic of Ireland Limited or the Luxembourg Stock Exchange or any other stock exchange located outside the United States and such stock exchange shall so require, the Company will maintain a Paying Agent for the Securities of that series in London or Luxembourg or any other required city located outside the United States, as the case may be, so long as the Securities of that series are listed on such exchange, and (C) subject to any laws or regulations applicable thereto, in a Place of Payment for such series located outside the United States an office or agency where any Registered Securities of that series may be surrendered for registration of transfer, where Securities of that series may be surrendered for exchange and where notices and demands to or upon the Company in respect of the Securities of that series and this Indenture may be served. The Company will give prompt written notice to the Trustee of the location, and any change in the location, of any such office or agency. If at any time the Company shall fail to maintain any such required office or agency in respect of any series of Securities or shall fail to furnish the Trustee with the address thereof, such presentations, and surrenders of Securities of that series may be made and notices and demands may be made or served at the Principal Corporate Trust Office of the Trustee, except that Bearer Securities of that series and the related coupons may be presented and surrendered for payment (including payment of any additional amounts Page 38
payable on Bearer Securities of that series pursuant to Section 5.04) at the place specified for the purpose as contemplated by Section 3.01, and the Company hereby appoints the Trustee as its agent to receive such respective presentations, surrenders, notices and demands. Except as otherwise provided in the form of Bearer Security of any particular series pursuant to the provisions of this Indenture, no payment of principal, premium or interest on Bearer Securities shall be made at any office or agency of the Company in the United States or by check mailed to any address in the United States or by transfer to an account maintained with a bank located in the United States; provided, however, payment of principal of and any premium and interest denominated in Dollars (including additional amounts payable in respect thereof) on any Bearer Security may be made at an office or agency of, and designated by, the Company located in the United States if (but only if) payment of the full amount of such principal, premium, interest or additional amounts in Dollars at all offices outside the United States maintained for the purpose by the Company in accordance with this Indenture is illegal or effectively precluded by exchange controls or similar restrictions and the Trustee receives an Opinion of Counsel that such payment within the United States is legal. Unless otherwise provided as contemplated by Section 3.01 with respect to any series of Securities, at the option of the Holder of any Bearer Security or related coupon, payment may be made by check in the currency designated for such payment pursuant to the terms of such Bearer Security presented or mailed to an address outside the United States or by transfer to an account in such currency maintained by the payee with a bank located outside the United States. The Company may also from time to time designate one or more other offices or agencies where the Securities of one or more series may be presented or surrendered for any or all of such purposes specified above in this Section and may constitute and appoint one or more Paying Agents for the payment of such Securities, in one or more other cities, and may from time to time rescind such designations and appointments; provided, however, that no such designation, appointment or rescission shall in any manner relieve the Company of its obligation to maintain an office or agency in each Place of Payment for Securities of any series for such purposes. The Company will give prompt written notice to the Trustee of any such designation or rescission and of any change in the location of any such other office or agency. Unless and until the Company rescinds one or more such appointments, the Company hereby appoints: (i) The Chase Manhattan Bank (National Association), as its Paying Agent in The City of New York with respect to all series of Securities having a Place of Payment in The City of New York and (ii) the Bank at its principal office as its Paying Agent in the City of Chicago with respect to all series of Securities having a Place of Payment in the City of Chicago. Section 5.03. Money for Security Payments to Be Held in Trust. If the Company shall at any time act as its own Paying Agent for any series of Securities, it will, on or before each due date of the principal of, premium, if any, or interest on any of the Securities of such series and any appurtenant coupons, segregate and hold in trust for the benefit of the Persons entitled thereto a sum sufficient to pay the principal, premium or interest so becoming due until such sums shall be paid to such Persons or otherwise disposed of as herein provided, and will promptly notify the Trustee of its action or failure so to act. Whenever the Company shall have one or more Paying Agents for any series of Securities, it will, at or prior to the opening of business on each due date of the principal of, premium, if any, or interest on any Securities of such series and any appurtenant coupons, deposit with a Paying Agent a sum sufficient to pay the principal, premium or interest so becoming due, such sum to be held in trust for the benefit of the Persons entitled to such principal, premium or interest, and (unless such Paying Agent is the Trustee) the Company will promptly notify the Trustee of its action or failure so to act. The Company will cause each Paying Agent other than the Trustee for any series of Securities to execute and deliver to the Trustee an instrument in which such Paying Agent shall agree with the Trustee subject to the provisions of this Section, that such Paying Agent will Page 39
(i) hold all sums held by it for the payment of principal of, premium, if any, or interest on Securities of such series and any appurtenant coupons in trust for the benefit of the Persons entitled thereto until such sums shall be paid to such Persons or otherwise disposed of as herein provided; (ii) give the Trustee notice of any default by the Company (or any other obligor upon the Securities of such series) in the making of any payment of principal, premium or interest on the Securities of such series or any appurtenant coupons; and (iii) at any time during the continuance of any such default, upon the written request of the Trustee, forthwith pay to the Trustee all sums so held in trust by such Paying Agent. The Company may at any time, for the purpose of obtaining the satisfaction and discharge of this Indenture or for any other purpose, pay, or by Company Order direct any Paying Agent to pay, to the Trustee all sums held in trust by the Company or such Paying Agent, such sums to be held by the Trustee upon the same trusts as those upon which such sums were held by the Company or such Paying Agent; and, upon such payments by any Paying Agent to the Trustee, such Paying Agent shall be released from all further liability with respect to such money. Any money deposited with the Trustee or any Paying Agent, or then held by the Company, in trust for the payment of the principal of, premium, if any, or interest on any Security of any series or any appurtenant coupons and remaining unclaimed for two years after such principal, premium or interest has become due and payable shall be paid to the Company on Company Request, or (if then held by the Company) shall be discharged from such trust; and the Holder of such Security or any coupon appertaining thereto shall thereafter, as an unsecured general creditor, look only to the Company for payment thereof, and all liability of the Trustee or such Paying Agent with respect to such trust money, and all liability of the Company as trustee thereof, shall thereupon cease; provided, however, that the Trustee or such Paying Agent, before being required to make any such repayment, may at the expense of the Company cause to be published once, in an Authorized Newspaper in each Place of Payment, notice that such money remains unclaimed and that, after a date specified therein, which shall not be less than 30 days from the date of such publication, any unclaimed balance of such money then remaining will be repaid to the Company. SECTION 5.04. Additional Amounts. If the Securities of a series provide for the payment of additional amounts, the Company will pay to the Holder of any Security of any series or any coupon appertaining thereto additional amounts as provided therein. Whenever in this Indenture there is mentioned, in any context, the payment of the principal of (or premium, if any) or interest on, or in respect of, any Security of any series or payment of any related coupon or the net proceeds received on the sale or exchange of any Security of any series, such mention shall be deemed to include mention of the payment of additional amounts provided for in this Section to the extent that, in such context, additional amounts are, were or would be payable in respect thereof pursuant to the provisions of this Section and express mention of the payment of additional amounts (if applicable) in any provisions hereof shall not be construed as excluding additional amounts in those provisions hereof where such express mention is not made. If the Securities of a series provide for the payment of additional amounts, at least 10 days prior to the first Interest Payment Date with respect to that series of Securities (or if the Securities of that series will not bear interest prior to Maturity, the first day on which a payment of principal (and premium, if any) is made), and at least 10 days prior to each date of payment of principal (and premium, if any) or interest if there has been any change with respect to the matters set forth in the below-mentioned Officers' Certificate, the Company will furnish the Trustee and the Company's Principal Paying Agent or Paying Agents, if other than the Trustee, with an Officers' Certificate instructing the Trustee and such Paying Agent or Paying Agents whether such payment of principal of (and premium, if any) or interest on the Securities of that series shall be made to Holders of Securities of that series or any related coupons who are United States Aliens without withholding for or on account of any tax, assessment or other governmental charge described in the Securities of that series. If any such withholding shall be required, then such Officers' Certificate shall specify by country the amount, if any, Page 40
required to be withheld on such payments to such Holders of Securities or coupons and the Company will pay to the Trustee or such Paying Agent the additional amounts required by this Section. The Company covenants to indemnify the Trustee and any Paying Agent for, and to hold them harmless against, any loss, liability or expense reasonably incurred without negligence or bad faith on their part arising out of or in connection with actions taken or omitted by any of them in reliance on any Officers' Certificate furnished pursuant to this Section. SECTION 5.05. Statement as to Compliance. The Company will deliver to the Trustee, within 120 days after the end of each fiscal year of the Company, an Officers' Certificate (provided, however, that one of the signatories of which shall be the Company's principal executive officer, principal financial officer or principal accounting officer) stating, as to each signer thereof, that (i) a review of the activities of the Company during such year and of performance under this Indenture and under the terms of the Securities has been made under his supervision; and (ii) to the best of his knowledge, based on such review, (a) the Company has fulfilled all its obligations and complied with all conditions and covenants under this Indenture and under the terms of the Securities throughout such year, or, if there has been a default in the fulfillment of any such obligation, condition or covenant specifying each such default known to him and the nature and status thereof, and (b) no event has occurred and is occurring which is, or after notice or lapse of time or both would become, a Default, or if such an event has occurred and is continuing, specifying such event known to him and the nature and status thereof. For purposes of this Section, compliance or default shall be determined without regard to any period of grace or requirement of notice provided for herein. SECTION 5.06. Maintenance of Corporate Existence, Rights and Franchises. So long as any of the Securities shall be Outstanding, the Company will do or cause to be done all things necessary to preserve and keep in full force and effect its corporate existence, rights and franchises to carry on its business; provided, however, that nothing in this Section 5.06 shall prevent (i) any consolidation or merger of the Company, or any conveyance or transfer of its property and assets substantially as an entirety to any person, permitted by Article Ten, or (ii) the liquidation or dissolution of the Company after any conveyance or transfer of its property and assets substantially as an entirety to any person permitted by Article Ten. ARTICLE SIX HOLDERS' LISTS AND REPORTS BY TRUSTEE AND COMPANY SECTION 6.01. Company to Furnish Trustee Names and Addresses of Holders. The Company will furnish or cause to be furnished to the Trustee (i) semiannually, not more than 10 days after each February 1 and August 1, a list, in such form as the Trustee may reasonably require, containing all the information in the possession or control of the Company, any of its Paying Agents (other than the Trustee) or the Security Registrar, if other than the Trustee, as to the names and addresses of the Holders of Securities as of such February 1 and August 1, and (ii) at such other times as the Trustee may request in writing, within 30 days after receipt by the Company of any such request, a list of similar form and content as of a date not more than 15 days prior to the time such list is requested to be furnished; provided, however, that if and so long as the Trustee is the Security Registrar for Securities of a series, no such list need be furnished with respect to such Series of Securities. Page 41
SECTION 6.02. Preservation of Information; Communications to Holders. (i) The Trustee shall preserve, in as current a form as is reasonably practicable, the names and addresses of Holders of Securities contained in the most recent list furnished to the Trustee as provided in Section 6.01 and the names and addresses of Holders of Securities received by the Trustee in its capacity as the Security Registrar, if so acting. The Trustee may destroy any list furnished to it as provided in Section 6.01 upon receipt of a new list so furnished. (ii) If three or more Holders of Securities of any series (hereinafter referred to as "applicants") apply in writing to the Trustee, and furnish to the Trustee reasonable proof that each such applicant has owned a Security of such series for a period of at least six months preceding the date of such application, and such application states that the applicants desire to communicate with other Holders of Securities of such series or with the Holders of all Securities with respect to their rights under this Indenture or under such Securities and is accompanied by a copy of the form of proxy or other communication which such applicants propose to transmit, then the Trustee shall, within five Business Days after the receipt of such application, at its election, either (a) afford such applicants access to the information preserved at the time by the Trustee in accordance with Section 6.02(i), or (b) inform such applicants as to the approximate number of Holders of Securities of such series or all Securities, as the case may be, whose names and addresses appear in the information preserved at the time by the Trustee in accordance with Section 6.02(i), and as to the approximate cost of mailing to such Holders the form of proxy or other communication, if any, specified in such application. If the Trustee shall elect not to afford such applicants access to such information, the Trustee shall, upon the written request of such applicants, mail to each Holder of a Security of such series or all Holders of Securities, as the case may be, whose names and addresses appear in the information preserved at the time by the Trustee in accordance with Section 6.02(i), a copy of the form of proxy or other communication which is specified in such request, with reasonable promptness after a tender to the Trustee of the material to be mailed and of payment, or provision for the payment, of the reasonable expenses of mailing, unless, within five days after such tender, the Trustee shall mail to such applicants and file with the Commission, together with a copy of the material to be mailed, a written statement to the effect that, in the opinion of the Trustee, such mailing would be contrary to the best interests of the Holders of Securities of such series or all Securities, as the case may be, or would be in violation of applicable law. Such written statement shall specify the basis of such opinion. If the Commission, after opportunity for a hearing upon the objections specified in the written statement so filed, shall enter an order refusing to sustain any of such objections or if, after the entry of an order sustaining one or more of such objections, the Commission shall find, after notice and opportunity for hearing, that all the objections so sustained have been met and shall enter an order so declaring, the Trustee shall mail copies of such material to all such Holders of Securities with reasonable promptness after the entry of such order and the renewal of such tender; otherwise, the Trustee shall be relieved of any obligation or duty to such applicants respecting their application. (iii) Every Holder of Securities, by receiving and holding the same, agrees with the Company and the Trustee that neither the Company nor the Trustee shall be held accountable by reason of the disclosure of any such information as to the names and addresses of the Holders of Securities in accordance with Section 6.02(ii), regardless of the source from which such information was derived, and that the Trustee shall not be held accountable by reason of mailing any material pursuant to a request made under Section 6.02(ii). SECTION 6.03. Reports by Trustee. (i) Within 60 days after May 1 of each year commencing with the year 1996, the Trustee shall mail to each Holder reports concerning the Trustee and its action under the Indenture as may be required pursuant to the Trust Indenture Act if and to the extent and in the manner provided pursuant thereto. Page 42
(ii) Reports pursuant to this Section shall be transmitted by mail (1) to all Holders of Registered Securities, as their names and addresses appear in the Security Register and (2) to such Holders of Bearer Securities as have, within the two years preceding such transmission, filed their names and addresses with the Trustee for that purpose, and (3) except in the cases of reports under Section 313(b)(2) of the Trust Indenture Act, to each Holder of a Security of any series whose name and address appear in the information preserved at the time by the Trustee in accordance with Section 6.02(i). (iii) A copy of each such report shall, at the time of such transmission to Holders, be filed by the Trustee with each securities exchange upon which any Securities are listed, and also with the Commission. The Company will notify the Trustee when any Securities are listed on any securities exchange. SECTION 6.04. Reports by Company. The Company will: (i) file with the Trustee, within 15 days after the Company is required to file the same with the Commission, copies of the annual reports and of the information, documents and other reports (or copies of such portions of any of the foregoing as the Commission may from time to time by rules and regulations prescribe) which the Company may be required to file with the Commission pursuant to Section 13 or Section 15(d) of the Securities Exchange Act of 1934; or, if the Company is not required to file information, documents or reports pursuant to either of said Sections, then it will file with the Trustee and the Commission, in accordance with rules and regulations prescribed from time to time by the Commission, such of the supplementary and periodic information, documents and reports which may be required pursuant to Section 13 of the Securities Exchange Act of 1934 in respect of a security listed and registered on a national securities exchange as may be prescribed from time to time in such rules and regulations; (ii) file with the Trustee and the Commission, in accordance with rules and regulations prescribed from time to time by the Commission, such additional information, documents and reports with respect to compliance by the Company with the conditions and covenants of this Indenture as may be required from time to time by such rules and regulations; and (iii) transmit by mail to Holders of Securities, in the manner and to the extent provided in Section 6.03(ii), within 30 days after the filing thereof with the Trustee, such summaries of any information, documents and reports required to be filed by the Company pursuant to paragraphs (i) and (ii) of this Section as may be required by rules and regulations prescribed from time to time by the Commission. ARTICLE SEVEN REMEDIES SECTION 7.01. Events of Default. "Event of Default", with respect to any series of Securities, wherever used herein, means any one of the following events (whatever the reason for such Event of Default and whether it shall be voluntary or involuntary or be effected by operation of law or pursuant to any judgment, decree or order of any court or any order, rule or regulation of any administrative or governmental body), unless it is either inapplicable to a particular series or it is specifically deleted or modified in the supplemental indenture or Board Resolution under which such series of Securities is issued or in the form of Security for such series: (i) the entry of a decree or order by a court having jurisdiction in the premises granting relief in respect of the Company in an involuntary case under the Federal Bankruptcy Code, adjudging the Company a bankrupt, or approving as properly filed a petition seeking reorganization, arrangement, adjustment or composition of or in respect of the Company under the Federal Bankruptcy Code or any other applicable Federal or State bankruptcy, insolvency or other similar law, or appointing a receiver (or other similar official) of the Company, or of substantially all of its properties, or ordering the winding up or liquidation Page 43
of its affairs under any such law, and the continuance of any such decree or order unstayed and in effect for a period of 60 consecutive days; or (ii) the institution by the Company of proceedings to be adjudicated a bankrupt, or the consent of the Company to the institution of bankruptcy proceedings against it, or the filing by the Company of a petition or answer or consent seeking reorganization or relief under the Federal Bankruptcy Code or any other applicable Federal or State bankruptcy, insolvency or similar law, or the consent by the Company to the filing of any such petition or to the appointment of a receiver, liquidator, custodian, assignee, trustee, sequestrator (or other similar official) of the Company, or of substantially all of its properties under any such law; or (iii) any other Event of Default provided with respect to Securities of that series. SECTION 7.02. Acceleration of Maturity; Rescission and Annulment. If an Event of Default with respect to any series of Securities for which there are Securities Outstanding occurs and is continuing, then, and in every such case, the Trustee or the Holders of not less than 25% in principal amount of the Outstanding Securities of such series may declare the principal of all the Securities of such series (or, if the Securities of that series are Original Issue Discount Securities, such portion of the principal amount as may be specified in the terms of that series) to be immediately due and payable, by a notice in writing to the Company (and to the Trustee if given by Holders), and upon any such declaration the same shall become immediately due and payable. At any time after such a declaration of acceleration with respect to Securities of any series has been made and before a judgment or decree for payment of the money due has been obtained by the Trustee as hereinafter in this Article provided, the Holders of a majority in principal amount of the Outstanding Securities of such series, by written notice to the Company and the Trustee, may rescind and annul such declaration and its consequences if (i) the Company has paid or deposited with the Trustee a sum sufficient to pay (a) all overdue instalments of interest on all Securities of such series, (b) the principal of and premium, if any, on any Securities of such series which have become due otherwise than by such declaration of acceleration and interest thereon at the rate or rates prescribed therefor by the terms of the Securities of such series, (c) to the extent that payment of such interest is lawful, interest upon overdue instalments of interest at the rate or rates prescribed therefor by the terms of the Securities of such series, and (d) all sums paid or advanced by the Trustee hereunder and the reasonable compensation, expenses, disbursements and advances of the Trustee, the Security Registrar, any Paying Agent, and their agents and counsel and all other amounts due the Trustee under Section 8.07 and (ii) all other Defaults with respect to Securities of that series, other than the non-payment of the principal of Securities of that series which have become due solely by such declaration of acceleration, have been cured or waived as provided in Section 7.13. No such recission shall affect any subsequent default or impair any right consequent thereon. SECTION 7.03. Collection of Indebtedness and Suits for Enforcement by Trustee. The Company covenants that if (i) default is made in the payment of any instalment of interest on any Security of any series when such interest becomes due and payable and such default continues for a period of 30 days, or (ii) default is made in the payment of the principal of or premium, if any, on any Security of any series at the Maturity thereof, Page 44
the Company will, upon demand of the Trustee, pay to it, for the benefit of the Holder of any such Security or coupon appertaining thereto, if any, the whole amount then due and payable on any such Security or coupon for principal, premium, if any, and interest, with interest upon the overdue principal and premium, if any, and (to the extent that payment of such interest shall be lawful) upon overdue instalments of interest, at the rate or rates prescribed therefor by the terms of any such Security; and, in addition thereto, such further amount as shall be sufficient to cover the reasonable costs and expenses of collection, including the reasonable compensation, expenses, disbursements and advances of the Trustee, its agents and counsel and any other amounts due the Trustee under Section 8.07. If the Company fails to pay such amounts forthwith upon such demand, the Trustee, in its own name and as trustee of an express trust, may institute a judicial proceeding for the collection of the sums so due and unpaid, and may prosecute such proceeding to judgment or final decree, and may enforce the same against the Company or any other obligor upon such Securities and collect the moneys adjudged or decreed to be payable in the manner provided by law out of the property of the Company or any other obligor upon such Securities, wherever situated. If a Default with respect to any series of Securities occurs and is continuing, the Trustee may in its discretion proceed to protect and enforce its rights and the rights of the Holders of Securities of such series by such appropriate judicial proceedings as the Trustee shall deem most effectual to protect and enforce any such rights, whether for the specific enforcement of any covenant or agreement in this Indenture or in aid of the exercise of any power granted herein, or to enforce any other proper remedy. SECTION 7.04. Trustee May File Proofs of Claim. In case of the pendency of any receivership, insolvency, liquidation, bankruptcy, reorganization, arrangement, adjustment, composition or other judicial proceeding relative to the Company or any other obligor upon the Securities or the property of the Company or of such other obligor or their creditors, the Trustee (irrespective of whether the principal of any Securities shall then be due and payable as therein expressed or by declaration or otherwise and irrespective of whether the Trustee shall have made any demand on the Company for the payment of overdue principal, premium, if any, or interest) shall be entitled and empowered, by intervention in such proceeding or otherwise, (i) to file and prove a claim for the whole amount of principal, premium, if any, and interest owing and unpaid in respect of the Securities and to file such other papers or documents as may be necessary or advisable in order to have the claims of the Trustee (including any claim for the reasonable compensation, expenses, disbursements and advances of the Trustee, its agents and counsel and any other amounts due the Trustee under Section 8.07) and of the Holders allowed in such judicial proceeding, and (ii) to collect and receive any moneys or other property payable or deliverable on any such claims and to distribute the same, and any receiver, assignee, trustee, liquidator, sequestrator or other similar official in any such judicial proceeding is hereby authorized by each Holder to make such payments to the Trustee, and in the event that the Trustee shall consent to the making of such payments directly to the Holders, to pay to the Trustee any amount due to it for the reasonable compensation, expenses, disbursements and advances of the Trustee, its agents and counsel, and any other amounts due the Trustee under Section 8.07. Nothing herein contained shall be deemed to authorize the Trustee to authorize or consent to or accept or adopt on behalf of any Holder of a Security or coupon any plan of reorganization, arrangement, adjustment or composition affecting the Securities or the rights of any Holder thereof, or to authorize the Trustee to vote in respect of the claim of any Holder of a Security or coupon in any such proceeding. Page 45
SECTION 7.05. Trustee May Enforce Claims Without Possession of Securities. All rights of action and claims under this Indenture or under the Securities of any series, or coupons (if any) appertaining thereto, may be prosecuted and enforced by the Trustee without the possession of any of the Securities of such series or coupons appertaining thereto or the production thereof in any proceeding relating thereto, and any such proceeding instituted by the Trustee shall be brought in its own name as trustee of an express trust, and any recovery of judgment shall, after provision for the payment of the reasonable compensation, expenses, disbursements and advances of the Trustee, its agents and counsel and any other amounts due the Trustee under Section 8.07, be for the ratable benefit of the Holders of the Securities of such series and coupons appertaining thereto in respect of which such judgment has been recovered. SECTION 7.06. Application of Money Collected. Any money collected by the Trustee with respect to a series of Securities pursuant to this Article shall be applied in the following order, at the date or dates fixed by the Trustee, and, in case of the distribution of such money on account of principal, premium, if any, or interest, upon presentation of the Securities of such series or coupons appertaining thereto, if any, or both, as the case may be, and the notation thereon of the payment if only partially paid and upon surrender thereof if fully paid: FIRST: To the payment of all amounts due the Trustee under Section 8.07; SECOND: To the payment of the amounts then due and unpaid upon the Securities of such series and coupons for principal, premium, if any, and interest, in respect of which or for the benefit of which such money has been collected, ratably, without preference or priority of any kind, according to the amounts due and payable on Securities of such series and coupons, if any, for principal, premium, if any, and interest, respectively. The Holders of each series of Securities denominated in ECU, any other composite currency or a Foreign Currency and any matured coupons relating thereto shall be entitled to receive a ratable portion of the amount determined by the Exchange Rate Agent by converting the principal amount Outstanding of such series of Securities and matured but unpaid interest on such series of Securities in the currency in which such series of Securities is denominated into Dollars at the Exchange Rate as of the date of declaration of acceleration of the Maturity of the Securities; and THIRD: The balance, if any, to the Person or Persons entitled thereto. SECTION 7.07. Limitation on Suits. No Holder of any Security of any series or any related coupons shall have any right to institute any proceeding, judicial or otherwise, with respect to this Indenture, or for the appointment of a receiver or trustee, or for any other remedy hereunder, unless (i) such Holder has previously given written notice to the Trustee of a continuing Default with respect to Securities of such series; (ii) the Holders of not less than a majority in principal amount of the Outstanding Securities of such series shall have made written request to the Trustee to institute proceedings in respect of such Default in its own name as Trustee hereunder; (iii) such Holder or Holders have offered to the Trustee reasonable indemnity against the costs, expenses and liabilities to be incurred in compliance with such request; (iv) the Trustee for 60 days after its receipt of such notice, request and offer of indemnity has failed to institute any such proceeding; and (v) no direction inconsistent with such written request has been given to the Trustee during such 60-day period by the Holders of a majority in principal amount of the Outstanding Securities of such series; it being understood and intended that no one or more Holders of Securities of such series shall have any right in any manner whatever by virtue of, or by availing of, any provision of this Indenture to affect, disturb or prejudice the rights of any other Holders of Securities of such series or to obtain or to seek to obtain priority or preference Page 46
over any other such Holders or to enforce any right under this Indenture, except in the manner herein provided and for the equal and ratable benefit of all the Holders of Securities of such series. The following events shall be "Defaults" with respect to any series of Securities under this Indenture: (a) an Event of Default with respect to such series specified in Section 7.01; or (b) default in the payment of the principal of or premium, if any, on any Security of such series at its Maturity; or (c) default in the payment of any interest upon any Security of such series as and when the same shall become due and payable, and continuance of such default for a period of 30 days; or (d) failure on the part of the Company duly to observe or perform any of the other covenants or agreements on its part in the Securities of such series or in this Indenture and continuance of such failure for a period of sixty days after the date on which written notice of such failure, requiring the Company to remedy the same and stating that such notice is a "Notice of Default" hereunder, shall have been given by registered mail to the Company by the Trustee, or to the Company and the Trustee by the holders of at least 25% in aggregate principal amount of the Securities of such series at the time Outstanding, or (e) any other Default provided with respect to Securities of that Series. SECTION 7.08. Unconditional Right of Holders to Receive Principal, Premium and Interest. Notwithstanding any other provision in this Indenture, the Holder of any Security or coupon shall have the right, which is absolute and unconditional, to receive payment of the principal of, premium, if any, and (subject to Section 3.07) interest on such Security or payment of such coupon on the respective Stated Maturities expressed in such Security or coupon (or, in the case of redemption or repayment on the Redemption Date or Repayment Date) and to institute suit for the enforcement of such payment, and such rights shall not be impaired without the consent of such Holder. SECTION 7.09. Restoration of Rights and Remedies. If the Trustee or any Holder of a Security or coupon has instituted any proceeding to enforce any right or remedy under this Indenture and such proceeding has been discontinued or abandoned for any reason, or has been determined adversely to the Trustee or to such Holder, then and in every such case the Company, the Trustee and the Holders shall, subject to any determination in such proceeding, be restored severally and respectively to their former positions hereunder, and thereafter all rights and remedies of the Trustee and the Holders shall continue as though no such proceeding had been instituted. SECTION 7.10. Rights and Remedies Cumulative. Except as otherwise provided with respect to the replacement or payment of mutilated, lost, destroyed or stolen Securities or coupons in the last paragraph of Section 3.06, no right or remedy herein conferred upon or reserved to the Trustee or to the Holders is intended to be exclusive of any other right or remedy, and every right and remedy shall, to the extent permitted by law, be cumulative and in addition to every other right and remedy given hereunder or now or hereafter existing at law or in equity or otherwise. The assertion or employment of any right or remedy hereunder, or otherwise, shall not prevent the concurrent assertion or employment of any other appropriate right or remedy. SECTION 7.11. Delay or Omission Not Waiver. No delay or omission of the Trustee or of any Holder of any Security or coupon to exercise any right or remedy accruing upon any Default shall impair any such right or remedy or constitute a waiver of any such Default or an acquiesence therein. Every right and remedy given by this Article or by law to the Trustee or to the Holders may be exercised from time to time, and as often as may be deemed expedient, by the Trustee or by the Holders, as the case may be. Page 47
SECTION 7.12. Control by Holders. The Holders of a majority in principal amount of the Outstanding Securities of any series shall have the right to direct the time, method and place of conducting any proceeding for any remedy available to the Trustee or exercising any trust or power conferred on the Trustee with respect to the Securities of such series, provided that (i) such direction shall not be in conflict with any rule of law or with this Indenture, (ii) the Trustee shall not determine that the action so directed would be unjustly prejudicial to the Holders not taking part in such direction, (iii) subject to the provisions of Section 8.01, the Trustee shall have the right to decline to follow any such direction if the Trustee in good faith shall, by a Responsible Officer or Officers of the Trustee, determine that the proceeding so directed would involve the Trustee in personal liability, and (iv) the Trustee may take any other action deemed proper by the Trustee which is not inconsistent with such direction. SECTION 7.13. Waiver of Past Defaults. The Holders of a majority in principal amount of the Outstanding Securities of any series may on behalf of the Holders of all the Securities of such series waive any past default hereunder and its consequences, except a default not theretofore cured (i) in the payment of the principal of, premium, if any, or interest on any Security of such series, or (ii) in respect of a covenant or provision hereof which under Article Nine cannot be modified or amended without the consent of the Holder of each Outstanding Security of such series affected. Upon any such waiver, such default shall cease to exist, and any Default or Event of Default arising therefrom shall be deemed to have been cured, for every purpose of the Securities of such series under this Indenture; but no such waiver shall extend to any subsequent or other default or impair any right consequent thereon. SECTION 7.14. Undertaking for Costs. All parties to this Indenture agree, and each Holder of any Security by his acceptance thereof shall be deemed to have agreed, that any court may in its discretion require, in any suit for the enforcement of any right or remedy under this Indenture, or in any suit against the Trustee for any action taken, suffered or omitted by it as Trustee, the filing by any party litigant in such suit of an undertaking to pay the costs of such suit, and that such court may in its discretion assess reasonable costs, including reasonable attorneys' fees, against any party litigant in such suit, having due regard to the merits and good faith of the claims or defenses made by such party litigant; but the provisions of this Section shall not apply to any suit instituted by the Company, to any suit instituted by the Trustee, to any suit instituted by any Holder, or group of Holders, holding in the aggregate more than 10% in principal amount of the Outstanding Securities of any series, or to any suit instituted by any Holder of Securities or coupons for the enforcement of the payment of the principal of, premium, if any, or interest on any Security or payment of any coupon on or after the respective Stated Maturities expressed in such Security or coupon (or, in the case of redemption or repayment, on or after the Redemption Date or Repayment Date). SECTION 7.15. Waiver of Stay or Extension Laws. The Company covenants (to the extent that it may lawfully do so) that it will not at any time insist upon, or plead, or in any manner whatsoever claim or take the benefit or advantage of, any stay or extention law wherever enacted, now or at any time hereafter in force, which may affect the covenants or the performance of this Indenture; and the Company (to the extent that it may lawfully do so) hereby expressly waives all benefit or advantage of any such law, and covenants that it will not hinder, delay or impede the execution of any power herein granted to the Trustee, but will suffer and permit the execution of every such power as though no such law had been enacted. Page 48
ARTICLE EIGHT THE TRUSTEE SECTION 8.01. Certain Duties and Responsibilities. (i) Except during the continuance of a Default with respect to any series of Securities, (a) the Trustee undertakes to perform such duties and only such duties as are specifically set forth in this Indenture with respect to Securities of such series, and no implied covenants or obligations shall be read into this Indenture against the Trustee with respect to such series; and (b) in the absence of bad faith on its part, the Trustee may conclusively rely with respect to such series, as to the truth of the statements and the correctness of the opinions expressed therein, upon certificates or opinions furnished to the Trustee and conforming to the requirements of this Indenture; but in the case of any such certificate or opinions which by any provision hereof are specifically required to be furnished to the Trustee, the Trustee shall be under a duty to examine the same to determine whether or not they conform as to form to the requirements of the Indenture. (ii) In case a Default with respect to any series of Securities has occurred and is continuing, the Trustee shall exercise such of the rights and powers vested in it by this Indenture with respect to such series, and use the same degree of care and skill in their exercise, as a prudent person would exercise or use under the circumstances in the conduct of his or her own affairs. (iii) No provision of this Indenture shall be construed to relieve the Trustee from liability for its own negligent action, its own negligent failure to act, or its own wilful misconduct, except that (a) this Subsection shall not be construed to limit the effect of Subsection (i) of this Section; (b) the Trustee shall not be liable for any error or judgment made in good faith by a Responsible Officer, unless it shall be proved that the Trustee was negligent in ascertaining the pertinent facts; (c) the Trustee shall not be liable with respect to any action taken, suffered or omitted to be taken by it in good faith in accordance with the direction of the Holders of a majority in principal amount of the Outstanding Securities of any series relating to the time, method and place of conducting any proceeding for any remedy available to the Trustee, or exercising any trust or power conferred upon the Trustee, under this Indenture with respect to Securities of such series; and (d) no provision of this Indenture shall require the Trustee to expend or risk its own funds or otherwise incur any financial liability in the performance of any of its duties hereunder, or in the exercise of any of its rights or powers, if it shall have reasonable grounds for believing that repayment of such funds or adequate indemnity against such risk or liability is not reasonably assured to it. (iv) Whether or not therein expressly so provided, every provision of this Indenture relating to the conduct or affecting the liability of or affording protection to the Trustee shall be subject to the provisions of this Section. SECTION 8.02. Notice of Default. Within 90 days after the occurrence of any default hereunder with respect to Securities of any series, the Trustee shall transmit by mail to all Holders of Securities of such series entitled to receive reports pursuant to Section 6.03(ii) notice of such default hereunder known to the Trustee, unless such default shall have been cured or waived; provided, however, that, except in the case of a default in the payment of the principal of, premium, if any, or interest on any Security of such series, or any related coupons or in the payment of any sinking fund instalment with respect to Securities of such series the Trustee shall be protected in withholding such notice if and so long as the board of directors, the executive committee or a trust committee of directors and/or Responsible Officers of the Trustee in good faith determines that the withholding of such notice is in the interests of the Holders of Securities of such series; and provided, further, that in the case of any default of the character Page 49
specified in Section 7.07(d) with respect to Securities of such series, no such notice to Holders of Securities of such series shall be given until at least 30 days after the occurrence thereof. For the purpose of this Section, the term "default", with respect to Securities of any series, means any event which is, or after notice or lapse of time, or both, would become, a Default or an Event of Default with respect to Securities of such series. SECTION 8.03. Certain Rights of Trustee. Except as otherwise provided in Section 8.01: (i) the Trustee may rely and shall be protected in acting or refraining from acting upon any resolution, certificate, statement, instrument, opinion, report, notice, request, direction, consent, order, bond, note or other paper or document believed by it to be genuine and to have been signed or presented by the proper party or parties; (ii) any request or direction of the Company mentioned herein shall be sufficiently evidenced by a Company Request or Company Order and any resolution of the Board of Directors may be sufficiently evidenced by a Board Resolution; (iii) whenever in the administration of this Indenture the Trustee shall deem it desirable that a matter be proved or established prior to taking, suffering or omitting any action hereunder, the Trustee (unless other evidence be herein specifically prescribed) may, in the absence of bad faith on its part, rely upon an Officers' Certificate; (iv) the Trustee may consult with counsel and the advice of such counsel or any Opinion of Counsel shall be full and complete authorization and protection in respect of any action taken, suffered or omitted by it hereunder in good faith and in reliance thereon; (v) the Trustee shall be under no obligation to exercise any of the rights or powers vested in it by this Indenture at the request or direction of any of the Holders pursuant to this Indenture, unless such Holders shall have offered to the Trustee reasonable security or indemnity against the costs, expenses and liabilities which might be incurred by it in compliance with such request or direction; (vi) the Trustee shall not be bound to make any investigation into the facts or matters stated in any resolution, certificate, statement, instrument, opinion, report, notice, request, direction, consent, order, bond, security or other paper or document, but the Trustee, in its discretion, may make further inquiry or investigation into such facts or matters as it may see fit, and, if the Trustee shall determine to make such further inquiry or investigation, it shall be entitled to examine the books, records and premises of the Company, personally or by agent or attorney and, if so requested to do so by any of the Holders, at the sole cost and expense of the Holders; (vii) the Trustee may execute any of the trusts or powers hereunder or perform any duties hereunder either directly or by or through agents or attorneys and the Trustee shall not be responsible for any misconduct or negligence on the part of any agent or attorney appointed with due care by it hereunder; and (viii) in the event that the Trustee is also acting as Paying Agent, Authenticating Agent or Security Registrar hereunder, the rights and protections afforded to the Trustee pursuant to this Article Eight shall also be afforded to such Paying Agent, Authenticating Agent or Security Registrar. SECTION 8.04. Not Responsible for Recitals or Issuance of Securities. The recitals contained herein and in the Securities, except the Trustee's certificates of authentication, shall be taken as the statements of the Company, and neither the Trustee nor any Authenticating Agent assumes responsibility for their correctness. The Trustee makes no representations as to the validity or sufficiency of this Indenture or of the Securities. The Trustee shall not be accountable for the use or application by the Company of Securities or the proceeds thereof. Page 50
SECTION 8.05. May Hold Securities. The Trustee, any Authenticating Agent, any Paying Agent, the Security Registrar or any other agent of the Company, in its individual or any other capacity, may become the owner or pledgee of Securities and, subject to Sections 8.08 and 8.13, may otherwise deal with the Company with the same rights it would have if it were not Trustee, Authenticating Agent, Paying Agent, Security Registrar or such other agent. SECTION 8.06. Money Held in Trust. Money held by the Trustee in trust hereunder need not be segregated from other funds except to the extent required by law. The Trustee shall be under no liability for interest on any money received by it hereunder except as otherwise agreed in writing with the Company. SECTION 8.07. Compensation and Reimbursement. The Company agrees (i) to pay to the Trustee from time to time reasonable compensation for all services rendered by it hereunder (which compensation shall not be limited by any provision of law in regard to the compensation of a trustee of an express trust); (ii) except as otherwise expressly provided herein, to reimburse the Trustee upon its request for all reasonable expenses, disbursements and advances incurred or made by the Trustee in accordance with any provision of this Indenture (including the reasonable compensation and the expenses and disbursements of its agents and counsel), except any such expense, disbursement or advance as may be attributable to its negligence or bad faith; and (iii) to indemnify the Trustee for, and to hold it harmless against, any loss, liability or expense incurred without negligence or bad faith on its part, arising out of or in connection with the acceptance or administration of this trust, including the costs and expenses of defending itself against any claim or liability in connection with the exercise or performance of any of its powers or duties hereunder. As security for the performance of the obligations of the Company under this Section the Trustee shall have a lien prior to the Securities upon all property and funds held or collected by the Trustee as such, except funds held in trust for the payment of principal of, premium, if any, or interest on particular Securities. When the Trustee incurs expenses or renders services in connection with an Event of Default specified in Section 7.01, the expenses (including the reasonable fees and expenses of its counsel) and the compensation for the services are intended to constitute expenses of administration under any applicable bankruptcy, insolvency or other similar law. The obligations of the Company set forth in this Section 8.07 and any lien arising hereunder shall survive the resignation or removal of any Trustee, the discharge of the Company's obligations pursuant to Article Eleven of this Indenture, the termination of this Indenture and the repayment of the Securities whether at the Stated Maturity or otherwise. SECTION 8.08. Disqualification; Conflicting Interests. If the Trustee has or shall acquire a conflicting interest within the meaning of Section 310 of the Trust Indenture Act, the Trustee shall either eliminate such conflicting interest or resign, to the extent and in the manner provided by, and subject to the provisions of, the Trust Indenture Act and this Indenture. To the extent permitted by the Trust Indenture Act, the Trustee shall not be deemed to have a conflicting interest with respect to the Securities of any series by virtue of being Trustee with respect to the Securities of any particular series of Securities other than that series or by virtue of being trustee under the Indenture dated as of July 15, 1992, between the Company and the Trustee. Page 51
SECTION 8.09. Corporate Trustee Required; Eligibility. There shall at all times be a Trustee with respect to each series of Securities hereunder which shall be a corporation organized and doing business under the laws of the United States of America, any State thereof or the District of Columbia, authorized under such laws to exercise corporate trust powers, having a combined capital and surplus of at least $5,000,000, subject to supervision or examination by Federal or State authority, provided, however, that if Section 310(a) of the Trust Indenture Act or the rules and regulations of the Commission under the Trust Indenture Act at any time permit a corporation organized and doing business under the laws of any other jurisdiction to serve as trustee of an indenture qualified under the Trust Indenture Act, this Section 8.09 shall be automatically deemed amended to permit a corporation organized and doing business under the laws of any such jurisdiction to serve as Trustee hereunder. If such corporation publishes reports of condition at least annually, pursuant to law or to the requirements of the aforesaid supervising or examining authority, then for the purposes of this Section, the combined capital and surplus of such corporation shall be deemed to be its combined capital and surplus as set forth in its most recent report of condition so published. Neither the Company nor any person directly or indirectly controlling, controlled by or under common control with the Company may serve as Trustee. If at any time the Trustee with respect to any series of Securities shall cease to be eligible in accordance with the provisions of this Section, it shall resign immediately in the manner and with the effect hereinafter specified in this Article. SECTION 8.10. Resignation and Removal; Appointment of Successor. (i) No resignation or removal of the Trustee and no appointment of a successor Trustee pursuant to this Article shall become effective until the acceptance of appointment by the successor Trustee under Section 8.11. (ii) The Trustee may resign with respect to any series of Securities at any time by giving written notice thereof to the Company. If an instrument of acceptance by a successor Trustee shall not have been delivered to the resigning Trustee within 30 days after the giving of such notice of resignation, the resigning Trustee may petition any court of competent jurisdiction for the appointment of a successor Trustee with respect to Securities of such series. (iii) The Trustee may be removed with respect to any series of Securities at any time by Act of the Holders of a majority in principal amount of the Outstanding Securities of such series, delivered to the Trustee and to the Company. (iv) If at any time: (a) the Trustee shall fail to comply with Section 8.08 with respect to any series of Securities after written request therefor by the Company or by any Holder who has been a bona fide Holder of a Security of such series for at least six months, or (b) the Trustee shall cease to be eligible under Section 8.09 with respect to any series of Securities and shall fail to resign after written request therefor by the Company or by any Holder of Securities of such series, or (c) the Trustee shall become incapable of acting with respect to any series of Securities or shall be adjudged a bankrupt or insolvent or a receiver of the Trustee or of its property shall be appointed or any public officer shall take charge or control of the Trustee or of its property or affairs for the purpose of rehabilitation, conservation or liquidation, then, in any such case, (1) the Company by a Board Resolution may remove the Trustee with respect to such series, or (2) subject to Section 7.14, any Holder who has been a bona fide Holder of a Security of such series for at least six months may, on behalf of himself and all others similarly situated, petition any court of competent jurisdiction for the removal of the Trustee and the appointment of a successor Trustee with respect to such series. Page 52
(v) If the Trustee shall resign, be removed or become incapable of acting with respect to any series of Securities, or if a vacancy shall occur in the office of Trustee with respect to any series of Securities for any cause, the Company, by a Board Resolution, shall promptly appoint a successor Trustee or Trustees with respect to the Securities of that or those series (it being understood that any such successor Trustee may be appointed with respect to the Securities of one or more or all of such series and that at any time there shall be only one Trustee with respect to the Securities of any particular series) and shall comply with the applicable requirements of Section 8.11. If, within one year after such resignation, removal or incapability, or the occurrence of such vacancy, a successor Trustee with respect to such series of Securities shall be appointed by the Act of the Holders of a majority in principal amount of the Outstanding Securities of such series delivered to the Company and the retiring Trustee with respect to such series, the successor Trustee so appointed shall, forthwith upon its acceptance of such appointment, become the successor Trustee with respect to such series and to that extent supersede the successor Trustee appointed by the Company with respect to such series. If no successor Trustee with respect to such series shall have been so appointed by the Company or the Holders of Securities of such series and accepted appointment in the manner hereinafter provided, any Holder who has been a bona fide Holder of a Security of such series for at least six months may, on behalf of himself and all others similarly situated, petition any court of competent jurisdiction for the appointment of a successor Trustee with respect to such series. (vi) The Company shall give notice of each resignation and each removal of the Trustee with respect to the Securities of any series and each appointment of a successor Trustee with respect to the Securities of any series by mailing written notice of such event by first-class mail, postage prepaid, to the Holders of Registered Securities of such series as their names and addresses appear in the Security Register and, if Securities of such series are issuable as Bearer Securities, by publishing notice of such event once in an Authorized Newspaper in each place of payment located outside the United States. Each notice shall include the name of the successor Trustee with respect to the Securities of such series and the address of its Principal Corporate Trust Office. SECTION 8.11. Acceptance of Appointment by Successor. (i) In the case of the appointment hereunder of a successor Trustee with respect to any series of Securities, every such successor Trustee so appointed shall execute, acknowledge and deliver to the Company and to the retiring Trustee an instrument accepting such appointment, and thereupon the resignation or removal of the retiring Trustee shall become effective with respect to all or any series as to which it is resigning as Trustee, and such successor Trustee, without any further act, deed or conveyance, shall become vested with all the rights, powers, trusts and duties of the retiring Trustee with respect to all or any such series; but, on request of the Company or such successor Trustee, such retiring Trustee shall upon payment of its charges, execute and deliver an instrument transferring to such successor Trustee all the rights, powers and trusts of such retiring Trustee with respect to all or any such series; and shall duly assign, transfer and deliver to such successor Trustee all property and money held by such retiring Trustee hereunder with respect to all or any such series, subject nevertheless to its lien, if any, provided for in Section 8.07. (ii) In case of the appointment hereunder of a successor Trustee with respect to the Securities of one or more (but not all) series, the Company, the retiring Trustee and each successor Trustee with respect to the Securities of one or more series shall execute and deliver an indenture supplemental hereto wherein each successor Trustee shall accept such appointment and which (a) shall contain such provisions as shall be necessary or desirable to transfer and confirm to, and to vest in, each successor Trustee all the rights, powers, trusts and duties of the retiring Trustee with respect to the Securities of that or those series to which the appointment of such successor Trustee relates, (b) if the retiring Trustee is not retiring with respect to all Securities, shall contain such provisions as shall be deemed necessary or desirable to confirm that all the rights, powers, trusts and duties of the retiring Trustee with respect to the Securities of that or those series as to which the retiring Trustee is not retiring shall continue to be vested in the retiring Trustee, and (c) shall add to or change any of the provisions of this Indenture as shall be necessary to provide for or facilitate the administration of the trusts hereunder by more than one Trustee, it being understood that nothing herein or in such supplemental indenture shall constitute such Page 53
Trustees co-trustees of the same trust and that each such Trustee shall be trustee of a trust or trusts hereunder separate and apart from any trust or trusts hereunder administered by any other such Trustee; and upon the execution and delivery of such supplemental indenture the resignation or removal of the retiring Trustee shall become effective to the extent provided therein and each such successor Trustee, without any further act, deed or conveyance, shall become vested with all the rights, powers, trusts and duties of the retiring Trustee with respect to the Securities of that or those series to which the appointment of such successor Trustee relates; but, on request of the Company or any successor Trustee, such retiring Trustee shall duly assign, transfer and deliver to such successor Trustee all property and money held by such retiring Trustee hereunder with respect to the Securities of that or those series to which the appointment of such successor Trustee relates, subject nevertheless to its lien, if any, provided for in Section 8.07. (iii) Upon request of any such successor Trustee, the Company shall execute any and all instruments for more fully and certainly vesting in and confirming to such successor Trustee all such rights, powers and trusts referred to in Paragraph (i) or (ii) of this Section, as the case may be. (iv) No successor Trustee with respect to a series of Securities shall accept its appointment unless at the time of such acceptance such successor Trustee shall be qualified and eligible with respect to such series under this Article. SECTION 8.12. Merger, Conversion, Consolidation or Succession to Business of Trustee. Any corporation into which the Trustee may be merged or converted or with which it may be consolidated, or any corporation resulting from any merger, conversion or consolidation to which the Trustee shall be a party, or any corporation succeeding to all or substantially all of the corporate trust business of the Trustee, shall be the successor of the Trustee hereunder, provided that such corporation shall be otherwise qualified and eligible under this Article, without the execution or filing of any paper or any further act on the part of any of the parties hereto. In case any Securities shall have been authenticated, but not delivered, by the Trustee then in office, any successor by merger, conversion or consolidation to such authenticating Trustee may adopt such authentication and deliver the Securities so authenticated with the same effect as if such successor Trustee had itself authenticated such Securities. SECTION 8.13. Preferential Collection of Claims against Company. If and when the Trustee shall be or become a creditor of the Company (or any other obligor upon the Securities), the Trustee shall be subject to the provisions of Section 311 of the Trust Indenture Act regarding the collection of such claims against the Company (or any such other obligor). A Trustee that has resigned or been removed shall be subject to and comply with said Section 311 to the extent required thereby. SECTION 8.14. Appointment of Authenticating Agents. The Trustee may appoint an Authenticating Agent or Agents, which may include any Affiliate of the Company, with respect to one or more series of Securities. Such Authenticating Agent or Agents at the option of the Trustee shall be authorized to act on behalf of the Trustee to authenticate Securities of such series issued upon original issuance, exchange, registration of transfer or partial redemption thereof or pursuant to Section 3.06, and Securities so authenticated shall be entitled to the benefits of this Indenture and shall be valid and obligatory for all purposes as if authenticated by the Trustee hereunder. Whenever reference is made in this Indenture to the authentication and delivery of Securities by the Trustee or the Trustee's certificate of authentication or the delivery of Securities to the Trustee for authentication, such reference shall be deemed to include authentication and delivery on behalf of the Trustee by an Authenticating Agent, a certificate of authentication executed on behalf of the Trustee by an Authenticating Agent and delivery of Securities to the Authenticating Agent on behalf of the Trustee. Each Authenticating Agent shall be acceptable to the Company and shall at all times be a corporation organized and doing business under the laws of the United States of America, any State thereof or the District of Columbia, authorized under such laws to act as Authenticating Page 54
Agent, having a combined capital and surplus of not less than $5,000,000 and subject to supervision or examination by Federal or State authority. Notwithstanding the foregoing, an Authenticating Agent located outside the United States may be appointed by the Trustee if previously approved in writing by the Company and if such Authenticating Agent meets the minimum capitalization requirements of this Section 8.14. If such Authenticating Agent publishes reports of condition at least annually, pursuant to law or to the requirements of said supervising or examining authority, then for the purposes of this Section, the combined capital and surplus of such Authenticating Agent shall be deemed to be its combined capital and surplus as set forth in its most recent report of condition so published. If at any time an Authenticating Agent shall cease to be eligible in accordance with the provisions of this Section, such Authenticating Agent shall resign immediately in the manner and with the effect specified in this Section. Any corporation into which an Authenticating Agent may be merged or converted or with which it may be consolidated, or any corporation resulting from any merger, conversion or consolidation to which such Authenticating Agent shall be a party, or any corporation succeeding to the corporate agency or corporate trust business of an Authenticating Agent, shall continue to be an Authenticating Agent, provided such corporation shall be otherwise eligible under this Section, without the execution or filing of any paper or any further act on the part of the Trustee or the Authenticating Agent. An Authenticating Agent may resign at any time by giving written notice thereof to the Trustee and to the Company. The Trustee may at any time (and upon request by the Company shall) terminate the agency of an Authenticating Agent by giving written notice thereof to such Authenticating Agent and to the Company. Upon receiving such a notice of resignation or upon such termination, or in case at any time such Authenticating Agent shall cease to be eligible in accordance with the provisions of this Section, the Trustee may appoint a successor Authenticating Agent which shall be acceptable to the Company. Any successor Authenticating Agent upon acceptance of its appointment hereunder shall become vested with all the rights, powers and duties of its predecessor hereunder, with like effect as if originally named as an Authenticating Agent. No successor Authenticating Agent shall be appointed unless eligible under the provisions of this Section. If an appointment with respect to one or more series is made pursuant to this Section, the Securities of such series may have endorsed thereon, in addition to the Trustee's certificate of authentication, an alternate certificate of authentication in the following form: This is one of the Securities of the series designated therein referred to in the within-mentioned Indenture. The Chase Manhattan Bank (National Association), as Trustee By____________________________________ As Authenticating Agent By____________________________________ Authorized Officer Page 55
ARTICLE NINE SUPPLEMENTAL INDENTURES SECTION 9.01. Supplemental Indentures Without Consent of Holders. Without the consent of any Holder of any Securities or coupons, the Company, when authorized by a Board Resolution, and the Trustee, at any time and from time to time, may enter into one or more indentures supplemental hereto, in form satisfactory to the Trustee, for any of the following purposes: (i) to evidence the succession of another corporation or Person to the Company, and the assumption by any such successor of the covenants of the Company herein and in the Securities contained; or (ii) to evidence and provide for the acceptance of appointment by another corporation as a successor Trustee hereunder with respect to one or more series of Securities and to add to or change any of the provisions of this Indenture as shall be necessary to provide for or facilitate the administration of the trusts hereunder by more than one Trustee, pursuant to Section 8.11; or (iii) to add to the covenants of the Company, for the benefit of the Holders of Securities of all or any series of Securities or coupons (and if such covenants are to be for the benefit of less than all series of Securities or coupons, stating that such covenants are expressly being included solely for the benefit of such series), or to surrender any right or power herein conferred upon the Company; or (iv) to cure any ambiguity, to correct or supplement any provision herein which may be inconsistent with any other provision herein, or to make any other provisions with respect to matters or questions arising under the Indenture, provided that such action shall not adversely affect the interests of the Holders of Securities of any series or any related coupons in any material respect; or (v) to add any additional Defaults or Events of Default with respect to all or any series of the Securities (and, if such Defaults or Event of Default is applicable to less than all series of Securities, specifying the series to which such Default or Event of Default is applicable); or (vi) to add to, change or eliminate any of the provisions of this Indenture to provide that Bearer Securities may be registrable as to principal, to change or eliminate any restrictions on the payment of principal of (or premium, if any) or any interest on Bearer Securities, to permit Bearer Securities to be issued in exchange for Registered Securities, to permit Bearer Securities to be issued in exchange for Bearer Securities of other authorized denominations or to permit or facilitate the issuance of Securities in uncertificated form, provided any such action shall not adversely affect the interests of the Holders of Securities of any series or any related coupons in any material respect; or (vii) to add to, change or eliminate any of the provisions of this Indenture, provided that any such addition, change or elimination (a) shall become effective only when there is no Security Outstanding of any series created prior to the execution of such supplemental indenture which is adversely affected by such change in or elimination of such provision or (b) shall not apply to any Securities Outstanding; or (viii) to establish the form or terms of Securities of any series as permitted by Sections 2.01 and 3.01; or (ix) to add to or change any provisions of this Indenture to such extent as shall be necessary to permit or facilitate the issuance of Securities convertible into other securities; or (x) to evidence any changes to Section 8.09 as permitted by the terms thereof; or (xi) to add to or change or eliminate any provision of this Indenture as shall be necessary or desirable in accordance with any amendments to the Trust Indenture Act, provided such action shall not adversely affect the interest of Holders of Securities of any series or any appurtenant coupons in any material respect. SECTION 9.02. Supplemental Indentures With Consent of Holders. With the consent of the Holders of not less than a majority in aggregate principal amount of the Outstanding Securities of all series affected by such supplemental indenture or indentures (acting as one class), by Act of Page 56
said Holders delivered to the Company and the Trustee, the Company, when authorized by a Board Resolution, and the Trustee may enter into an indenture or indentures supplemental hereto for the purpose of adding any provisions to or changing in any manner or eliminating any of the provisions of this Indenture or of modifying in any manner the rights of the Holders of Securities of each such series and any related coupons under this Indenture; provided, however, that no such supplemental indenture shall, without the consent of the Holder of each Outstanding Security affected thereby; (i) change the Maturity of the principal of, or the Stated Maturity of any instalment of interest (or premium, if any) on, any Security, or reduce the principal amount thereof or any premium thereon or the rate of interest thereon, or change the obligation of the Company to pay additional amounts pursuant to Section 5.04 (except as contemplated by Section 10.01 (i) and permitted by Section 9.01), or reduce the amount of the principal of an Original Issue Discount Security that would be due and payable upon a declaration of acceleration of the Maturity thereof pursuant to Section 7.02, or change the method of calculating interest thereon or the coin or currency in which any Security (or premium, if any, thereon) or the interest thereon is payable, or reduce the minimum rate of interest thereon, or impair the right to institute suit for the enforcement of any such payment on or after the Stated Maturity thereof (or, in the case of redemption or repayment, on or after the Redemption Date or Repayment Date); (ii) reduce the percentage in principal amount of the Outstanding Securities of any series, the consent of whose Holders is required for any such supplemental indenture or the consent of whose Holders is required for any waiver (of compliance with certain provisions of this Indenture or of certain defaults hereunder and their consequences) provided for in this Indenture or reduce the requirements of Section 16.04 for a quorum; (iii) change any obligation of the Company to maintain an office or agency in the places and for the purposes specified in Section 5.02; or (iv) modify any of the provisions of this Section or Section 7.13, except to increase any such percentage or to provide that certain other provisions of this Indenture cannot be modified or waived. A supplemental indenture which changes or eliminates any covenant or other provision of this Indenture which has expressly been included soley for the benefit of one or more particular series of Securities, or which modifies the rights of the Holders of Securities of such series with respect to such covenant or other provision, shall be deemed not to affect the rights under this Indenture of the Holders of Securities of any other series. It shall not be necessary for any Act of Holders under this Section to approve the particular form of any proposed supplemental indenture, but it shall be sufficient if such Act shall approve the substance thereof. SECTION 9.03. Execution of Supplemental Indentures. In executing, or accepting the additional trusts created by, any supplemental indenture permitted by this Article or the modifications thereby of the trusts created by this Indenture, the Trustee shall be entitled to receive, and (subject to Section 8.01) shall be fully protected in relying upon, an Opinion of Counsel stating that the execution of such supplemental indenture is authorized or permitted by and complies with this Indenture. The Trustee may, but shall not be obligated to, enter into any such supplemental indenture which affects the Trustee's own rights, liabilities, duties or immunities under this Indenture or otherwise. SECTION 9.04. Effect of Supplemental Indentures. Upon the execution of any supplemental indenture under this Article, this Indenture shall be modified in accordance therewith, and such supplemental indenture shall form a part of this Indenture for all purposes; and every Holder of Securities theretofore or thereafter authenticated and delivered hereunder shall be bound thereby. SECTION 9.05. Conformity with Trust Indenture Act. Every supplemental indenture executed pursuant to this Article shall conform to the requirements of the TIA as then in effect. Page 57
SECTION 9.06. Reference in Securities to Supplemental Indentures. Securities authenticated and delivered after the execution of any supplemental indenture pursuant to this Article may, and shall, if required by the Trustee, bear a notation in form approved by the Trustee as to any matter provided for in such supplemental indenture. If the Company shall so determine, new Securities so modified as to conform, in the opinion of the Trustee and the Company, to any such supplemental indenture may be prepared and executed by the Company and authenticated and delivered by the Trustee in exchange for Outstanding Securities. SECTION 9.07. Subordination Unimpaired. No supplemental indenture executed pursuant to this Article shall directly or indirectly modify the provisions of Article Fourteen in any manner which might alter the subordination of the Securities. ARTICLE TEN CONSOLIDATION, MERGER, CONVEYANCE OR TRANSFER SECTION 10.01. Company May Consolidate, etc., Only on Certain Terms. The Company shall not consolidate with or merge into any other corporation or convey or transfer its properties and assets substantially as an entirety to any Person, unless (i) the corporation formed by such consolidation or into which the Company is merged or the Person which acquires by conveyance or transfer the properties and assets of the Company substantially as an entirety shall expressly assume, by an indenture supplemental hereto, executed and delivered to the Trustee, in form satisfactory to the Trustee, the due and punctual payment of the principal of, premium, if any, and interest (including all additional amounts, if any, payable pursuant to Section 5.04) on all the Securities and the performance of every covenant of this Indenture on the part of the Company to be performed or observed; (ii) immediately after giving effect to such transaction, no Default, and no event which, after notice or lapse of time, or both, would become a Default, shall have happened and be continuing; and (iii) the Company has delivered to the Trustee an Officers' Certificate and an Opinion of Counsel each stating that such consolidation, merger, conveyance or transfer and such supplemental indenture comply with this Article and that all conditions precedent herein provided for relating to such transaction have been complied with. SECTION 10.02. Successor Corporation Substituted. Upon any consolidation or merger, or any conveyance or transfer of the properties and assets of the Company substantially as an entirety in accordance with Section 10.01, the successor corporation formed by such consolidation or into which the Company is merged or to which such conveyance or transfer is made shall succeed to, and be substituted for, and may exercise every right and power of, the Company under this Indenture with the same effect as if such successor corporation had been named as the Company herein. In the event of any such conveyance or transfer, the Company as the predecessor corporation shall be relieved of all obligations and covenants under this Indenture and may be dissolved, wound up and liquidated at any time thereafter. Page 58
ARTICLE ELEVEN SATISFACTION AND DISCHARGE SECTION 11.01. Satisfaction and Discharge of Indenture. This Indenture shall cease to be of further effect (except as to any surviving rights of registration of transfer or exchange of Securities herein expressly provided for and rights to receive payments thereon and any right to receive additional amounts, as provided in Section 5.04), and the Trustee, on receipt of a Company Request and at the expense of the Company, shall execute proper instruments acknowledging satisfaction and discharge of this Indenture, when (i) either (a) all Securities theretofore authenticated and delivered (other than (1) coupons appertaining to Bearer Securities surrendered for exchange for Registered Securities and maturing after such exchange, whose surrender is not required or has not been waived as provided in Section 3.05, (2) coupons appertaining to Bearer Securities called for redemption and maturing after the relevant Redemption Date, whose surrender has been waived as provided in Section 4.07, (3) Securities and coupons which have been destroyed, lost or stolen and which have been replaced or paid as provided in Section 3.06, and (4) Securities for whose payment money has theretofore been deposited in trust or segregated and held in trust by the Company and thereafter repaid to the Company or discharged from such trust, as provided in Section 5.03) have been delivered to the Trustee for cancellation; or (b) all such Securities not theretofore delivered to the Trustee for cancellation (1) have become due and payable, or (2) will become due and payable at their Maturity within one year, or (3) are to be called for redemption within one year under arrangements satisfactory to the Trustee for the giving of notice of redemption by the Trustee in the name, and at the expense, of the Company, and the Company, in the case of (b) (1), (2) or (3) above, has deposited or caused to be deposited with the Trustee, as trust funds in trust for the purpose, an amount (said amount to be immediately due and payable to the Holders) sufficient to pay and discharge the entire indebtedness on such Securities and coupons not theretofore delivered to the Trustee for cancellation, for principal, premium, if any, and interest to the date of such deposit (in the case of Securities which have become due and payable), or to the Maturity or Redemption Date, as the case may be; (ii) the Company has paid or caused to be paid all other sums payable hereunder by the Company; and (iii) the Company has delivered to the Trustee an Officers' Certificate and an Opinion of Counsel each stating that all conditions precedent herein provided for relating to the satisfaction and discharge of this Indenture have been complied with. Notwithstanding the satisfaction and discharge of this Indenture, the obligations of the Company to the Trustee under Section 8.07 and, if money shall have been deposited with the Trustee pursuant to subclause (b) of clause (i) of this Section, the obligations of the Trustee under Section 11.02 and the last paragraph of Section 5.03 shall survive. The Trustee may give notice at the Company's expense to the Holders of Securities Outstanding of the immediate availability of the amount referred to in Clause (i) of this Section 11.01. Funds held pursuant to this Section shall not be subject to the provisions of Article Fourteen. SECTION 11.02. Application of Trust Money. Subject to the provisions of the last paragraph of Section 5.03, all money deposited with the Trustee pursuant to Section 11.01 shall be held in trust and applied by it, in accordance with the provisions of the Securities, the coupons, if any, and this Indenture, to the payment, either directly or through any Paying Agent Page 59
(including the Company acting as its own Paying Agent), as the Trustee may determine, to the Persons entitled thereto, of the principal, premium, if any, and interest for whose payment such money has been deposited with the Trustee; but such money need not be segregated from other funds except to the extent required by law. SECTION 11.03. Reinstatement. If the Trustee or any Paying Agent is unable to apply any money in accordance with Section 11.02 by reason of any legal proceeding or by reason of any order or judgment of any court or governmental authority enjoining, restraining or otherwise prohibiting such application, the Company's obligations under this Indenture and the Securities shall be revived and reinstated as though no deposit had occurred pursuant to Section 11.01 until such time as the Trustee or any Paying Agent is permitted to apply all such money in accordance with Section 11.02. ARTICLE TWELVE IMMUNITY OF INCORPORATORS, STOCKHOLDERS, OFFICERS AND DIRECTORS SECTION 12.01. Exemption from Individual Liability. No recourse under or upon any obligation, covenant or agreement of this Indenture, or of any Security or coupon, or for any claim based thereon or otherwise in respect thereof, shall be had against any incorporator, stockholder, officer or director, as such, past, present or future, of the Company or of any successor corporation, either directly or through the Company, whether by virtue of any constitution, statute or rule of law, or by the enforcement of any assessment or penalty or otherwise; it being expressly understood that this Indenture and the obligations issued hereunder are solely corporate obligations of the Company, and that no such personal liability whatever shall attach to, or is or shall be incurred by, the incorporators, stockholders, officers or directors, as such, of the Company or of any successor corporation, or any of them, because of the creation of the indebtedness hereby authorized, or under or by reason of the obligations, covenants or agreements contained in this Indenture or in any of the Securities or coupons or implied therefrom; and that any and all such personal liability, either at common law or in equity or by constitution or statute, of, and any and all such rights and claims against, every such incorporator, stockholder, officer or director, as such, because of the creation of the indebtedness hereby authorized, or under or by reason of the obligations, covenants or agreements contained in this Indenture or in any of the Securities or coupons or implied therefrom, are hereby expressly waived and released as a condition of, and as a consideration for, the execution of this Indenture and the issuance of the Securities. ARTICLE THIRTEEN SINKING FUNDS SECTION 13.01. Applicability of Article. The provisions of this Article shall be applicable to any sinking fund for the retirement of Securities of a series except as otherwise specified as contemplated by Section 3.01 for Securities of such series. The minimum amount of any sinking fund payment provided for by the terms of Securities of any series is herein referred to as a "mandatory sinking fund payment", and any payment in excess of such minimum amount provided for by the terms of Securities of any series is herein referred to as an "optional sinking fund payment". If provided for by the terms of Securities of any series, the cash amount of any sinking fund payment may be subject to reduction as provided in Section 13.02. Each sinking fund payment shall be applied to the redemption of Securities of any series as provided for by the terms of Securities of such series. Page 60
SECTION 13.02. Satisfaction of Sinking Fund Payments with Securities. The Company (i) may deliver Outstanding Securities of a series (other than any previously called for redemption), together in the case of any Bearer Securities of such series with all unmatured coupons appertaining thereto and (ii) may apply as a credit Securities of a series which have been redeemed either at the election of the Company pursuant to the terms of such Securities or through the application of permitted optional sinking fund payments pursuant to the terms of such Securities, in each case in satisfaction of all or any part of any sinking fund payment with respect to the Securities of such series required to be made pursuant to the terms of such Securities as provided for by the terms of such series; provided that such Securities have not been previously so credited. Such Securities shall be received and credited for such purpose by the Trustee at the Redemption Price specified in such Securities for redemption through operation of the sinking fund and the amount of such sinking fund payment shall be reduced accordingly. SECTION 13.03. Redemption of Securities for Sinking Fund. Not less than 60 days prior to each sinking fund payment date for any series of Securities, the Company will deliver to the Trustee and the Security Registrar an Officers' Certificate specifying (i) the amount of the next ensuing sinking fund payment for that series pursuant to the terms of that series, (ii) the portion thereof, if any, which is to be satisfied by payment of cash and the portion thereof, if any, which is to be satisfied by delivering and crediting Securities of that series pursuant to Section 13.02, and (iii) that none of such Securities has theretofore been so credited and stating the basis for such credit, and will also deliver to the Trustee any Securities to be so delivered. Not less than 30 days before each sinking fund payment date the Security Registrar shall select the Securities to be redeemed upon such sinking fund payment date in the manner specified in Section 4.03 and cause notice of the redemption thereof to be given in the name of and at the expense of the Company in the manner provided in Section 4.04. Such notice having been duly given, the redemption of such Securities shall be made upon the terms and in the manner stated in Sections 4.06 and 4.07. ARTICLE FOURTEEN SUBORDINATION OF SECURITIES SECTION 14.01. Agreement to Subordinate. The Company, for itself, its successors and assigns, covenants and agrees, and each Holder of a Security by his acceptance thereof, likewise covenants and agrees, that the payment of the principal and premium, if any, and interest on each and all of the Securities is hereby expressly subordinated, to the extent and in the manner hereinafter set forth, in right of payment to the prior payment in full of all Senior Indebtedness and, subject to the provisions of Section 14.09, General Obligations of the Company. SECTION 14.02. Distribution on Dissolution, Liquidation and Reorganization; Subrogation of Securities. Upon any distribution of assets of the Company upon any dissolution, winding up, liquidation or reorganization of the Company, whether in bankruptcy, insolvency, reorganization or receivership proceedings or upon an assignment for the benefit of creditors or any other marshalling of the assets and liabilities of the Company or otherwise (subject to the power of a court of competent jurisdiction to make other equitable provision reflecting the rights conferred in this Indenture upon the Senior Indebtedness and the holders thereof with respect to the Securities and the Holders thereof (and, upon the General Obligations and the creditors in respect thereof with respect to the Securities and the Holders thereof) by a lawful plan of reorganization under applicable bankruptcy law), (i) the holders of all Senior Indebtedness shall first be entitled to receive payment in full in accordance with the terms of such Senior Indebtedness of the principal thereof, premium, if any, and the interest due thereon (including interest accruing subsequent to the commencement of any proceeding for the bankruptcy or reorganization of the Company under any applicable bankruptcy, insolvency, or similar law now or Page 61
hereafter in effect) before the Holders of the Securities are entitled to receive any payment upon the principal of or premium, if any, or interest on indebtedness evidenced by the Securities; (ii) any payment or distribution of assets of the Company of any kind or character, whether in cash, property or securities, to which the Holders of the Securities or the Trustee would be entitled except for the provisions of this Article Fourteen, including any such payment or distribution which may be payable or deliverable by reason of the payment of any other indebtedness of the Company being subordinated to the payment of the Securities, shall be paid by the liquidating trustee or agent or other person making such payment or distribution, whether a trustee in bankruptcy, a receiver or liquidating trustee or otherwise, directly to the holders of Senior Indebtedness or their representative or representatives or to the trustee or trustees under any indenture under which any instruments evidencing any of such Senior Indebtedness may have been issued, in accordance with the priorities then existing among holders of Senior Indebtedness for payment of the aggregate amounts remaining unpaid on account of the principal of and premium, if any, and interest (including interest accruing subsequent to the commencement of any proceeding for the bankruptcy or reorganization of the Company under any applicable bankruptcy, insolvency, or similar law now or hereafter in effect) on the Senior Indebtedness held or represented by each, to the extent necessary to make payment in full of all Senior Indebtedness remaining unpaid, after giving effect to any concurrent payment or distribution to the holders of such Senior Indebtedness; it being understood that if the Holders of Securities shall fail to file a proper claim in the form required by any proceeding referred to in this subparagraph (ii) prior to thirty days before the expiration of the time to file such claim or claims, then the holders of Senior Indebtedness are hereby authorized to file an appropriate claim or claims for and on behalf of the Holders of Securities in the form required in any such proceeding (as are the creditors in respect of General Obligations in the event Section 14.09 is applicable); and (iii) in the event that, notwithstanding the foregoing, any payment or distribution of assets of the Company of any kind or character, whether in cash, property or securities, including any such payment or distribution which may be payable or deliverable by reason of the payment of any other indebtedness of the Company being subordinate to the payment of the Securities, shall be received by the Trustee or Holders of the Securities before all Senior Indebtedness is paid in full, such payment or distribution shall be held in trust for the benefit of and shall be paid over to the holders of such Senior Indebtedness or their representative or representatives or to the trustee or trustees under any indenture under which any instruments evidencing any of such Senior Indebtedness may have been issued, ratably as aforesaid, for application to the payment of all Senior Indebtedness remaining unpaid until all such Senior Indebtedness shall have been paid in full, after giving effect to any concurrent payment or distribution to the holders of such Senior Indebtedness. Subject to the payment in full of all Senior Indebtedness, the Holders of the Securities shall be subrogated (equally and ratably with the holders of all indebtedness of the Company which by its express terms is subordinated to indebtedness of the Company to substantially the same extent as the Securities are subordinated and is entitled to like rights of subrogation) to the rights of the holders of Senior Indebtedness to receive payments or distributions of cash, property or securities of the Company applicable to the Senior Indebtedness until the principal of and premium, if any, and interest on the Securities shall be paid in full and no such payments or distributions to holders of such Senior Indebtedness to which the Holders of the Securities would be entitled except for the provisions hereof of cash, property or securities otherwise distributable to the Senior Indebtedness shall, as between the Company, its creditors, other than the holders of Senior Indebtedness, and the Holders of the Securities, be deemed to be a payment by the Company to or on account of the Securities. It is understood that the provisions of this Article Fourteen are and are intended solely for the purpose of defining the relative rights of the Holders of the Securities, on the one hand, and the holders of Senior Indebtedness (and, in the case of Section 14.09, the Holders of the Securities, on the one hand, and creditors in respect of General Obligations) on the other hand. Nothing contained in this Article Fourteen or elsewhere in this Indenture or in the Securities is intended to or shall impair, as between the Company, its creditors, other than the holders of Senior Indebtedness, and the Holders of the Securities, the obligation of the Company, which is unconditional and absolute (and which, subject to the rights under this Article Fourteen of the holders of the Senior Page 62
Indebtedness and the rights under Section 14.09 of creditors in respect of General Obligations, is intended to rank equally with all other general obligations of the Company), to pay to the Holders of the Securities the principal of, premium, if any, and interest on the Securities as and when the same shall become due and payable in accordance with their terms or to affect the relative rights of the Holders of the Securities and creditors of the Company, other than the holders of the Senior Indebtedness and creditors in respect of General Obligations, nor shall anything herein or in the Securities prevent the Trustee or the Holder of any Security from exercising all remedies otherwise permitted by applicable law upon Default under this Indenture, subject to the rights, if any, under this Article Fourteen of the holders of Senior Indebtedness and under Section 14.09 of creditors in respect of General Obligations in respect of cash, property or securities of the Company received upon the exercise of any such remedy. Upon any payment or distribution of assets of the Company referred to in this Article Fourteen, the Trustee, subject to the provisions of Section 8.01, and the Holders of the Securities shall be entitled to rely upon any order or decree of a court of competent jurisdiction in which such dissolution, winding up, liquidation or reorganization proceedings are pending or upon a certificate of the liquidating trustee or agent or other person making any distribution to the Trustee or to the Holders of the Securities for the purpose of ascertaining the persons entitled to participate in such distribution, the holders of the Senior Indebtedness and other indebtedness of the Company and the creditors in respect of General Obligations, the amount thereof or payable thereon, the amount or amounts paid or distributed thereon and all other facts pertinent thereto or to this Article Fourteen. In the absence of any such liquidating trustee, agent or other person, the Trustee shall be entitled to rely upon a written notice by a Person representing himself to be a holder of Senior Indebtedness (or a trustee or representative on behalf of such holder) or a creditor in respect of General Obligations as evidence that such Person is a holder of Senior Indebtedness (or is such a trustee or representative) or a creditor in respect of General Obligations, as the case may be. In the event that the Trustee determines, in good faith, that further evidence is required with respect to the right of any Person, as a holder of Senior Indebtedness or a creditor in respect of General Obligations, to participate in any payment or distribution pursuant to this Section or Section 14.09, the Trustee may request such Person to furnish evidence to the reasonable satisfaction of the Trustee as to the amount of Senior Indebtedness or General Obligations held by such Person, as to the extent to which such Person is entitled to participation in such payment or distribution, and as to other facts pertinent to the rights of such Person under this Section or Section 14.09, and if such evidence is not furnished, the Trustee may defer any payment to such Person pending judicial determination as to the right of such Person to receive such payment. The obligations of the Company in respect of the Securities shall rank on a parity with the Existing Subordinated Indebtedness and any other obligations of the Company ranking on a parity with the Securities. With respect to the holders of Senior Indebtedness or creditors in respect of General Obligations, the Trustee undertakes to perform or to observe only such of its covenants and obligations as are specifically set forth in this Article, and no implied covenants or obligations with respect to the holders of Senior Indebtedness or creditors in respect of General Obligations shall be read into this Indenture against the Trustee. The Trustee, however, shall not be deemed to owe any fiduciary duty to the holders of Senior Indebtedness or creditors in respect of General Obligations, and shall not be liable to any such holders or creditors if it shall mistakenly pay over or distribute to or on behalf of Holders of Securities or the Company moneys or assets to which any holders of Senior Indebtedness or creditors in respect of General Obligations shall be entitled by virtue of this Article Fourteen. SECTION 14.03. Payments on Securities Prohibited During Event of Default under Senior Indebtedness. In the event and during the continuation of any default in the payment of principal of, or premium, if any, or interest on, any Senior Indebtedness beyond any applicable period of grace, or in the event that any event of default with respect to any Senior Indebtedness shall have occurred and be continuing, or would occur as a result of the payment referred to hereinafter, permitting the holders of such Senior Indebtedness (or a trustee on behalf of the holders thereof) to accelerate the maturity thereof, then, unless and until such default or event of default shall have been cured or waived or shall have ceased to exist, no payment of principal of, or premium or interest on the Securities, or in respect of any redemption, retirement, purchase or other acquisition of any of the Securities, shall be made by the Company. Page 63
SECTION 14.04. Payments on Securities Permitted. Nothing contained in this Indenture or in any of the Securities shall (i) impair, as between the Company and Holders of Securities, the obligation of the Company to make, or prevent the Company from making, at any time except as provided in Sections 14.02, 14.03 and 14.09, payments of principal of or premium, if any, or interest (including interest accruing subsequent to the commencement of any proceeding for the bankruptcy or reorganization of the Company under any applicable bankruptcy, insolvency or similar law now or hereafter in effect) on the Securities, as and when the same shall become due and payable in accordance with the terms of the Securities, (ii) affect the relative rights of the Holders of the Securities and creditors of the Company other than the holders of the Senior Indebtedness of the Company and the creditors in respect of General Obligations, (iii) prevent the Holder of any Security from exercising all remedies otherwise permitted by applicable law upon default thereunder, subject to the rights, if any, under Article Fourteen of the holders of Senior Indebtedness and the creditors in respect of General Obligations in respect of cash, property or securities of the Company received upon the exercise of such remedy, or (iv) prevent the application by the Trustee or any Paying Agent of any moneys deposited with it hereunder to the payment of or on account of the principal of or premium, if any, or interest on the Securities or prevent the receipt by the Trustee or any Paying Agent of such moneys, if, prior to the second Business Day prior to such deposit, the Trustee or such Paying Agent did not have written notice of any event prohibiting the making of such deposit by the Company. SECTION 14.05. Authorization of Holders to Trustee to Effect Subordination. Each Holder of a Security by his acceptance thereof authorizes and directs the Trustee in his behalf to take such action as may be necessary or appropriate to effectuate the subordination as provided in this Article Fourteen and appoints the Trustee his attorney-in-fact for any and all such purposes. SECTION 14.06. Notice to Trustee. Notwithstanding the provisions of this Article or any other provisions of the Indenture, neither the Trustee nor any Paying Agent shall be charged with knowledge of the existence of any Senior Indebtedness or General Obligations or of any event which would prohibit the making of any payment of moneys to or by the Trustee or such Paying Agent, unless and until a Responsible Officer of the Trustee assigned to its Corporate Trustee Administration Department or such Paying Agent shall have received written notice thereof from the Company or from the holder of any Senior Indebtedness or from the representative of any such holder or from any creditor in respect of General Obligations. SECTION 14.07. Right of Trustee to Hold Senior Indebtedness or General Obligations. The Trustee shall be entitled to all of the rights set forth in this Article in respect of any Senior Indebtedness or General Obligation at any time held by it in its individual capacity to the same extent as any other holder of such Senior Indebtedness or creditor in respect of such General Obligation and nothing in this Indenture shall be construed to deprive the Trustee of any of its rights as such holder or creditor. SECTION 14.08. Article Fourteen Not to Prevent Defaults or Events of Default. The failure to make a payment pursuant to the Securities by reason of any provision in this Article shall not be construed as preventing the occurrence of a Default or an Event of Default. SECTION 14.09. Securities to Rank Pari Passu with Existing Subordinated Indebtedness; Payment of Proceeds in Certain Cases. (i) Subject to the provisions of this Section and to any provisions established or determined with respect to Securities of any series pursuant to Section 3.01, the Securities shall rank pari passu in right of payment with the Existing Subordinated Indebtedness. Page 64
(ii) Upon the occurrence of any of the events specified in the first paragraph of Section 14.02, the provisions of that Section and the corresponding provisions of each indenture (including this Indenture) or other instrument or document establishing or governing the terms of any Existing Subordinated Indebtedness shall be given effect on a pro rata basis to determine the amount of cash, property or securities which may be payable or deliverable as between the holders of Senior Indebtedness, on the one hand, and the Holders of the Securities and holders of Existing Subordinated Indebtedness, on the other hand. (iii) If, after giving effect to the provisions of Section 14.02, and the respective corresponding provisions of each indenture or other instrument or document establishing or governing the terms of any Existing Subordinated Indebtedness on such pro rata basis, any amount of cash, property or securities shall be available for payment or distribution in respect of the Securities ("Excess Proceeds"), and any creditors in respect of General Obligations shall not have received payment in full of all amounts due or to become due on or in respect of such General Obligations (and provision shall not have been made for such payment in money or money's worth), then such Excess Proceeds shall first be applied (ratably with any amount of cash, property or securities available for payment or distribution in respect of any other indebtedness of the Company that by its express terms provides for the payment over of amounts corresponding to Excess Proceeds to creditors in respect or General Obligations) to pay or provide for the payment of the General Obligations remaining unpaid, to the extent necessary to pay all General Obligations in full, after giving effect to any concurrent payment or distribution to or for creditors in respect of General Obligations. Any Excess Proceeds remaining after payment (or provision for payment) in full of all General Obligations shall be available for payment or distribution in respect of the Securities. (iv) In the event that, notwithstanding the foregoing provisions of subsection (iii) of this Section, the Trustee or Holder of any Security shall, in the circumstances contemplated by such subsection, have received any payment or distribution of assets of the Company of any kind or character, whether in cash, property or securities, before all General Obligations are paid in full or payment thereof duly provided for, and if such fact shall, at or prior to the time of such payment or distribution have been made known to the Trustee or, as the case may be, such Holder, then and in such event, subject to any obligation that the Trustee or such Holder may have pursuant to Section 14.02, such payment or distribution shall be paid over or delivered forthwith to the trustee in bankruptcy, receiver, liquidating trustee, custodian, assignee, agent or other Person making payment or distribution of assets of the Company for payment in accordance with subsection (iii). (v) Subject to the payment in full of all General Obligations, the Holder of the Securities shall be subrogated (equally and ratably with the holders of all indebtedness of the Company that by its express terms provides for the payment over of amounts corresponding to Excess Proceeds to creditors in respect of General Obligations and is entitled to like rights of subrogation) to the rights of the creditors in respect of General Obligations to receive payments and distributions of cash, property and securities applicable to the General Obligations until the principal of and interest on the Securities shall be paid in full. For purposes of such subrogation, no payments or distributions to creditors in respect of General Obligations of any cash, property or securities to which Holders of the Securities or the Trustee would be entitled except for the provisions of this Section, and no payments over pursuant to the provisions of this Section to creditors in respect of General Obligations by Holders of Securities or the Trustee, shall, as among the Company, its creditors (other than creditors in respect of General Obligations) and the Holders of Securities be deemed to be a payment or distribution by the Company to or on account of the General Obligations. (vi) The provisions of subsections (iii), (iv) and (v) of this Section are and are intended solely for the purpose of defining the relative rights of the Holders of the Securities, on the one hand, and the creditors in respect of General Obligations, on the other hand, after giving effect to the rights of the holders of Senior Indebtedness, as provided in this Article. Nothing contained in subsections (iii), (iv) and (v) of this Section is intended to or shall affect the relative rights against the Company of the Holders of the Securities and (a) the holders of Senior Indebtedness, (b) the holders of Existing Subordinated Indebtedness or (c) other creditors of the Company other than creditors in respect of General Obligations. Page 65
ARTICLE FIFTEEN REPAYMENT AT THE OPTION OF HOLDERS SECTION 15.01. Applicability of Article. Securities of any series which are repayable at the option of the Holders thereof before their Stated Maturity shall be repaid in accordance with their terms and (except as otherwise specified pursuant to Section 3.01 for Securities of such series) in accordance with this Article. Section 15.02. Repayment of Securities. Each Security which is subject to repayment in whole or in part at the option of the Holder thereof on a Repayment Date shall be repaid at the applicable Repayment Price together with interest accrued to such Repayment Date as specified pursuant to Section 3.01. Section 15.03. Exercise of Option; Notice. Each Holder desiring to exercise such Holder's option for repayment shall, as conditions to such repayment, surrender the Security to be repaid in whole or in part together with written notice of the exercise of such option at any office or agency of the Company in a Place of Payment, not less than 30 nor more than 45 days prior to the Repayment Date; provided, however, that surrender of Bearer Securities together with written notice of exercise of such option shall be made at an office or agency located outside the United States except as otherwise provided in Section 5.02. Such notice, which shall be irrevocable, shall specify the principal amount of such Security to be repaid, which shall be equal to the minimum authorized denomination for such Security or an integral multiple thereof, and shall identify the Security to be repaid and, in the case of a partial repayment of the Security, shall specify the denomination or denominations of the Security or Securities of the same series to be issued to the Holder for the portion of the principal of the Security surrendered which is not to be repaid. If any Bearer Security surrendered for repayment shall not be accompanied by all unmatured coupons and all matured coupons in default, such Bearer Security may be paid after deducting from the Repayment Price an amount equal to the face amount of all such missing coupons, or the surrender of such missing coupon or coupons may be waived by the Company and the Trustee if there be furnished to them such security or indemnity as they may require to save each of them and any Paying Agent harmless. If thereafter the Holder of such Bearer Security shall surrender to the Trustee or any Paying Agent any such missing coupon in respect of which a deduction shall have been made from the Repayment Price, such Holder shall be entitled to receive the amount so deducted without interest thereon; provided, however, that interest represented by coupons shall be payable only at an office or agency located outside the United States except as otherwise provided in Section 5.02. The Company shall execute and the Trustee shall authenticate and deliver without service charge to the Holder of any Registered Security so surrendered a new Registered Security or Securities of the same series and tenor of any authorized denomination specified in the foregoing notice, in an aggregate principal amount equal to any portion of the principal of the Registered Security so surrendered which is not to be repaid. The Company shall execute and the Trustee shall authenticate and deliver without service charge to the Holder of any Bearer Security so surrendered a new Registered Security or Securities or new Bearer Security or Securities (and all appurtenant unmatured coupons and matured coupons in default) or any combination thereof of the same series and tenor of any authorized denomination or denominations specified in the foregoing notice, in an aggregate principal amount equal to any portion of the principal of the Security so surrendered which is not to be paid; provided, however, that the issuance of a Registered Security therefor shall be subject to applicable laws and regulations, including provisions of the United States federal income tax laws and regulations in effect at the time of the exchange; neither the Company, the Trustee nor the Security Registrar shall issue Registered Securities for Bearer Securities if it has received an Opinion of Counsel that as a result of such issuance the Company would suffer adverse consequences under the United States federal income tax laws Page 66
then in effect and the Company has delivered to the Trustee a Company Order directing the Trustee not to make such issuances thereafter unless and until the Trustee receives a subsequent Company Order to the contrary. The Company shall deliver copies of such Company Order to the Security Registrar. For all purposes of this Indenture, unless the context otherwise requires, all provisions relating to the repayment of Securities shall relate, in the case of any Security repaid or to be repaid only in part, to the portion of the principal of such Security which has been or is to be repaid. Section 15.04. Election of Repayment by Remarketing Entities. The Company may elect, with respect to Securities of any series which are repayable at the option of the Holders thereof before their Stated Maturity, at any time prior to any Repayment Date to designate one or more Remarketing Entities to purchase, at a price equal to the Repayment Price, Securities of such series from the Holders thereof who give notice and surrender their Debt Securities in accordance with Section 15.03. Section 15.05. Securities Payable on the Repayment Date. Notice of exercise of the option of repayment having been given and the Securities so to be repaid having been surrendered as aforesaid, such Securities shall, unless purchased in accordance with Section 15.04, on the Repayment Date become due and payable at the price therein specified and from and after the Repayment Date such Securities shall cease to bear interest and shall be paid on the Repayment Date, and the coupons for such interest appertaining to Bearer Securities so to be repaid, except to the extent provided above, shall be void, unless the Company shall default in the payment of such price, in which case the Company shall continue to be obligated for the principal amount of such Securities and shall be obligated to pay interest on such principal amount at the rate prescribed therefor by such Securities from time to time until payment in full of such principal amount. ARTICLE SIXTEEN Meetings of Holders of Securities Section 16.01. Purposes for Which Meetings May Be Called. If Securities of a series are issuable in whole or in part as Bearer Securities, a meeting of Holders of Securities of such series may be called at any time and from time to time pursuant to this Article to make, give or take any request, demand, authorization, direction, notice, consent, waiver or other Act provided by this Indenture to be made, given or taken by Holders of Securities of such series. Section 16.02. Call, Notice and Place of Meetings. (i) The Trustee may at any time call a meeting of Holders of Securities of any series issuable as Bearer Securities for any purpose specified in Section 16.01, to be held at such time and at such place in the City of Chicago, Illinois, the Borough of Manhattan, The City of New York, or in London as the Trustee shall determine. Notice of every meeting of Holders of Securities of any series, setting forth the time and the place of such meeting and in general terms the action proposed to be taken at such meeting, shall be given, in the manner provided in Section 1.06, not less than 21 nor more than 180 days prior to the date fixed for the meeting. (ii) In case at any time the Company, pursuant to a Board Resolution, or the Holders of at least 10% in principal amount of the Outstanding Securities of any series shall have requested the Trustee to call a meeting of the Holders of Securities of such series for any purpose specified in Section 16.01, by written request setting forth in reasonable detail the action proposed to be taken at the meeting, and the Trustee shall not have made the first publication of the notice of such meeting within 21 days after receipt of such request or shall not thereafter proceed to cause the meeting to be held as provided herein, then the Company or the Holders of Securities of Page 67
such series in the amount above specified, as the case may be, may determine the time and the place in the City of Chicago, Illinois, the Borough of Manhattan, The City of New York, or in London for such meeting and may call such meeting for such purposes by giving notice thereof as provided in subsection (i) of this Section. Section 16.03. Persons Entitled to Vote at Meetings. To be entitled to vote at any meeting of Holders of Securities of any series, a Person shall be (1) a Holder of one or more Outstanding Securities of such series, or (2) a Person appointed by an instrument in writing as proxy for a Holder or Holders of one or more Outstanding Securities of such series by such Holder or Holders. The only Persons who shall be entitled to be present or to speak at any meeting of Holders of Securities of any series shall be the Persons entitled to vote at such meeting and their counsel, any representatives of the Trustee and its counsel and any representatives of the Company and its counsel. Section 16.04. Quorum; Action. The Persons entitled to vote a majority in principal amount of the Outstanding Securities of a series shall constitute a quorum for a meeting of Holders of Securities of such series; provided, however, that if any action is to be taken at such meeting with respect to a consent or waiver which this Indenture expressly provides may be given by the Holders of a greater percentage in principal amount of the Outstanding Securities of a series, the Persons entitled to vote such greater percentage in principal amount of the Outstanding Securities of such series shall constitute a quorum. In the absence of a quorum within 30 minutes of the time appointed for any such meeting, the meeting shall, if convened at the request of Holders of Securities of such series, be dissolved. In the absence of a quorum in any other case the meeting may be adjourned for a period of not less than 10 days as determined by the chairman of the meeting prior to the adjournment of such meeting. In the absence of a quorum at any such adjourned meeting, such adjourned meeting may be further adjourned for a period of not less than 10 days as determined by the chairperson of the meeting prior to the adjournment of such adjourned meeting. Notice of the reconvening of any adjourned meeting shall be given as provided in Section 16.02(i), except that such notice need be given only once not less than five days prior to the date on which the meeting is scheduled to be reconvened. Notice of the reconvening of an adjourned meeting shall state expressly the percentage, as provided above, of the principal amount of the Outstanding Securities of such series which shall constitute a quorum. Except as limited by the provisos to Section 9.02, any resolution presented to a meeting or adjourned meeting duly reconvened at which a quorum is present as aforesaid may be adopted only by the affirmative vote of the Holders of a majority in principal amount of the Outstanding Securities of the series; provided, however, that, except as limited by the provisos to Section 9.02, any resolution with respect to any consent or waiver which this Indenture expressly provides may be given by the Holders of a greater percentage in principal amount of the Outstanding Securities of a series may be adopted at a meeting or an adjourned meeting duly reconvened and at which a quorum is present as aforesaid only by the affirmative vote of the Holders of such greater percentage in principal amount of the Outstanding Securities of that series; and provided, further, that, except as limited by the provisos to Section 9.02, any resolution with respect to any request, demand, authorization, direction, notice, consent, waiver or other Act which this Indenture expressly provides may be made, given or taken by the Holders of a specified percentage, which is less than a majority, in principal amount of the Outstanding Securities of a series may be adopted at a meeting or an adjourned meeting duly reconvened and at which a quorum is present as aforesaid by the affirmative vote of the Holders of such specified percentage in principal amount of the Outstanding Securities of that series. Any resolution passed or decision taken at any meeting of Holders of Securities of any series duly held in accordance with this Section shall be binding on all the Holders of Securities of such series and the related coupons, whether or not present or represented at the meeting. Page 68
Section 16.05. Determination of Voting Rights; Conduct and Adjournment of Meetings. (a) Notwithstanding any other provisions of this Indenture, the Trustee may make such reasonable regulations as it may deem advisable for any meeting of Holders of Securities of such series in regard to proof of the holding of Securities of such series and of the appointment of proxies and in regard to the appointment and duties of inspectors of votes, the submission and examination of proxies, certificates and other evidence of the right to vote, and such other matters concerning the conduct of the meeting as it shall deem appropriate. Except as otherwise permitted or required by any such regulations, the holding of Securities shall be proved in the manner specified in Section 1.04 and the appointment of any proxy shall be proved in the manner specified in Section 1.04 or, in the case of Bearer Securities, by having the signature of the person executing the proxy witnessed or guaranteed by any trust company, bank or banker authorized by Section 1.04 to certify to the holding of Bearer Securities. Such regulations may provide that written instruments appointing proxies, regular on their face, may be presumed valid and genuine without the proof specified in Section 1.04 or other proof. (b) The Trustee shall, by an instrument in writing, appoint a temporary chairperson of the meeting, unless the meeting shall have been called by the Company or by Holders of Securities as provided in Section 16.02(ii), in which case the Company or the Holders of Securities of the series calling the meeting, as the case may be, shall in like manner appoint a temporary chairperson. A permanent chairperson and a permanent secretary of the meeting shall be elected by vote of the Persons entitled to vote a majority in principal amount of the Outstanding Securities of such series represented at the meeting. (c) At any meeting each Holder of a Security of such series or proxy shall be entitled to one vote for each $1,000 principal amount (or the equivalent in ECU, any other composite currency or a Foreign Currency) of Securities of such series held or represented by him; provided, however, that no vote shall be cast or counted at any meeting in respect of any Security challenged as not Outstanding and ruled by the chairperson of the meeting not to be Outstanding. The chairperson of the meeting shall have no right to vote, except as a Holder of a Security of such series or proxy. (d) Any meeting of Holders of Securities of any series duly called pursuant to Section 16.02 at which a quorum is present may be adjourned from time to time by Persons entitled to vote a majority in principal amount of the Outstanding Securities of such series represented at the meeting; and the meeting may be held as so adjourned without further notice. Section 16.06. Counting Votes and Recording Action of Meetings. The vote upon any resolution submitted to any meeting of Holders of Securities of any series shall be by written ballots on which shall be subscribed the signatures of the Holders of Securities of such series or of their representatives by proxy and the principal amounts and serial numbers of the Outstanding Securities of such series held or represented by them. The permanent chairperson of the meeting shall appoint two inspectors of votes who shall count all votes cast at the meeting for or against any resolution and who shall make and file with the secretary of the meeting their verified written reports in triplicate of all votes cast at the meeting. A record, at least in triplicate, of the proceedings of each meeting of Holders of Securities of any series shall be prepared by the secretary of the meeting and there shall be attached to said record the original reports of the inspectors of votes on any vote by ballot taken thereat and affidavits by one or more persons having knowledge of the facts setting forth a copy of the notice of the meeting and showing that said notice was given as provided in Section 16.02 and, if applicable, Section 16.04. Each copy shall be signed and verified by the affidavits of the permanent chairperson and secretary of the meeting and one such copy shall be delivered to the Company, and another to the Trustee to be preserved by the Trustee, the latter to have attached thereto the ballots voted at the meeting. Any record so signed and verified shall be conclusive evidence of the matters therein stated. Page 69
ARTICLE SEVENTEEN MISCELLANEOUS SECTION 17.01. Counterparts. This Indenture may be executed in any number of counterparts, each of which shall be an original; but such counterparts shall together constitute but one and the same instrument. The Chase Manhattan Bank (National Association) hereby accepts the trusts in this Indenture declared and provided, upon the terms and conditions hereinabove set forth. * * * * IN WITNESS WHEREOF, the parties hereto have caused this Indenture to be duly executed, and their respective corporate seals to be hereunto affixed and attested, all as of the day and year first above written. First Chicago NBD Corporation BY________________________________ Senior Vice President and Treasurer Attest: [CORPORATE SEAL] _________________________ Assistant Secretary The Chase Manhattan Bank (National Association), as Trustee BY________________________________ Attest: _________________________ Assistant Secretary Page 70
) State of Illinois, ) ss.: County of Cook ) ) On this day of , 1995, before me personally came , to me known, who, being by me duly sworn, did depose and say that he resides at Chicago, Illinois; that he is Senior Vice President and Treasurer of FIRST CHICAGO NBD CORPORATION, one of the corporations described in and which executed the foregoing instrument; that he knows the corporate seal of said corporation; that the seal affixed to said instrument is such corporate seal; that it was so affixed by authority of the Board of Directors of said corporation; and that he signed his name thereto by like authority. [Notarial Seal] ------------------------------ Notary Public ) State of , ) ss.: County of ) ) On this day of , 1995, before me personally appeared , to me known, who, being by me duly sworn, did depose and say that he resides at ; that he is a of The Chase Manhattan Bank (National Association), one of the parties described in and which executed the foregoing instrument; and that he signed his name by authority of the Board of Directors of said association. [Notarial Seal] --------------------------- Notary Public Page 71
EXHIBIT A FORM OF CERTIFICATE TO BE GIVEN BY PERSON ENTITLED TO RECEIVE BEARER SECURITY CERTIFICATE [Insert title or sufficient description of Securities to be delivered] This is to certify that the above-captioned Securities are not being acquired by or on behalf of a United States person, or, if a beneficial interest in the Securities is being acquired by or on behalf of a United States person, that such United States person is a financial institution within the meaning of Section 1.165-12(c)(1)(v) of the United States Treasury regulations which agrees to comply with the requirements of Section 165(j)(3)(A), (B) or (C) of the Internal Revenue Code of 1986, as amended and the regulations thereunder. If the undersigned is a dealer, the undersigned agrees to obtain a similar certificate from each person entitled to delivery of any of the above-captioned Securities in bearer form purchased from it; provided, however, that, if the undersigned has actual knowledge that the information contained in such a certificate is false, the undersigned will not deliver a Security in temporary or definitive bearer form to the person who signed such certificate notwithstanding the delivery of such certificate to the undersigned. As used herein, "United States person" means any citizen or resident of the United States, any corporation, partnership or other entity created or organized in or under the laws of the United States and any estate or trust the income of which is subject to United States Federal income taxation regardless of its source, and "United States" means the United States of America (including the States and the District of Columbia), its territories, its possessions and other areas subject to its jurisdiction. We undertake to advise you by telex if the above statement as to beneficial ownership is not correct on the date of delivery of the above-captioned Securities in bearer form as to all of such Securities. We understand that this certificate is required in connection with certain tax legislation in the United States. If administrative or legal proceedings are commenced or threatened in connection with which this certificate is or would be relevant, we irrevocably authorize you to produce this certificate or a copy thereof to any interested party in such proceedings. Dated:_____, 19___ [To be dated no earlier than 15 days prior to the Exchange Date] [Name of Person Entitled to Receive Bearer Security] -------------------------------------- (Authorized Signatory) Name: Title: Page 72
EXHIBIT B FORM OF CERTIFICATE TO BE GIVEN BY EUROCLEAR AND CEDEL S.A. IN CONNECTION WITH THE EXCHANGE OF A PORTION OF A TEMPORARY GLOBAL SECURITY CERTIFICATE [Insert title or sufficient description of Securities to be delivered] This is to certify with respect to $_________ principal amount of the above- captioned Securities (i) that we have received from each of the persons appearing in our records as persons entitled to a portion of such principal amount (our "Qualified Account Holders") a certificate with respect to such portion substantially in the form attached hereto, and (ii) that we are not submitting herewith for exchange any portion of the temporary global Security representing the above-captioned Securities excepted in such certificates. We further certify that as of the date hereof we have not received any notification from any of our Qualified Account Holders to the effect that the statements made by such Qualified Account Holders with respect to any portion of the part submitted herewith for exchange are no longer true and cannot be relied upon as of the date hereof. Dated: ________, 19___ [To be dated no earlier than the Exchange Date] [MORGAN GUARANTY TRUST COMPANY OF NEW YORK, Brussels Office, as Operator of the Euro-clear System] [CEDEL S.A.] By ___________________________________ Page 73
EXHIBIT C FORM OF CERTIFICATE TO BE GIVEN BY EUROCLEAR AND CEDEL S.A. TO OBTAIN INTEREST PRIOR TO AN EXCHANGE DATE CERTIFICATE [Insert title or sufficient description of Securities] This is to certify that, as of the Interest Payment Date on [Insert Date], the undersigned, which is a holder of an interest in the temporary global Security representing the above Securities, is not a United States person. As used herein, "United States person" means any citizen or resident of the United States, any corporation, partnership or other entity created or organized in or under the laws of the United States and any estate or trust the income of which is subject to United States Federal income taxation regardless of its source, and "United States" means the United States of America (including the States and the District of Columbia), its territories, its possessions and other areas subject to its jurisdiction. We confirm that the interest payable on such Interest Payment Date will be paid to each of the persons appearing in our records as being entitled to interest to be paid on the above date from whom we have received a written certification dated not earlier than 15 days prior to such Interest Payment Date to the effect that the beneficial owner of such portion with respect to which interest is to be paid on such date either is not a United States person or is a United States person which is a financial institution which has provided an Internal Revenue Service Form W-9 or is an exempt recipient as defined in United States Treasury Regulations (S) 1.6049-4(c)(1)(ii). We undertake to retain certificates received from our member organizations in connection herewith for four years from the end of the calendar year in which such certificates are received. The foregoing reflects any advice received subsequent to the date of any certificate stating that the statements contained in such certificate are no longer correct. Dated:______, 19____ [To be dated on or after the relevant Interest Payment Date] [MORGAN GUARANTY TRUST COMPANY OF NEW YORK, Brussels Office, as Operator of the Euro-clear System] [CEDEL S.A.] By____________________________________ Page 74
EXHIBIT D FORM OF CERTIFICATE TO BE GIVEN BY BENEFICIAL OWNERS TO OBTAIN INTEREST PRIOR TO AN EXCHANGE DATE CERTIFICATE [Insert title or sufficient description of Securities] This is to certify that as of the date hereof, no portion of the temporary global Security representing the above-captioned Securities and held by you for our account is beneficially owned by a United States person or, if any portion thereof held by you for our account is beneficially owned by a United States person, such United States person is a financial institution within the meaning of Section 1.165-12(c)(1)(v) of the United States Treasury regulations which agrees to comply with Section 165(j)(3)(A), (B) or (C) of the Internal Revenue Code of 1986, as amended and the regulations thereunder, and certifies that either it has provided an Internal Revenue Service Form W-9 or is an exempt recipient as defined in Section 1.6049-4(c)(1)(ii) of the United States Treasury regulations. As used herein, "United States person" means any citizen or resident of the United States, any corporation, partnership or other entity created or organized in or under the laws of the United States and any estate or trust the income of which is subject to United States Federal income taxation regardless of its source, and "United States" means the United States of America (including the States and the District of Columbia), its territories, its possessions and other areas subject to its jurisdiction. We undertake to advise you by telex if the above statement as to beneficial ownership is not correct on the Interest Payment Date on [Insert Date] as to any such portion of such temporary global Security. We understand that this certificate is required in connection with certain tax legislation in the United States. If administrative or legal proceedings are commenced or threatened in connection with which this certificate is or would be relevant, we irrevocably authorize you to produce this certificate or a copy thereof to any interested party in such proceedings. Dated:________, 19____ [To be dated on or after the 15th day before the relevant Interest Payment Date] [Name of Account Holder] -------------------------------------- (Authorized Signatory) Name: Title: Page 75
EXHIBIT-10.1 THE CHASE MANHATTAN CORPORATION DEFERRED COMPENSATION PLAN FOR NON-EMPLOYEE DIRECTORS (As amended and restated December 1996) 1. Definitions - The following are defined terms wherever they appear in the Plan. 1.1 "Administrator" shall mean the Secretary, or such other person or committee appointed by the Chief Executive Officer of the Corporation, responsible for those functions assigned to the Administrator under the Plan. 1.2 "Bank" shall mean The Chase Manhattan Bank. 1.3 "Board of Directors" shall mean the Board of Directors of the Corporation or the Bank. 1.4 "Corporation" shall mean The Chase Manhattan Corporation. 1.5 "Deferred Compensation Account" or "Account" shall mean the separate account established under the Plan for each Participant as described in Section 3.1. 1.6 "Director" shall mean a member of the Board of Directors of the Corporation or the Board of Directors of the Bank who is not also an employee (or former employee) of the Corporation or the Bank. 1.7 "Participant" shall mean each Director who participates in the Plan in accordance with the terms and conditions of the Plan. 1.8 "Plan" shall mean the Deferred Compensation Plan for Non-Employee Directors of The Chase Manhattan Corporation and The Chase Manhattan Bank, as amended from time to time. 1.9 "Stock" shall mean the Common Stock of the Corporation, $1.00 par value per share. 1.10 "Valuation Date" shall mean the close of business on the last business day of each calendar quarter. 1.11 "Subsidiary" shall mean any corporation which at the time qualifies as a subsidiary of the Corporation under the definition of "subsidiary corporation" in Section 425(f) of the Internal Revenue Code, as amended from time to time. 2 2. Participation. 2.1 Eligibility. Each Director is eligible to participate in the Plan.
2.2 Participation in the Plan; Termination of Participation. (a) An individual may elect to participate by delivering a properly executed election form to the Administrator. The election form shall specify: (1) the amount, by percentage or by dollar amount, of cash compensation and/or the amount (but not less than all) of Stock compensation to be deferred; (2) the allocation of deferred cash compensation among the forms of hypothetical investment of such deferred compensation; (3) the manner in which deferred compensation is to be paid; (4) the date or dates for payment of deferred compensation; and (5) the manner of payment of deferred compensation to a Participant's estate in the event of death before complete distribution of deferred compensation. (b) The effective date for participation in the Plan by an individual who is a Director shall be the first day of the calendar year next beginning after the date that the Administrator receives the individual's election to participate in the Plan. The effective date of participation in the Plan for an individual who is not a Director shall be the date that he becomes a Director if the Administrator has received an election to participate in the Plan prior to that date. (c) A Participant may elect to terminate participation in the Plan by delivering written notice to the Administrator. The effective date for termination shall be the date specified by the Participant in the notice of termination (but not earlier than the date of such notice). (d) The deferral of a Participant's compensation shall begin or end, as appropriate, as of the effective date of the Participant's election to participate or of the Participant's notice to terminate participation, as appropriate, described in paragraphs (b) and (c) above. 2.3 Term of Election of Deferral; Modification or Termination of Election of Deferral. (a) An election to defer compensation, or to modify a prior election to defer compensation, must be made by the Participant prior to the commencement of the period during which the compensation is earned or to which the compensation relates and shall continue in effect until modified or terminated by the Participant or until the Participant ceases to be eligible to participate in the Plan. A Participant may at any time modify 2 3 or terminate an election to defer compensation, but in each case only once in any 12-month period. (b) A termination of an election to defer compensation shall apply prospectively only and shall not affect previously deferred compensation. A Participant who terminates an election to defer compensation is not eligible to participate in the Plan again until 12 months after the date that the Participant's election to terminate becomes effective under Section 2.2. 3. Compensation Deferred. 3.1 Deferred Compensation Account. (a) A Deferred Compensation Account shall be established for each Participant. The Account shall consist of two parts: (1) cash compensation deferred by a Participant under the Plan, along with hypothetical income (or losses) on this compensation (the "Cash Account") and (2) compensation in the form of Stock plus Stock credited to Participant as a result of the hypothetical reinvestment of hypothetical dividends on such Stock compensation (the "Stock Account"). The amount of cash deferred (plus income or less losses) shall be credited to the Participant's Cash Account. The number of shares of Stock deferred, plus Stock resulting from the hypothetical reinvestment of hypothetical dividends on deferred Stock compensation, shall be credited to the Participant's Stock Account. (b) Deferred cash compensation shall
be credited to the Participant's Cash Account as of the last day of the month during which such cash compensation was otherwise payable to the Participant. For purposes of hypothetical investment of cash compensation under Section 3.3, however, deferred cash compensation shall not be considered to be hypothetically invested until the first day of the calendar quarter next following the date that such compensation is credited to the Participant's Cash Account and shall not begin to earn income until the first day of such quarter. (c) Deferred Stock compensation shall be credited annually to the Participant's Stock Account as of December 1 or such other date as may be specified by the Board of Directors for the payment of Stock compensation. 3.2 Amount of Deferral. A Participant may elect to defer receipt of all or a specified portion, by percentage or by dollar amount, of compensation otherwise payable in cash and/or all (but not a portion of) compensation payable in Stock to the Participant for services as a Director or as a member of a committee of the Board of Directors of the Corporation or the Bank or as a member of any advisory board of the Corporation, the Bank or any subsidiary of the Corporation or the Bank. For these purposes, compensation shall include, but shall not be limited to, Directors' fees (whether in cash or Stock), retainers, meeting fees, fees for committees or other similar forms of remuneration, but shall not include direct reimbursement of expenses. 3.3 Hypothetical Investment of Cash. Deferred cash compensation is assumed to be invested, without charge, in one or more of the investment equivalents made available from time to time hereunder. Descriptions of investment equivalents available under the Plan shall be provided to each Participant on or prior to the Participant making an allocation or reallocation of investment equivalents into which any deferred cash payments are to be allocated or reallocated. 3.4 Time of Hypothetical Investment of Cash. The amount of cash in the Participant's Cash Account on each Valuation Date which has not been previously invested shall be deemed invested in a hypothetical investment on that Valuation Date based on the value of the hypothetical investment on that date. 3.5 Allocation of Hypothetical Investments of Cash; Reallocation of Hypothetical Investments of Cash. (a) A Participant may allocate the balance of the Participant's Cash Account to one or more hypothetical investments. The allocation shall be selected by the Participant. (b) A Participant may at any time prospectively change the allocation of the hypothetical investment of future deferred cash compensation. The reallocation of such future deferred compensation may be made only once in a 12-month period and shall be effective as of, and shall be based upon values in effect on, the Valuation Date which is coincident with or next following the date that the Administrator receives the Participant's written notification of the reallocation. (c) A Participant may at any time also reallocate among the hypothetical investments any cash compensation previously deferred by the Participant and then credited to the Participant's Cash Account. This reallocation is in addition to the reallocation described in paragraph (b) above and may be made only once in a 12-month period. The reallocation shall be effective as of, and based upon values in effect on, the Valuation Date which is coincident with or next following
the date that the Administrator receives the Participant's written notification of the reallocation. 3.6 Hypothetical Dividends on Deferred Stock. Dividends shall be deemed to have been paid on Stock allocated to a Participant's Stock Account as if such allocated Stock were actual shares of Stock issued and outstanding on the record date for dividends on Stock. Such hypothetical dividends shall be converted into deferred shares of Stock and shall be credited to a Participant's Stock Account quarterly on each payment date in the amount of such hypothetical dividends divided by the average of the high and low selling price of one share of Stock as reported in the New York Stock Exchange Composite Transactions on such payment date. Fractional shares shall be credited to a Participant's Stock Account cumulatively, but the balance of shares of Stock in a Participant's Stock Account shall be rounded to the next highest whole share in the event of any issuance and distribution of Stock to such Participant pursuant to Section 4.1. The number of shares of Stock in a Participant's Stock Account shall be adjusted to reflect stock dividends, splits and reclassifications. 3.7 Balance of Deferred Compensation Account. The balance of each Participant's Deferred Compensation Account shall include: (1) cash compensation deferred by the Participant and income (or losses) from the hypothetical investment of this compensation credited to the Participant's Cash Account and (2) Stock compensation deferred by the Participant and credited to the Participant's Stock Account and any additional Stock credited to the Participant's Stock Account from the investment of dividends deemed paid on such Stock compensation. The balance of each Participant's Deferred Compensation Account, and the income or losses attributable to the Account since the last Valuation Date, shall be determined as of each Valuation Date. 3.8 Statement of Account. A statement shall be sent to each Participant as to the balance of the Participant's Deferred Compensation Account at least once a calendar year. 4. Payment of Deferred Compensation. 4.1 Payment of Deferred Compensation. Upon termination of services as a Director, the balance of the Participant's Deferred Compensation Account shall (subject to Section 4.2) be paid to the Participant in the manner and at the time selected by the Participant prior to the date of such termination. For purposes of payment, the balance of the Participant's Account shall be valued as of the Valuation Date coincident with or immediately preceding the date that the balance, or the particular installment thereof, is to be paid, but the balance of the Participant's Account shall include all compensation deferred by the Participant since the last Valuation Date. 4.2 Elections Pertaining to Payments. The Participant may elect the manner of payment of the balance of the Participant's Deferred Compensation Account, whether in the Cash or Stock Account, including the dates of periodic payments over a specified period of years or the date of a lump sum distribution, provided that: (a) If the payment provides for installments, the payments shall be made at least annually and not more frequently
than quarterly and shall be payable for a period not to exceed 15 years; (b) Except as provided in paragraph (d) below, no payments may be made prior to the first day of the calendar year following the calendar year during which the Participant terminates services as a Director unless the payment is made pursuant to Section 4.4 or Section 4.5; (c) No payments from any Participant's Stock Account shall be payable otherwise than in shares of Stock; and (d) No payments from any Participant's Cash Account shall be payable otherwise than in cash. 4.3 Modifications of Elections Pertaining to Payments. A Participant may at any time prior to the date that the Participant's service as a Director is terminated modify previous elections pertaining to: (1) the date or dates and the manner in which the balance of the Participant's Deferred Compensation Account is to be paid and (2) the manner of payment of the balance of the Participant's Deferred Compensation Account in the event of the Participant's death. 4.4 Payments to a Deceased Participant's Estate or Beneficiaries. (a) A Participant may elect by notice to the Administrator that in the event of the Participant's death, any balance in the Participant's Deferred Compensation Account shall be paid (i) to beneficiaries, named by the Participant, provided that if no such election is made, payment shall be to the Participant's estate; and (ii) in the same manner as provided with respect to the Participant, provided that if no such election is made the balance of the Participant's Deferred Compensation Account shall be determined as of the Valuation Date coincident with or immediately following the Participant's death and this amount shall be paid in a single payment to the Participant's estate as soon as reasonably practicable thereafter. (b) In the event of a Participant's election to have Deferred Compensation payments made in installments following the death of such Participant, the Administrator may, upon consideration of the application of the duly appointed administrator or executor of the Participant's estate, or such beneficiaries as have been named by the Participant, direct that the balance of the Participant's Deferred Compensation Account be paid in a single payment. The payment shall be made at the time specified by the Administrator. 4.5 Unforeseeable Emergency. A Participant may request the Administrator to make payment in the care of an unforeseeable emergency. For purposes of this Plan, an unforeseeable emergency is severe financial hardship to the Participant resulting from a sudden and unexpected illness or accident of the Participant or of a dependent (as defined by relevant provisions of law) of the Participant, loss of the Participant's property due to casualty, or other similar extraordinary and unforeseeable circumstances arising as a result of events beyond the control of the Participant. The circumstances that will constitute an unforeseeable emergency will depend upon the facts of each case, but, in any case, payment may not be made to the extent that such hardship is or may be relieved (i) through reimbursement or compensation by insurance or otherwise, (ii) by liquidation of the Participant's assets, to the extent the liquidation of such assets would not itself cause severe financial hardship, or (iii) by cessation of deferrals under the Plan. Examples of what are not considered to be unforeseeable emergencies include the need to send a Participant's child to college or the desire to purchase a home. Withdrawals of
amounts because of an unforeseeable emergency must only be permitted to the extent reasonably needed to satisfy the emergency need. 5. General Provisions. 5.1 Participant's Rights Unsecured. The right of any Participant to receive future payments of cash or Stock under the provisions of the Plan shall be an unsecured claim against the general assets of the Corporation or the Bank, as appropriate. 5.2 Assignability. No right to receive payments or distributions under the Plan shall be transferable or assignable by a Participant, except by will, by the laws of descent and distribution or by a court of competent jurisdiction. Any other attempted assignment or alienation of payments under the Plan shall be void and of no force or effect. 5.3 Administration. Except as otherwise provided herein, the Plan shall be administered by the Administrator, who shall have the authority to adopt rules and regulations for carrying out the Plan and who shall interpret, construe and implement the provisions of the Plan. 5.4 Amendment. The Plan may at any time or from time to time be amended, modified or terminated by the Corporation and/or the Bank, provided that no 7 8 amendment, modification or termination (a) shall, without the consent of the Participant and the approval of the Board of Directors, adversely affect the balance of a Participant's Deferred Compensation Account at that time or (b) permit payment of the balance of a Participant's Deferred Compensation Account prior to the date of payment specified in Section 4.2 (except for payments provided in Section 4.4 or Section 4.5). 5.5 Legal Opinions. The Administrator may consult with legal counsel, who may be counsel for the Corporation or other counsel, with respect to the Administrator's obligations or duties hereunder, or with respect to any action, proceeding or any question of law, and shall not be liable with respect to any action taken or omitted to be taken, by the Administrator in good faith pursuant to the advice of such counsel. 5.6 Liability. Any decision made or action taken by the Board of Directors, the Administrator, or any employee of the Corporation or any of its subsidiaries arising out of or in connection with the construction, administration, interpretation or effect of the Plan shall be within their or its absolute discretion and shall be conclusive and binding on all parties. Neither the Administrator nor any member of the Board of Directors, and no employee of the Corporation or of any of its subsidiaries, shall be liable for any act or action hereunder, whether of omission or commission, except in circumstances involving bad faith, or for any act of any other member or employee or of any agent to whom duties in connection with the administration of the Plan have been delegated. 5.7 Construction. The singular shall include the plural, where appropriate.
Exhibit 10.2 THE CHASE MANHATTAN CORPORATION Post-Retirement Compensation Plan for Non-Employee Directors (As amended and restated effective May 21, 1996.) SECTION 1. Plan. This plan is the Chase Manhattan Corporation Post-Retirement Compensation Plan for Non-Employee Directors. SECTION 2. Definitions. For purposes of the Plan, the following terms shall have the meanings specified below: "Administrator" shall mean the person appointed by the Chief Executive Officer of the Corporation to administer the Plan. "Board" shall mean the Board of Directors of the Corporation. "Common Stock" shall mean the shares of common stock, par value $1 per share, of the Corporation. "Corporation" shall mean The Chase Manhattan Corporation, a Delaware corporation. "Director" shall mean a person serving as a director of the Corporation. "Fair Market Value" shall mean the mean between the high and low selling prices of Common Stock on the date as of which such value is being determined. "Outside Director" shall mean any Director of the Corporation who has never been an employee or officer of the Corporation or a Subsidiary. "Participant" shall have the meaning assigned to such term in Section 3. "Subsidiary" shall mean any corporation which at the time qualifies as a subsidiary of the Corporation under the definition of "subsidiary corporation" in Section 425(f) of the Internal Revenue Code of 1986, as the same may be amended from time to time. "Unit" shall mean a unit which is equal in value to the Fair Market Value of a share of Common Stock. SECTION 3. Participants. Effective as of May 21, 1996, the term "Participant" shall be limited to those Outside Directors who were participating in the Plan and on such date, the Plan shall be frozen, and no further amounts shall accrue in respect of any Participant, except as set forth in Section 4(b). 1
SECTION 4. Compensation. (a) Commencing upon a Participant's retirement, resignation or removal from service as a Director on the Board, or any failure of a Participant to be reelected as a Director after accepting a nomination for election, in each case (i) after attaining the age of 70 (or such other age as may be established from time to time by the Board as the retirement age), (ii) with the consent of the Board or (iii) because of disability or health reasons, the Corporation shall pay on May 1 of each year (or on such other date or dates as the Administrator shall so designate in his sole discretion) during the Participant's lifetime to each Participant an amount equal to the dollar value of the annual retainer fee (such dollar value to be determined by the Administrator from time to time) payable to Directors of the Corporation at the date the Participant retires, resigns, or is removed from service as a Director or is not reelected as a Director after accepting a nomination for election, which amount shall be not less than $25,000 for Participants ceasing to serve the Corporation in the capacity of Director on or after January 1, 1990; provided, however, such amount shall be reduced for each Participant with fewer than ten years of service to the Board as an Outside Director by ten percent for each year, or part thereof, less than ten years of service. In calculating the number of years a Participant has served on the Board, all years served prior to the effectiveness of this Plan and for Participants who were Directors of Manufacturers Hanover Corporation or who were Directors of The Chase Manhattan Corporation at the time of its merger with Chemical Banking Corporation, all years such Participants had served as directors of such corporation prior to becoming Directors of the Corporation. shall be included in the calculation. (b) For purposes of determining the amount payable hereunder to any Participant retiring, resigning or being removed on or after May 20, 1996, the following rules shall apply: (i) any Participant retiring, resigning or being removed on May 20, 1996, shall be permitted to elect to (A) receive the compensation set forth in Section 4(a), except that the age specified in Section 4(a) (i) shall be 65 and such Participant shall be deemed to have performed ten years of service to the Board as an Outside Director (regardless of his or her actual years of service); or (B) be treated in the manner set forth in Section 4(b) (ii) below; (ii) any Participant retiring, resigning, being removed or otherwise terminating service as an Outside Director after May 20, 1996 shall, in lieu of the compensation payable under this Section 4(a), receive an amount determined pursuant to Section 5; provided that in determining the amount to be initially credited to the Participant's account under Section 5, each Participant shall be considered to have performed ten years of service to the Board as an Outside Director (regardless of his or her actual years of service). SECTION 5. Deferred Account. (a) The compensation otherwise payable under Section 4(a) to Participants described in Section 4(b) (ii) or electing to be so treated under the provisions of Section 4(b) (i) shall be converted to a present value dollar amount, based on actuarial assumptions satisfactory to the Administrator, and such dollar amount converted into a number of Units by dividing such dollar amount by 2
the average of the Fair Market Value of the Common Stock during the period commencing July 18, 1996 and ending August 5, 1996, inclusive. (b) The amount so determined pursuant to Section 5(a) shall be treated as deferred in accordance with Appendix A hereto. SECTION 6. Nontransferability. No amount due to any Participant shall be assignable or transferable by a Participant, except by will or the laws of descent and distribution, and no right or interest of any Participant shall be subject to any lien, obligation or liability. Any attempted assignment or alienation of payments hereunder shall be void and of no force or effect. SECTION 7. Amendment. The Board may amend, suspend or terminate the Plan or any portion hereof at any time; provided, however, no right under the Plan of any Participant (including the right to receive future compensation in specified amounts) immediately prior to any amendment of the Plan shall in any way be amended, modified, suspended or terminated without such Participant's prior written consent. SECTION 8. Withholding. The Corporation shall have the right to deduct from any and all amounts paid to any Participant under this Plan any taxes required by law to be withheld therefrom. SECTION 9. Administration. The Plan shall be administered by the Administrator who shall have the authority to adopt rules and regulations for carrying out the Plan, and who shall interpret, construe and implement the provisions of the Plan. SECTION 10. Participant's Rights Unsecured. The right of any Participant to receive future payments under the provisions of the Plan shall be an unsecured claim against the general assets of the Corporation. SECTION 11. Effective Date. This Plan became effective on May 13, 1988. 3
Appendix A SECTION A1. Participants' Account Balances. The Corporation shall maintain an individual book account under the Plan for each Participant having a deferred account. Each Participant shall initially have credited to his or her account the number of Units calculated in respect of such Participant pursuant to Section 5 hereof. Such account shall continue to be expressed in Units until an Outside Director has ceased to render services to the Corporation as an Outside Director. Any dividends paid on Common Stock shall be credited to a Participant's account in respect of each Unit and deemed to be reinvested in additional Units based on the Fair Market Value of Common Stock on the dividend payment date. In addition, the number of Units allocated to a Participant's account shall be adjusted to reflect stock dividends, splits and reclassifications, and similar transactions affecting the value of Common Stock. At the time that the Participant's services as an Outside Director cease, subject to Section 5 hereof, the account balance will, until such time as it is paid to the Participant in accordance with the Participant's payment elections, be allocated among the hypothetical investments permitted under the Plan for Participants who have ceased to render service as an Outside Director, as such allocation may be elected by the Participant. SECTION A2. Payment Elections. (a) General Provisions. In connection with the commencement of participation in this Plan, each Participant shall make an election (the "Payment Election") concerning the timing and form of distribution of the amounts credited to his or her Plan account. Any payment from the Plan shall commence following termination of the Participant's services to the Corporation as an Outside Director, but in no event prior to one year after receipt by the Corporation of the Outside Director's initial Payment Election. The forms of benefit available under the Plan shall be a lump sum payment or quarterly, semi-annual or annual installments over a period not to exceed 15 years from the earliest date the director may commence receiving payments hereunder. (b) Special Rules. (i) Subsequent Payment Elections may be made by a Participant, which shall supersede the initial Payment Election, but any such subsequent Payment Election shall not be valid unless it is made prior to May of the calendar year preceding the calendar year in which payments to the Director hereunder are otherwise due to commence. (ii) If a Participant has elected to receive installment payments of the amount in his or her account, the Participant may, at the Participant's option, elect to allocate the account, on or after the date on which he or she ceases to perform services as an Outside Director, among such forms of hypothetical investment as may be made available hereunder by the Administrator with reference to the hypothetical investments made available under the Deferred Compensation Plan for Non-Employee Directors of The Chase Manhattan Corporation (the "Deferred Compensation Plan"). Reallocations may be made among hypothetical investments on the same basis as is permitted under the Deferred Compensation Plan. 4
SECTION A3. Payments to a Deceased Participant's Estate. (a) In the event of a Participant's death before the balance of his or her account is fully paid, payment of the balance of the Participant's account shall then be made to his or her estate in accordance with the manner selected by the Participant prior to death, which manner shall provide that: (i) payment shall be made to the Participant's estate in the same manner as provided with respect to the payments to the Participant or (ii) the balance of the Participant's account shall be determined as soon as practicable following his or her death and this amount shall be paid in a single payment to the Participant's estate as soon as reasonably practicable thereafter. In the event no election has been made, payment shall be made in accordance with clause (ii) of the preceding sentence. (b) In the event of a Participant's death before the balance of his or her account is fully paid to the estate in installments, the Administrator may, upon consideration of the application of the duly appointed administrator or executor of the Participant's estate, direct that the balance of the Participant's account be paid to the estate in a single payment. The payment shall be made at the time specified by the Administrator. 5
Exhibit 10.3 Updated for name changes and JPMorgan Merger DEFERRED COMPENSATION PROGRAM OF JPMORGAN CHASE & CO. AND PARTICIPATING COMPANIES PREAMBLE The Deferred Compensation Program permits annual deferrals by certain key officers of all or a portion of their incentive compensation under the Voluntary Bonus Deferral Plan. The Program permits deferrals of Eligible Compensation under the 401(k) Excess Savings Plan when certain plan or legal limits reduce contributions that would be otherwise made by officers and employees pursuant to the JPMorgan Chase 401(k) Savings Plan, a qualified plan and also permits additional deferrals for commissioned paid employees under a Voluntary Compensation Deferral Plan. At the determination of the Administrator, the Program can include other deferral features. The Program is a successor to the Deferred Compensation Program of The Chase Manhattan Corporation and Participating Companies, the Deferred Compensation Plan of Chemical Bank and Participating Companies, the Thrift-Incentive portion of TRA 86 Supplemental Benefit Plan of The Chase Manhattan Bank, N.A. and the J.P. Morgan Deferred IC Program. Balances in each reference plan are subject to the terms of this Program except as otherwise provided herein. Additionally, the Supplemental Executive Retirement Plan of The Chase Manhattan Bank, N.A. was terminated as of December 31, 1996. The Supplemental Retirement Accounts, as well as the Pre-1988 frozen annuity which was converted to a lump sum, became part of a Participant's account hereunder. The terms and conditions of this Program govern any amount previously deferred thereunder. This Program became effective January 1, 1996.
2 The Program represents an unsecured, unfunded promise to make payments in the future. ARTICLE I DEFINITIONS The following are defined terms wherever they appear in the Program. 1.1 "Additional Credit" shall mean the amount specified in Section 3.2(d). 1.2 "Administrator" shall mean the individual holding the title "Director Human Resources" of the Corporation, who shall be responsible for those functions assigned to him under the Plan; provided that the term "Administrator" shall mean the Committee with respect to any discretionary act hereunder which affects any person subject to Section 16(a) of the Securities Exchange Act of 1934, as amended. 1.3 "Bank" shall mean JPMorgan Chase Bank NA. 1.4 "Beneficiary" shall mean the persons designated by a Participant, on a form provided by the Administrator, to receive in the event of his/her death the value of any undistributed account balance under this Program. Any designation shall include amounts deferred under the 401(k) Excess Savings Plan, the Voluntary Bonus Deferral Plan and the Voluntary Compensation Deferral Plan and amounts transferred to an account under this Program from the JPMorgan Chase Excess Retirement Plan (formerly the Excess Retirement Plan of The Chase Manhattan Corporation) and such other amounts deferred under such other plans or arrangements as may be specified by the Administrator. 1.5 "Benefits Eligible Compensation" shall mean salary, commissions, draw and production overrides deferred under the Voluntary Compensation Deferral Plan. 1.6 "Board of Directors" shall mean the Board of Directors of the Corporation; provided that any action taken by a duly authorized committee of the Board of
3 Directors (including any action described in Section 5.4) within the scope of authority delegated to it by the Board shall be considered an action of the Board of Directors for the purpose of this Plan. 1.7 "Chemical Plan" shall mean the Deferred Compensation Plan of Chemical Banking Corporation and Participating Companies as in effect on December 31, 1996. 1.8 "Code" shall mean the Internal Revenue Code of 1986, as amended. 1.9 "Committee" shall mean the Compensation and Management Development Committee of the Board of Directors. 1.10 "Corporation" shall mean J.P. Morgan Chase & Co. 1.11 "Deferral Percentage" shall mean the percentage elected by an Eligible Employee described in Section 2.1(d) on an Election Form under the Qualified Plan; provided that no Deferral Percentage can be elected unless the individual has elected a Pre-Tax Contribution rate of 5% under the Qualified Plan; provided further that the Deferral Percentage shall not exceed 10% for period commencing January 1, 2000 and ending December 31, 2001 and 15% commencing January 1, 2002. 1.12 "DSIB" shall mean the hypothetical investment choice described in Section 3.3(b). 1.13 "Election Form" shall mean the method specified by the Administrator to participate in the Program and to make deferral and hypothetical investment elections under the Program. Such methods may include, but not be limited to, interactive voice response, internet, and other electronic means. 1.14 "Eligible Compensation" shall have the meaning specified in the Qualified Plan. 1.15 "Eligible Employee" shall mean an Employee described in Section 2.1.
4 1.16 "Employee" shall mean an individual whose employment classification is that of a regular full-time employee and who is on a United States payroll of a Participating Company. 1.17 "Former Participant" shall mean a Participant whose employment has terminated and whose account balance under the Program has not been fully distributed. 1.18 "J.P. Morgan Deferred IC Program" shall mean the incentive compensation program providing for deferral of bonuses sponsored by J.P. Morgan & Co. Incorporated, the balances of which are subject to the terms of this Program. 1.19 "IPA" shall mean the hypothetical investment choice described in Section 3.3.(b). 1.20 "401(k) Excess Savings Plan" shall mean that feature of the Program allowing deferrals of Eligible Compensation on a per pay period basis. 1.21 "Legal Limit" shall mean the dollar limitation imposed by Section 401(a)(17) of the Code on the amount of Eligible Compensation taken into account in computing benefits under the Qualified Plan for a calendar year or the limits imposed under Section 402(g) and Section 415 of the Code. In addition, if so specified by the Administrator for any calendar year, "Legal Limit" shall also mean any reduction in Pre-Tax Contributions or matching contributions under the Qualified Plan because of the expected application of Section 401(k)(3) of the Code or Section 401(m)(3) of the Code. 1.22 "Participant" shall mean each Eligible Employee of a Participating Company described in Section 2.1 who participates in the Program in accordance with the terms and conditions applicable to a deferral arrangement offered under the Program. 1.23 "Participating Company" shall mean: (a) the Corporation and (b) each Related Company which has been authorized by the Administrator to participate in the Program and has agreed to comply with the provisions of the Program.
5 1.24 "Pre-Tax Contributions" shall have the meaning specified in the Qualified Plan. 1.25 "Program" shall mean the Deferred Compensation Program of The Chase Manhattan Corporation and Participating Companies as in effect from time to time, which Program includes the 401(k) Excess Savings Plan, Voluntary Bonus Deferral Plan and Voluntary Compensation Deferral Plan and such other deferral features or plans as the Administrator may specify 1.26 "Qualified Plan" shall mean the JPMorgan Chase 401(k) Savings Plan. 1.27 "Related Company" shall mean a corporation of which more than 51% of the combined voting power of all classes of stock entitled to vote or equity interest is owned directly or indirectly by the Corporation or a partnership, joint venture or other unincorporated entity of which more than 51% of the capital, equity or profits interest is owned directly or indirectly by the Corporation. 1.28 "SERP Amounts" shall mean the amounts described in Sections 6.2(a)(i) and (ii) plus the investment experience thereon. 1.29 "Supplemental Executive Retirement Plan" shall mean the Supplemental Executive Retirement Plan of The Chase Manhattan Bank, N.A. 1.30 "Total and Permanent Disability" or "Totally Disabled" shall mean a disability that, in the determination of the Administrator, would qualify an individual for benefits under a long term disability program maintained by the Corporation or a Related Company. 1.31 "TRA Supplemental Retirement Plan" shall mean the TRA 86 Supplemental Retirement Plan of The Chase Manhattan Bank, N.A. 1.32 "Valuation Date" shall mean the close of business on the last business day of each calendar month for any period prior to July 1, 1999 and shall have the meaning set forth in Qualified Plan for periods on or after July 1, 1999; provided that the Administrator may specify in his/her sole discretion a different Valuation Date or Dates for any investment choice
6 provided under the Program and may apply such different Valuation Dates on an individual by individual basis. 1.33 "Voluntary Bonus Deferral Plan" shall mean that feature of the Program allowing deferral of annual incentive compensation payable in the form of a bonus. 1.34 "Voluntary Compensation Deferral Plan" shall mean that feature of the Program permitting the deferral of Benefits Eligible Compensation on a per pay period basis for commissioned employees. ARTICLE II PARTICIPATION 2.1 ELIGIBILITY. The Employees who shall be eligible to participate in the Program are those officers and other key employees of a Participating Company who: (a) under the Voluntary Bonus Deferral Plan: (i) are participating in a cash incentive plan permitting deferral of cash bonuses; and (ii) have a position or salary grade with a Participating Company that has been designated by the Administrator as eligible for participation in the Plan; or (iii) have been specifically authorized by the Administrator to participate in the Plan. (b) under the Voluntary Compensation Deferral Plan: (i) earned Benefit Eligible Compensation in a prior calendar year in excess of the Legal Limit for the period specified by the Administrator; and
7 (ii) have a position or salary grade with a Participating Company that has been designated by Administrator as eligible for participation in the Plan. (c) under the 401(k) Excess Savings Plan for the period of January 1, 1997 through December 31, 1999: (i) were participating in the Qualified Plan electing to make Pre-Tax Contributions during a calendar year; and (ii) were subject to the Legal Limit; and (iii) were described in either Section 2.1(a)(ii) or (iii). (d) under the 401(k) Excess Savings Plan after December 31, 1999: (i) are not permitted by the terms of the Qualified Plan to make Pre-Tax Contributions during a calendar year in excess of a 5 percent deferral rate, and (ii) are designated as eligible to participate in the 401(k) Excess Savings Plan by the Administrator. 2.2 DEFERRAL ELECTIONS. (a) Voluntary Bonus Deferral Plan. An Eligible Employee may annually elect to defer incentive compensation and participate in the Voluntary Bonus Deferral Plan by delivering a properly completed Election Form to the Administrator; and, upon making such irrevocable election to defer incentive compensation, such Eligible Employee shall be a Participant. (b) Voluntary Compensation Deferral Plan. An Eligible Employee may annually elect to defer Benefits Eligible Compensation up to the maximum percentage specified by the Administrator commencing with the first pay period in a calendar year by delivering a
8 properly completed Election Form to the Administrator. Upon making such irrevocable election by delivering the Election Form, such Eligible Employee shall be a Participant. (c) 401(k) Excess Savings Plan. (i) Effective as of December 31, 1999, by electing a Deferral Percentage on an Election Form (or continuing an election of such a percentage), an Eligible Employee thereby elects to have an amount each per pay period deferred under the 401(k) Excess Savings Plan. (ii) An Eligible Employee will automatically become a Participant and will have amounts deferred under the 401(k) Excess Savings Plan after the applicable Legal Limit is reached under the Qualified Plan based on the percentage election made for the Qualified Plan. (iii) Prior to December 31, 1999, an Eligible Employee was required to elect to defer Eligible Compensation under the 401(k) Excess Savings Plan (after the applicable Legal Limit was reached for the calendar year under the Qualified Plan) by delivering a properly completed Election Form to the Administrator. 2.3 TIMING AND EFFECTIVE DATE OF ELECTIONS. (a) Any deferral election under the Voluntary Bonus Deferral Plan shall be made at least three months prior to the end of the calendar year to which the incentive compensation relates. Such election shall be irrevocable following the end of the election period and shall be effective with respect to any incentive compensation to be paid in the calendar year following the date of the election. (b) Any deferral election under the Voluntary Compensation Deferral Plan shall be made at least three months prior to the beginning of the calendar year to which the election relates. Such election shall be irrevocable following the end of the election period and shall be effective for Benefit Eligible Compensation to be received in the calendar year following the date of the election. (c) Any deferral election under the 401(k) Excess Savings Plan and Deferral Percentage shall be made at the same time as any election under the Qualified Plan
9 and shall be effective at the same time as would an election under the Qualified Plan be effective. (d) Notwithstanding the dates specified in this Section 2.3, the Administrator may prescribe an earlier or later date by which Participant must elect to defer compensation. (e) Under no circumstances may a Participant at any time defer compensation to which the Participant has attained a legally enforceable right to receive. 2.4 TERMINATION OF 401(K) EXCESS SAVINGS ELECTION. An election to defer Eligible Compensation under the 401(k) Excess Savings Plan will terminate on the earlier of (i) termination of employment, (ii) ineligibility to participate in the Qualified Plan, or (iii) filing of an election by such date as may be specified by the Administrator to cease deferrals. 2.5 TERMINATION OF A VOLUNTARY COMPENSATION DEFERRAL PLAN ELECTIONS. An election to defer Benefits Eligible Compensation under the Voluntary Compensation Deferral Plan will terminate on the earlier of (i) termination of employment, (ii) the end of the calendar year to which the election relates, or (iii) such earlier date as the Administrator may specify. ARTICLE III COMPENSATION DEFERRED 3.1 ACCOUNT. (a) With respect to deferrals under this Program, a bookkeeping account shall be established for each Participant. Under the Program, amounts deferred by a Participant, along with hypothetical income or losses on such amounts (including Additional Credits, if any, with respect to deferrals under the 401(k) Excess Savings Plan), shall be credited or debited to the account.
10 (b) For purposes of hypothetical investments under Section 3.3, for periods prior to calendar year 2000, incentive compensation deferred with respect to a calendar year was considered to be invested as of the first day of the month immediately following the month in which incentive compensation would otherwise have been payable. For periods after calendar year 2000, incentive compensation deferred with respect to a calendar year shall be considered to be invested as soon as administratively practical following the date on which such compensation would otherwise have been payable. (c) For purposes of hypothetical investments under Section 3.3, deferred Eligible Compensation or Benefit Eligible Compensation shall be considered to be invested as soon as administratively practical following the date on which such compensation would otherwise have been payable. 3.2 AMOUNT OF DEFERRAL. (a) Voluntary Bonus Deferral Plan. Under the Voluntary Bonus Deferral Plan, a Participant shall have deferred all or a portion, by percentage or by dollar amount (as specified on an Election Form), of any bonus or other incentive award (other than any award payable as shares of common stock of the Corporation) subject to a minimum of $5,000 that would otherwise be payable in the calendar year following the election. For these purposes, bonus or incentive compensation means only compensation otherwise payable in cash to a Participant for services as an Employee of the Participating Company. (b) Voluntary Compensation Deferral Plan. Under the Voluntary Compensation Deferral Plan, a Participant shall have deferred for each pay period an amount equal to the product of the percentage elected on an Election Form and Benefit Eligible Compensation (otherwise payable for such pay period). (c) 401(k) Excess Savings Plan. For calendar year 2000 and following, a Participant shall have deferred from Eligible Compensation for each pay period an amount equal to the product of the Deferral Percentage (as in effect from time to time pursuant to an Election Form) and Eligible Compensation. In addition, a Participant shall have deferred from Eligible
11 Compensation, in each pay period following the date that the Pre-Tax Contributions under the Qualified Plan ceased because of the application of the Legal Limit, an amount equal to the product of the (I) rate of Pre-Tax Contribution under the Qualified Plan (as in effect) and (ii) Eligible Compensation for any remaining pay periods. (d) Additional Credit. To the extent that Eligible Compensation is being deferred under the 401(k) Excess Savings Plan because of the application of the Legal Limit, there shall be credited to an individual's account an amount equal to the product of Eligible Compensation for any pay period remaining in the calendar year and the lesser of (i) the maximum employer matching contribution rate under the Qualified Plan or (ii) the rate elected under the Qualified Plan prior to application of the Legal Limit, unless the Participant elects subsequently a lower percentage. Such Additional Credit shall vest in accordance with the schedule set forth in the Qualified Plan. Notwithstanding the foregoing or anything hereinto the contrary, no Additional Credits will apply to the accounts of those Participants whose Eligible Compensation in whole or part consist of commissions, draw or production overrides or to Participants employed in one of the wholesale businesses of a Participating Company. (e) Not in Excess. The amount credited to a Participant's account under Section 3.2(c) and (d) along with the amount credited to such Participant under the Qualified Plan shall not exceed the amount that would have been contributed for the Participant but for the application of the Legal Limit. 3.3 HYPOTHETICAL INVESTMENT. (a) Subject to the provisions of Section 3.4, amounts credited to an account shall be deemed to be invested, at the Participant's direction, in one of the investment vehicles offered under the Qualified Plan and shall be credited with the same rates of returns as provided by the Qualified Plan for such funds (except for the Chase Common Stock Fund under the Qualified Plan). Unless otherwise specified by the Administrator, hypothetical investment funds shall change as the investment vehicle under the Qualified Plan change and shall be subject to the same charges and expenses as provided for in the Qualified Plan.
12 (b) In addition to hypothetical investment funds in (a), the Program provides (i) Deferred Supplemental Income Benefit ("DSIB"). Amounts treated as invested in DSIB shall earn the rate of return specified by the Administrator for that year and future years up to the January 1, immediately prior to the date of distribution of the first installment of the DSIB; provided that, however, with respect to deferrals during a calendar year under the 410(k) Excess Savings Plan or transfers/reallocations of deferred incentive compensation, the amount designated as invested in DSIB shall receive the rate specified for the next succeeding calendar year, and such mid-year deferral or reallocation shall receive the rate of return of the Stable Value investment choice until treated as if invested in DSIB. The DSIB rate of return shall not be applicable if employment of a Participant terminates with less than five years of service, or before age 65 with respect to deferrals made within 12 month of termination of employment. In such circumstances, that portion of the account shall receive, in lieu of the DSIB rate, the rate provided by the Stable Value investment choice for each year deemed invested in DSIB. The Administrator has the discretion to impose minimum and maximum allocations to DSIB. A hypothetical investment election in the DSIB shall only be effective if the Participant cooperates with the reasonable requests of the Administrator, including the completion of an insurance application/consent and a physical; provided further should a Participant revoke his/her consent to insurance, then no benefit shall be payable under DISB. (ii) Inflation-Protected Annuity Benefit ("IPA"). Effective July 1, 2003, the IPA was discontinued for future investments and amounts pending IPA were treated as invested in the Stable Value investment choice as of June 30, 2003 unless the Participant otherwise elected. Amounts treated as invested in IPA shall earn (a) a rate of return specified by the
13 Administrator for that year and future years, and (b) an annual inflation adjustment return each year based on changes in the non-seasonally adjusted Consumer Price Index for Urban Consumers and year end account balance allocated to IPA, in either case up to the January 1, immediately prior to the date of distribution of the first installment of the IPA; provided that however, with respect to deferrals during a calendar year under the Excess 410(k) Plan or reallocations of deferred incentive compensation, the amount designated as invested in IPA shall receive the rate specified for the next succeeding calendar year, and such mid-year deferral or reallocation shall receive the rate of return of the Stable Value investment choice until treated as if invested in IPA. The Administrator has the discretion to impose minimum and maximum allocations to IPA. (iii) NASDAQ 100 Investment Choice. Amounts treated as invested in the NASDAQ 100 investment choice shall earn a rate of return that approximates the rate of return published for the NASDAQ 100 Index . (c) Amounts treated as invested in the common stock investment choice (including dividend equivalents) shall be treated as if invested in fixed shares of common stock of the Corporation ("Common Stock investment choice"); and for valuation purposes, the New York Stock Exchange closing market price for such stock on the date of any such deemed investment of compensation or dividend equivalents shall be used. (d) The Administrator may, in his sole discretion, provide to classes of Participants and Former Participants, as he shall specify, additional hypothetical investments currently a Private Equity investment choice and Multi-Strategy investment choice. With respect to amounts treated as if invested in such additional hypothetical investments, the Administrator may specify (i) restrictions on transfers and re-allocations and (ii) a distribution schedule different from that specified herein; provided that the Administrator may change such
14 restrictions and distribution schedule, in his discretion, on 30 days advance notice to Participants and Former Participants. 3.4 LIMITATIONS ON HYPOTHETICAL INVESTMENTS. Notwithstanding the provisions of Section 3.3, the Administrator may, in his sole discretion (i) replace any investment vehicle with a deemed investment vehicle having comparable investments and investment objectives and risks substantially similar to the vehicle being replaced, or (ii) discontinue such vehicle as an alternative for deemed investment hereunder and provide each affected Participant the opportunity, without limiting or otherwise impairing any other right of the Participant under this Article III regarding changes of investment directions, to redirect the allocation of the value of such Participant's account that had been deemed invested in such discontinued investment fund among the remaining deemed investment vehicles or, in the discretion of the Administrator, into another deemed investment vehicle established by the Administrator. See Appendix I with respect to the exercise of the Administrator's discretion for changes to funds and allocation of existing balances under this Program and the J.P. Morgan Deferred IC Program as of January 1, 2002. See Appendix II for changes effective June 30, 2003. 3.5 HYPOTHETICAL INVESTMENT. (a) As of each Valuation Date, the value of each Participant's account shall be determined by reference to the value of the hypothetical investment choice for the particular fund or funds under the Qualified Plan (or, if applicable, the published rate of return for the NASDAQ Index, the Common Stock or such other fund as may be made available) in which the portion of the account is deemed invested plus any income or loss on that hypothetical investment choice. The amounts credited to DSIB and IAP shall receive the rate specified at the date of the deemed investment.
15 (b) Except as provided in Section 3.4, amounts for which no investment election has been made shall be treated as if invested in the Stable Value Fund, until such election is made. 3.6 ALLOCATION OF HYPOTHETICAL INVESTMENTS; REALLOCATION OF HYPOTHETICAL INVESTMENTS. (a) A Participant may elect the manner at such times, as the Administrator may specify, in which deferrals of future incentive compensation, Benefits Eligible Compensation or Eligible Compensation, are deemed allocated to one or more of the hypothetical investments described in Section 3.3. (b) A Participant or Former Participant may at such times, as the Administrator may specify, also reallocate/transfer among the hypothetical investments amounts previously credited to his account on a Valuation Date; provided that a Participant or Former Participant may not reallocate any amounts treated as if invested in the Corporation's common stock or DSIB to any other hypothetical investment choice; provided, further, that for periods prior to July 1, 1999, a request for reallocation must have been received before the fifth business date preceding a Valuation Date for it to be effective for that Valuation Date. (c) The Administrator in his/her sole discretion may limit transfers and reallocation among funds under this Program in such manner as he/she may deem appropriate. The Administrator may exercise such authority on a Program wide basis or on an individual by individual basis. 3.7 STATEMENT OF ACCOUNT. A statement shall be provided to each Participant or Former Participant with respect to the amount of his account at least once a calendar year.
16 ARTICLE IV PAYMENT OF DEFERRED COMPENSATION 4.1 PAYMENT OF DEFERRED COMPENSATION. (a) Termination of Employment. Except as provided in subsection (b), upon termination of the Participant's employment with the Corporation or a Related Company, the value of the account of such individual shall be distributed to such individual during the month of January or July following the date of such termination of employment in either installments or a lump sum, as the Administrator may specify; provided that if the Participant has made a timely election as solely determined by the Administrator (but always prior to the calendar year before a payment is due), the Participant shall receive the value of the account in annual installments or a lump sum in such calendar as selected by the Participant subject to the consent of the Administrator. The maximum installment election cannot exceed 15 annual installments, and the account must be distributed by the date that a Participant attains age 80. An installment amount shall be based on the balance of an account divided by the number of installments remaining to be made. (b) J.P. Morgan Deferred IC Program. Notwithstanding (a) above, Participants in the J.P. Morgan Deferred IC Program whose employment terminated on or before December 31, 2001 or who were receiving as of October 31, 2001 distributions from such Program remain subject to the terms of the J.P. Morgan Deferred IC Program. In the case of other Participants in the J.P. Morgan Deferred IC Program, their balances became subject to the terms and conditions of this Program effective January 1, 2002. (c) Total and Permanent Disability. Upon a termination of employment due to a Total and Permanent Disability of a Participant, the Administrator may, in his or her sole discretion, distribute the account under the Program distributed pursuant to Section 4.1(a).
17 (d) In-Service Withdrawal. A Participant at the date of an election to participate with respect to a deferral of incentive compensation (or with respect to the Eligible Compensation or Benefits Eligible Compensation Plan on the date specified by the Administrator for deferrals in the next succeeding year) may elect a specific year during active employment in which to begin receiving the portion of the Account representing such deferred incentive compensation; provided that such date is at least two years after the deferred amount would have been paid if it were not deferred; provided further that such election shall not apply to DSIB, IPA or other investment choices as specified by the Administrator. (e) Shares of Common Stock, DSIB and IPA. (i) The portion of an account treated as if invested in the Common Stock investment choice shall be distributable solely in shares of the common stock of the Corporation and shall be distributed as set forth in Section 4.1(a), (b) or (c) above. (ii) The portion of the account treated as if invested in the DSIB shall be paid in 15 equal, annual installments starting in January of the year following termination of employment, unless Administrator in his/her sole discretion specifies a later date. DSIB payments shall not commence prior to termination of employment. (iii) The portion of the account treated as if invested in the IPA shall be paid in 15 annual installments, calculated as a 15 year annuitized amount based on the specified interest rate for the year of deferral into IPA. Installments payments (with the exception of the first installment) shall receive an annual inflation adjustment as described Section 3.3(b)(iii). Distributions shall commence in January of the year following termination of employment, unless the Administrator in his/her sole discretion specifies a later date. IPA payments shall not commence prior to termination of employment. (e) Shares Available for Issuance. An aggregate of 500,000 shares of authorized but unissued shares of common stock of the Corporation has been reserved for issuance pursuant to this Program, as subject to adjustment provided for in Section 5.8.
18 (f) Valuation. For purposes of distribution, the balance of an account shall be valued as of the Valuation Date immediately preceding the date that the balance of such account or the particular installment thereof is to be distributed. 4.2 FINANCIAL EMERGENCY PAYMENTS. Notwithstanding any other provisions of this Plan, if the Administrator determines, after consideration of an application of a Participant or Former Participant, such individual has a financial emergency of such a substantial nature and beyond the individual's control that a contemporaneous payment of incentive compensation previously deferred under this Plan is warranted, the Administrator may, in his sole and absolute discretion, direct that all or a portion of the balance of the account be paid or distributed to the Participant or Former Participant in such manner and at such time as the Administrator shall specify. 4.3 PAYMENTS TO A DECEASED PARTICIPANT'S BENEFICIARY. In the event of a death of a Participant or Former Participant before the value of the account under the Program has been fully distributed, the value of the account of such individual shall be distributed in a lump sum to the individual's Beneficiary (or his/her estate in the event that no Beneficiary, including a secondary/contingent Beneficiary shall survive the Participant or Former Participant) as soon as practicable thereafter after receipt of all documentation. Shares of the common stock of the Corporation shall be distributed with respect to any portion of the account treated as if invested in the Corporation's common stock. Notwithstanding the foregoing, any compensation treated as if invested in the DSIB or IPA shall be distributed to the named Beneficiary (i) if prior to the commencement of DSIB payments, in 15 annual installments in an amount specified by the Administrator for the calendar year in which the deferral occurred; or (ii) if after commencement of DSIB or IPA payments, annual payments in the same amount as the Participant received until an aggregate 15 payments have been received by the Participant and his Beneficiary.
19 ARTICLE V GENERAL PROVISIONS 5.1 PARTICIPANT'S RIGHTS UNSECURED. The right of any Participant or Former Participant to receive future payments under the provisions of the Program shall be an unsecured claim against the general assets of (i) the Bank if the Participating Company employing the Participant at the time that his/her compensation is deferred was a bank or a bank subsidiary, or (ii) the Corporation, if the Participating Company employing the Participant at the time his/her compensation is deferred was not a bank or a bank subsidiary. Deferrals under the Chemical Plan prior to January 1, 1997 shall be allocated to the Bank or Corporation depending upon the employer of the Employee on January 1, 1997. No Participating Company (other than the Corporation or Bank) is liable for payment of benefits to its Employees under the Plan. 5.2 ASSIGNABILITY. No right to receive payments hereunder shall be transferable or assignable by a Participant or Former Participant except by will or by the laws of descent and distribution or by a court of competent jurisdiction. Any other attempted assignment or alienation of payments hereunder shall be void and of no force or effect. 5.3 ADMINISTRATION. Except as otherwise provided herein, the Plan shall be administered by the Administrator who shall have the authority to adopt rules and regulations for carrying out the provisions of the Plan, who shall interpret, construe and implement the provisions of the Plan, and whose determinations shall be conclusive and binding. In carrying out his responsibilities hereunder, the Administrator may appoint such delegates as he/she deems appropriate. Notwithstanding anything herein to the contrary, the Administrator shall have the absolute right to delay any payments for a reasonable period following the calendar year of termination of employment. 5.4 AMENDMENT. The Plan may at any time or from time to time be amended, modified or terminated by the Board of Directors or the Administrator; provided that no amendment, modification, or termination shall, without the consent of the Participant, reduce the value of Participant's account at that time; provided further that as to persons subject to
20 Section 16(a) of the Securities Exchange Act of 1934, as amended, no provision hereunder which relates to the Chase Common investment choice may be amended at less than six months intervals, and such amendment shall be subject to stockholder approval if required by SEC Rule 16b-3. 5.5 LEGAL OPINIONS. The Administrator may consult with legal counsel, who may be counsel for the Corporation or other counsel, with respect to his obligations or duties hereunder, or with respect to any action, proceeding or any question at law, and shall not be liable with respect to any action taken, or omitted, by him in good faith pursuant to the advice of such counsel. 5.6 LIABILITY. Any decision made or action taken by the Board of Directors, the Committee, the Administrator or the Corporation, arising out of, or in connection with, the construction, administration, interpretation and effect of the Program shall be within their absolute discretion, and will be conclusive and binding on all parties. Neither the Administrator nor a member of the Board of Directors of the Corporation or the Committee of the Corporation shall be liable for any act or action hereunder, whether of omission or commission, by any other member or employee or by any agent to whom duties in connection with the administration of the Plan have been delegated or, except in circumstances involving bad faith, for anything done or omitted to be done in connection with this Plan. 5.7 CORPORATE REORGANIZATION. In the event that as of any date a corporation or unincorporated entity ceases to meet the definition of Related Company, such corporation or entity shall cease to be a Participating Employer and its employees shall cease to be Participants under the Plan as of the Valuation Date coincident with or immediately following such date, and this Plan shall be treated as though a separate plan for the benefit of its employees who were Participants in the Plan to govern the balances in an account under the Program as of such Valuation Date. 5.8 ADJUSTMENTS. The maximum aggregate number of shares of common stock of the Corporation to be issued under this Plan shall be proportionately adjusted for any increase or decrease in the number of issued shares of common stock of the Corporation
21 resulting from a subdivision or consolidation of such shares of common stock or other similar capital adjustment, or the payment of a stock dividend (but only if such stock dividend is 5% or more), or other increases or decreases in such shares of common stock effected without receipt of consideration by the Corporation. 5.9 COMPLIANCE. This Program will be administered to comply with the Securities Act of 1933, as amended, and the Securities Exchange Act of 1934, as amended. 5.10 ASSUMED LIABILITY. Effective January 1, 1996, this Program governs the account liability for payments in lieu of Thrift-Incentive Plan Contributions liability under the TRA Supplemental Benefit Plan of The Chase Manhattan Bank, N.A. prior to merger with Chemical Bank. All rights and benefits for such liability are governed by this Program. 5.11 CONSTRUCTION. The masculine gender, where appearing in this Program, shall be deemed to also include the feminine gender. The singular shall also include the plural, where appropriate. ARTICLE VI OBLIGATIONS UNDER TRA SUPPLEMENTAL PLAN AND UNDER SUPPLEMENTAL EXECUTIVE RETIREMENT PLAN 6.1 TRA SUPPLEMENTAL PLAN. The balances of participants in Section II of the TRA Supplemental Retirement Plan became part of the account balances under this Program as of January 1, 1997. Such balances are subject to the terms and conditions of this Program, including, but not limited to the hypothetical investments described in Section 3.3. 6.2 SUPPLEMENTAL EXECUTIVE RETIREMENT PLAN. (a) Each Employee who had a benefit as of December 31, 1996 under the Supplemental Executive Retirement Plan shall have an account under this Program consisting of:
22 (i) the amount of his/her Supplemental Chase Retirement Account including any amounts credited for the bonus payable in 1996; and (ii) if such individual had accrued an annuity frozen as of December 31, 1988, under the Supplemental Executive Retirement Plan, an amount derived by converting the accrued life annuity frozen as of December 31, 1988 utilizing the factors set forth in Section 4.1 of the Retirement Plan. (b) Unless an employee otherwise elects by February 27, 1997, the amount derived from the SERP shall be treated as if invested in DSIB; provided that if the Employee elects another form of benefit of the hypothetical investment, Employee by virtue of such election acknowledges that such hypothetical investment may provide rates of return lower than that provided by the Supplemental Executive Retirement Plan. (c) Employees shall vest in the balance of their account subject to SERP only if they have a Period of Service recognized for Pay Credit purposes under the Retirement Plan of at least 10 years.
23 APPENDIX I - - In December of 2001, Participants who had account balances under the J.P. Morgan Deferred IC Program had the opportunity to transfer balances among the investment choices under that Program to be effective as of January 1, 2002. Balances in the heritage Morgan accounts were then directed to the new investment choices as follows: Equity Account-S&P 500 Index Investment Choice Bond Account-Intermediate Bond Investment Choice Balanced Account-Moderately Aggressive Lifestyle Investment Choice Deferred Cash Account-Short-Term Fixed Income Investment Choice International Equity Account-International Equity Index Investment Choice NASDAQ Account-NASDAQ 100 Index Investment Choice MIPs Account-remain in place as IPA Investment Choice DIBA Account-remain in place as DSIB Investment Choice - - Starting on January 7, 2002, heritage Morgan Participants had the opportunity to transfer/reallocate balances (other than the DSIB investment choice, IPA investment choice and Common Stock investment choice) on a daily basis.
24 APPENDIX II Effective June 30, 2003, the Large Cap Blend investment choice was eliminated as an investment choice under the Program. Any amounts remaining in that investment choice on June 30, 2003, as well as future contributions, were automatically treated as invested in the S&P 500 Index investment choice.
Exhibit 10.5(a) THE CHASE MANHATTAN 1994 LONG-TERM INCENTIVE PLAN EFFECTIVE MAY 1, 1994 1. PURPOSE The purpose of The Chase Manhattan 1994 Long-Term Incentive Plan (the "Plan") is to advance the interests of The Chase Manhattan Corporation ("CMC") and its Subsidiaries by providing long-term incentive awards and stock ownership opportunities to certain key employees (including officers and directors who are employees) who contribute significantly to the longer term performance of CMC and its Subsidiaries. In addition, the Plan is intended to enhance the ability of CMC and its Subsidiaries to attract and retain individuals of superior managerial ability and to motivate such key employees to exert their best efforts towards the future progress and profitability of CMC and its Subsidiaries. For purposes of this Plan, a Subsidiary shall be any corporation in which CMC has a direct or indirect ownership interest, including any corporation in which CMC acquires any such interest after the adoption of this Plan, but only if CMC owns or controls, directly or indirectly, stock possessing not less than 50 percent of the total combined voting power of all classes of stock in such corporation. 2. ADMINISTRATION AND INTERPRETATION a. ADMINISTRATION. The administration and operation of the Plan shall be vested in the Compensation Committee of the Board of Directors of CMC, or such other committee of such Board of Directors which shall succeed to the functions and responsibilities, in whole or in part, of said Compensation Committee (the "Committee"). The Committee shall consist of not less than three members of the Board of Directors of CMC (the "Board of Directors") who are not officers or employees of CMC or any Subsidiary and who are (i) "disinterested" within the meaning of Rule 16b- 3 as in effect from time to time under the Exchange Act (as defined in Section 6(e)) ("Rule 16b-3") and (ii) "outside directors" under Section 162(m) of the Internal Revenue Code of 1986, as amended (the "Code") and the regulations promulgated thereunder as in effect from time to time (the "Section 162(m) Regulations"). No member of the Committee shall be entitled to participate in the Plan. The Committee shall have the authority, consistent with the provisions of the Plan, to determine the provisions of the awards to be granted under the Plan; to determine the form of any such award; to interpret the Plan and any award granted under the Plan; to adopt, amend and rescind rules and regulations for the administration of the Plan and the awards granted under the Plan; and to make all determinations in connection therewith which may be necessary or advisable. The day-to-day administration of the Plan shall be carried out by such officers and employees of The Chase Manhattan Bank (National Association) as shall be designated from time to time by the Committee. b. INTERPRETATION. The interpretation and construction by the Committee of any page 1
provisions of the Plan or of any award granted under the Plan and any determination by the Committee under any provision of the Plan or any such award shall be final and conclusive. c. LIMITATION ON LIABILITY. Neither the Board of Directors nor the Committee, nor any member of either, shall be liable for any act, omission, interpretation, construction or determination made by the Committee or any member thereof in connection with the Plan in good faith, and the members of the Board of Directors and the members of the Committee shall be entitled to indemnification and reimbursement by CMC in respect of any claim, loss, damage or expense (including counsel fees) arising therefrom to the full extent permitted by law and under any directors and officers liability insurance coverage which may be in effect from time to time. d. RESERVED AUTHORITY OF THE BOARD OF DIRECTORS. The determinations by the Committee as to: (i) the Incentive Stock Options (as defined in Section 4(b)(2)) and/or Non-qualified Stock Options (as defined in Section 4(b)(3)) to be granted to a senior executive officer of CMC who is a member of the Board of Directors and the aggregate number of Incentive Stock Options and/or Non-qualified Stock Options to be granted to all other eligible employees pursuant to Section 4(b)(1); (ii) the Stock Appreciation Rights (as defined in Section 4(c)) to be granted pursuant to Section 4(c) to any optionee who is a senior executive officer of CMC and who is a member of the Board of Directors and who has been granted Options (as defined in Section 4(b)(1)); and/or (iii) the aggregate number of Restricted Stock Units (as defined in Section 5) which may be granted to all eligible individuals under the Plan pursuant to Section 5(b); shall be subject to the review and approval of the members of the Board of Directors who are both "disinterested" under Rule 16b-3 and "outside directors" under Section 162(m) of the Code and the Section 162(m) Regulations only if such review and approval (a) shall not cause the administration of the Plan to be other than "disinterested" under Rule 16b-3 and (b) shall allow CMC to maintain the deductibility of certain compensation paid pursuant to this Plan under Section 162(m) of the Code and the Section 162(m) Regulations, as determined by counsel for CMC. 3. SHARES SUBJECT TO AWARDS UNDER THE PLAN a. LIMITATION ON NUMBER OF SHARES. The shares subject to Options and authorized for issuance upon the exercise of Stock Appreciation Rights ("Option Shares"), and the shares subject to awards of Restricted Stock Units, shall be shares of CMC's authorized but unissued common stock, par value $2.00 per share ("Common Stock"), and shares, if any, of such Common Stock held as treasury stock by CMC. The aggregate number of shares of Common Stock that may be made the subject of awards under the Plan (a) during calendar year 1994 shall not exceed 100,000 shares and (b) during calendar year 1995 shall not exceed one and one-half percent (1.5%) of the number of shares of Common Stock outstanding on December 31, 1994. The aggregate number of shares of Common Stock that may be made the subject of awards under the Plan during any calendar year subsequent to calendar year 1995 shall not exceed the sum of (i) one and one-half percent (1.5%) of the number of shares of Common Stock outstanding on December 31 of the preceding calendar year and (ii) the page 2
number of shares of Common Stock as to which awards could have been made under the Plan on December 31 of the preceding calendar year but as to which awards were not made during such year. If any Option awarded under this Plan expires or terminates unexercised or any award of Restricted Stock Units (or shares of Restricted Stock into which it may be converted) under this Plan expires or is terminated for any reason, the shares allocable to the unexercised or terminated portion of such Option or award may again be made the subject of awards under the Plan. Such shares shall be included in the amount determined pursuant to clause (ii) of the immediately preceding paragraph as of the end of the year in which such termination or expiration occurs. b. ADJUSTMENTS OF NUMBER OF SHARES. The number of shares that may be made the subject of awards as provided in Section 3(a) shall be subject to appropriate adjustment, from time to time, in accordance with the provisions of Sections 4(d)(8) and 4(d)(9). In the event of a change in the Common Stock of CMC which is limited to a change in the designation thereof to "Capital Stock" or other similar designation, or to a change in the par value thereof, or from par value to no par value, without increase or decrease in the number of issued shares, the shares resulting from any such change shall be deemed to be Common Stock within the meaning of the Plan. 4. STOCK OPTIONS AND STOCK APPRECIATION RIGHTS a. ELIGIBILITY. The individuals who shall be eligible to receive Options and Stock Appreciation Rights under the Plan shall be all salaried employees (including officers and directors who are salaried employees) of CMC or of any Subsidiary as the Committee from time to time shall determine as provided below. b. GRANTS OF OPTIONS. (1) In General. Options granted under the Plan may be either "Incentive Stock Options" or "Non-qualified Stock Options" (collectively referred to herein as "Options"); provided, however, that no Option Shares under the Plan shall be subject to more than one Option; and provided, further, that no Incentive Stock Options may be granted under the Plan after February 15, 2004. Options granted under the Plan shall be of such type and for such number of Option Shares (subject to the limitation contained in Section 3), as the Committee shall designate at the time of grant; provided, however, that the maximum number of shares of Common Stock with respect to which Options or Stock Appreciation Rights shall be granted in any calendar year to any individual under this Plan shall not exceed ten percent (10%) of the total number of shares of Common Stock that may be made the subject of awards during any calendar year under Section 3 of the Plan as determined on the effective date of the Plan for calendar year 1994 and for any calendar year thereafter, on the first day of such calendar year; provided, further, that such maximum number of shares shall be subject to appropriate adjustment, from time to time, in accordance with the provisions of Sections 4(d)(8) and 4(d)(9). The Committee, at any time and from time to time, may authorize the granting of Incentive Stock Options and/or Non-qualified Stock Options page 3
to any individual eligible to receive the same. (2) Incentive Stock Options. The term "Incentive Stock Option" shall mean an Option which is intended to qualify as an incentive stock option under Section 422 of the Code. Subject to adjustment as provided in Section 3(b), the aggregate number of shares of Common Stock as to which Incentive Stock Options may be granted under the Plan shall not exceed 5,000,000 shares of Common Stock. Such number of shares shall be subject to appropriate adjustment, from time to time, in accordance with the provisions of Sections 4(d)(8) and 4(d)(9). (3) Non-qualified Stock Options. The term "Non-qualified Stock Option" shall mean any Option which is not an Incentive Stock Option. Except as specifically provided herein, the provisions of this Plan shall apply in the same manner to Incentive Stock Options and to Non-qualified Stock Options. c. GRANTS OF STOCK APPRECIATION RIGHTS. (1) In General. The term "Stock Appreciation Right" shall mean the right to receive from CMC upon surrender of an Option or a portion thereof, but without any payment to CMC, an amount equal to the value (based on Market Value Per Share (as defined in Section 4(d)(4)), on the exercise date, of the total number of Option Shares for which the Stock Appreciation Right is exercised, less the option price which the optionee would have otherwise been required to pay upon purchase of such Option Shares. The amount payable by CMC upon the exercise of a Stock Appreciation Right may be paid in cash or in Option Shares or in any combination thereof, as the Committee in its sole discretion shall determine. No fractional shares shall be issuable pursuant to any Stock Appreciation Right. The Committee in the same manner as is provided with respect to Options in Section 4(b) may, from time to time, authorize the granting of Stock Appreciation Rights to any optionee who has been granted Options. Each Stock Appreciation Right shall relate only to Option Shares subject to a specific Option granted under this Plan and may be granted concurrently with the Option to which it relates or at any time prior to the exercise, termination or expiration of such Option. However, at no time shall the total number of Option Shares with respect to which Stock Appreciation Rights remain outstanding and unexercised exceed the total number of Option Shares subject to Options then outstanding and unexercised. (2) Limitations on Stock Appreciation Rights. The Committee may fix, with respect to Stock Appreciation Rights granted under the Plan, such waiting periods, exercise dates or other limitations as it shall deem appropriate; provided, however, that no Stock Appreciation Right shall be exercisable prior to the date when the Option to which it relates first becomes exercisable or after the expiration of such related Option. In addition, the Committee may impose at any time after the grant of any Stock Appreciation Right a total prohibition on the exercise of such Stock Appreciation Right for such period or periods as it, in its sole discretion, deems to be in the best interest of CMC. d. TERMS OF OPTIONS AND STOCK APPRECIATION RIGHTS. Options granted pursuant to this Plan shall be evidenced by agreements ("Stock Option Agreements"). Stock Appreciation Rights, if any, shall be evidenced by agreements amending and forming a part of the Stock Option Agreements to which such Stock Appreciation Rights relate. Stock Option Agreements, and the Options and Stock page 4
Appreciation Rights, if any, represented thereby, shall comply with and be subject to the following terms and conditions and may contain such other provisions, consistent with the terms of this Plan, as the Committee shall deem advisable. (1) Medium of Payment. Upon exercise of an Option, the option price shall be payable to CMC (i) in United States dollars in cash or by check, bank draft or money order payable to the order of CMC (or such other forms of payment as the Committee may determine to be acceptable) or (ii) by tendering to CMC shares of Common Stock owned by the optionee having an aggregate Market Value Per Share as of the date of exercise which is not greater than the option price and by paying the remainder of the option price as provided in (i) above. Payment instruments will be received subject to collection. (2) Number of Shares. Each Stock Option Agreement shall state the total number of Option Shares which are subject to the Option and, if applicable, the total number of Option Shares in respect of which any related Stock Appreciation Right shall be exercisable. (3) Option Price. The option price for each Option Share shall be not less than the Market Value Per Share on the date of the granting of the Option. (4) Market Value Per Share. The Market Value Per Share as of any particular date shall be the mean between the highest and lowest quoted selling prices for shares of Common Stock as reported on the composite tape on such date (or, if such date shall not be a business day, then the next preceding day which shall be a business day); or, if no sale takes place, then the mean between the bid and asked prices on such date; and if no bid and asked prices are quoted for such date, then such value as shall be determined by such method as the Committee shall deem to reflect fair market value as of such date. (5) Term. The term of each Option and related Stock Appreciation Right shall be determined by the Committee at the date of grant; provided, however, that each Option and related Stock Appreciation Right shall expire not more than ten years from the date the Option is granted. (6) Date of Exercise. Each Stock Option Agreement shall state that the Option or Stock Appreciation Right granted therein may not be exercised in whole or in part for any period or periods of time specified in such agreement or otherwise as specified by the Committee. Except as may be so specified, any Option or related Stock Appreciation Right may be exercised in whole at any time or in part from time to time during its term; provided, however, that no Option, or portion thereof, or related Stock Appreciation Right may be exercisable until at least one year after the date of grant of such Option. (7) Termination of Employment. In the event that an optionee's employment by CMC or any of its Subsidiaries shall terminate, the optionee's Options and related Stock Appreciation Rights, if any, shall terminate immediately, except as hereinafter provided in this subsection. The Committee, in its sole discretion, may determine that the optionee's Options and/or related Stock Appreciation Rights, if page 5
any, to the extent exercisable immediately prior to such termination of employment, may remain exercisable for a designated period of time not to exceed 90 days after such termination of employment. If any termination of employment is due to retirement with the consent of CMC, the optionee shall have the right, subject to the provisions of subsections (5) and (6) above, to exercise each of his Options and related Stock Appreciation Rights, if any, at any time until the end of the term of each such Option and related Stock Appreciation Right to the extent that the optionee was entitled to exercise the same immediately prior to such retirement. Retirement by an optionee on or after the optionee's normal retirement date in accordance with the provisions of the retirement plan of CMC or one of its Subsidiaries under which the optionee is then covered shall be deemed to be retirement with the consent of CMC. Termination of an optionee's employment due to disability (as determined by the Committee in its sole discretion) shall be deemed, solely for purposes of this Section 4(d)(7), to be a retirement with the consent of CMC; provided that if the optionee thereafter returns to employment with CMC or any of its Subsidiaries, the optionee's employment shall be deemed for purposes of this Section 4(d)(7) to have never been terminated. Whether any other termination of employment is to be considered a retirement with the consent of CMC and whether an authorized leave of absence or absence on military or government service or for other reasons shall constitute a termination of employment for the purposes of the Plan shall be determined by the Committee. If an optionee shall die (whether in the employment of CMC or any of its Subsidiaries or following the optionee's retirement with the consent of CMC) while entitled to exercise an Option and related Stock Appreciation Right, if any, the optionee's estate, personal representative, or beneficiary, as the case may be, shall have the right, subject to the provisions of subsections (5) and (6) above, to exercise the Option and related Stock Appreciation Right, if any, at any time within thirty-six months after the date of the optionee's death (but in no event later than the expiration of the term of each such Option and related Stock Appreciation Right, if any), to the extent that the optionee was entitled to exercise the same immediately prior to the optionee's death. (8) Recapitalization. The aggregate number of shares determined under Section 3 and stated in Section 4(b)(2), the maximum number of shares that may be made the subject of awards of Options or Stock Appreciation Rights to any individual in any calendar year, the number of Option Shares to which each outstanding Option and Stock Appreciation Right relates, and the option price in respect of each such Option and Stock Appreciation Right, shall all be proportionately adjusted for any increase or decrease in the number of issued shares of Common Stock resulting from a subdivision or consolidation of shares or other capital adjustments, or the payment of a stock dividend or other increase or decrease in such shares, effected without receipt of consideration by CMC or a Subsidiary; provided, however, that any fractional shares resulting from any such adjustment shall be eliminated. (9) Certain Mergers or Consolidations. After a merger of one or more page 6
corporations into CMC, or after a consolidation of CMC and one or more corporations (a "Merger Event"), in which CMC shall be the surviving or resulting corporation, an optionee shall, at the same cost, be entitled upon the exercise of an Option, to receive (subject to any required action by stockholders) such securities of the surviving or resulting corporation, as shall be equivalent, as nearly as practicable, to the nearest whole number and class of shares of stock or other securities, to the Option Shares which were then subject to such Option, and such shares of stock or other securities shall, after such merger or consolidation, be deemed to be Option Shares for all purposes of the Plan and of the Options and Stock Appreciation Rights granted under the Plan. (10) Other Transactions. If CMC enters into any agreement with respect to any transaction which would, if consummated, result in a Merger Event in which CMC will not be the surviving corporation, the Committee shall, in its sole discretion, and without liability to any person, determine what actions shall be taken with respect to outstanding Options and related Stock Appreciation Rights, if any, including without limitation, the payment of a cash amount in exchange for the cancellation of the Option and any related Stock Appreciation Right or requiring the issuance of substitute options, that will substantially preserve the value, rights and benefits of any affected Options and/or related Stock Appreciation Rights previously granted hereunder as of the date of the consummation of the Merger Event. (11) Optionee's Agreement. If, at the time of the exercise of any Option or Stock Appreciation Right, in the opinion of counsel for CMC, it is necessary or desirable, in order to comply with any then applicable laws or regulations relating to the sale of securities, that the optionee exercising the Option or Stock Appreciation Right shall agree to hold any Option Shares issued to the optionee for investment and without any present intention to resell or distribute the same and that the optionee will dispose of such shares only in compliance with such laws and regulations, the optionee will, upon the request of CMC, execute and deliver to CMC a further agreement to such effect. e. EFFECT OF EXERCISE OF OPTIONS AND STOCK APPRECIATION RIGHTS. The right of an optionee to exercise an Option shall terminate to the extent that such Option is exercised and to the extent that the Option Shares subject to such Option are used to calculate amounts receivable upon the exercise of a related Stock Appreciation Right. The right of an optionee to exercise a Stock Appreciation Right shall terminate to the extent that such Stock Appreciation Right is exercised and, also, to the extent that such optionee exercises the Option to which such Stock Appreciation Right is related. f. OPTIONS AND RIGHTS IN SUBSTITUTION FOR STOCK OPTIONS GRANTED BY OTHER CORPORATIONS. Options and Stock Appreciation Rights may be granted under the Plan from time to time in substitution for stock options held by employees of corporations who become salaried employees of CMC or of any Subsidiary as a result of a merger or consolidation of the employing corporation with CMC or such Subsidiary, or the acquisition by CMC or a Subsidiary of the assets of the employing page 7
corporation, or the acquisition by CMC or a Subsidiary of stock of the employing corporation with the result that such employing corporation becomes a Subsidiary. g. APPLICATION OF FUNDS. The proceeds received by CMC from the sale of Option Shares pursuant to Options will be used for general corporate purposes. 5. RESTRICTED STOCK UNITS AND RESTRICTED STOCK a. ELIGIBILITY. The individuals who shall be eligible to receive an award of Restricted Stock Units under the Plan shall be all salaried employees (including officers and directors who are salaried employees) of CMC, or of any Subsidiary, as the Committee from time to time shall determine. b. AWARDS OF RESTRICTED STOCK UNITS. The Committee, at any time and from time to time, may determine (subject to the limitation contained in Section 3): 63 10 (i) those eligible individuals, if any, who shall receive an award of Restricted Stock Units under the terms of the Plan; (ii) the number of Restricted Stock Units that shall be awarded to each such individual; (iii) the terms and conditions which must be satisfied for the restrictions and conditions on each Restricted Stock Unit to be removed, and the period of time during which such terms and conditions shall apply, which period shall be not less than three years from the date of the award, unless the Committee otherwise determines, in which event such period shall not be less than one year from the date of the award; and (iv) the time and manner in which all or a portion of each award shall be paid to such individual in accordance with the provisions of Section 5(e). c. DESCRIPTION OF RESTRICTED STOCK UNITS. A Restricted Stock Unit awarded to an employee shall entitle the employee to receive, upon the satisfaction of the terms and conditions established under Section 5(b), a share of Common Stock. The holder of a Restricted Stock Unit shall be entitled to receive a cash payment on each dividend payment date for Common Stock as if such Restricted Stock Unit were a share of Common Stock. The number of shares of Common Stock subject to an award of Restricted Stock Units shall be appropriately adjusted, from time to time, in the manner provided in Sections 4(d)(8) and 4(d)(9) for any stock dividend, stock split, recapitalization, reorganization, merger, consolidation, split-up or any similar change affecting the Common Stock. After the satisfaction of the terms and conditions set by the Committee at the time of the grant of an award of Restricted Stock Units to an employee, the Secretary of CMC shall be so advised and a certificate for the appropriate number of shares of Common Stock shall be delivered to the employee. The remaining Restricted Stock Units granted under such award, if any, shall either be canceled or, if appropriate under the terms of the award, shall continue to be subject to the restrictions, terms and conditions set by the Committee at the time of the grant of the award. The Committee may from time to time before the satisfaction of the terms and conditions established under Section 5(b) with respect to an award of Restricted Stock Units determine to convert all or a portion of such Restricted Stock Units into an equivalent number of shares of Restricted Stock. 64 11 d. DESCRIPTION OF RESTRICTED STOCK. A share of Restricted Stock issued upon the conversion of a Restricted Stock Unit is a share of Common Stock which may not be sold, exchanged, pledged, transferred, assigned, hypothecated or otherwise encumbered or disposed of until the terms and page 8
conditions set by the Committee at the time of the award of the Restricted Stock Unit have been satisfied. A share of Restricted Stock shall be subject to the same restrictions, terms and conditions as applied to the converted Restricted Stock Unit. If an employee receives shares of Restricted Stock, the employee shall be the record owner of such shares and shall have all the rights of a stockholder with respect to such shares, including the right to vote and the right to receive dividends or other distributions made or paid with respect to such shares. Any certificate or certificates representing shares of Restricted Stock shall bear the following legend: The shares represented by this certificate have been issued pursuant to the terms of an award under The Chase Manhattan 1994 Long-Term Incentive Plan and may not be sold, exchanged, pledged, transferred, assigned, hypothecated or otherwise encumbered or disposed of in any manner until such time as is set forth in the terms of such award dated . Any new, additional or different securities that an employee may become entitled to receive with respect to any shares of Restricted Stock by virtue of a stock dividend, stock split, recapitalization, reorganization, merger, consolidation, split-up, or any similar change affecting the Common Stock shall be subject to the same restrictions, terms and conditions as apply to such shares of Restricted Stock. In order to enforce the restrictions, terms and conditions which may be applicable to an employee's shares of Restricted Stock, the Committee may require the employee, upon the receipt of a certificate or certificates representing such shares, or at any time thereafter, to deposit such certificate or certificates together with stock powers and other instruments of transfer, appropriately endorsed in blank, with CMC or an escrow agent designated by CMC under an escrow agreement in such form as shall be determined by the Committee. After the satisfaction of the terms and conditions set by the Committee at the time of an award of Restricted Stock Units to an employee which are applicable to shares of Restricted Stock, a new certificate, without the legend set forth above, for the number of shares which are no longer subject to such restrictions, terms and conditions shall be delivered to the employee. The remaining shares of Restricted Stock issued with respect to such award, if any, shall either be canceled or, if 65 12 appropriate under the terms of the award applicable to such shares, shall continue to be subject to the restrictions, terms and conditions set by the Committee at the time of the award. e. PAYMENT OF RESTRICTED STOCK UNITS AND RESTRICTED STOCK. (1) In General. The satisfaction of the terms and conditions set by the Committee at the time of an award of Restricted Stock Units and the delivery of a certificate, without the legend set forth above, for the portion of such award which is no longer subject to such restrictions, terms and conditions is hereinafter referred to as the "payment" of such portion of the award (or the shares of Restricted Stock into which it may be converted). Subject to the provisions of this Section 5(e) and Sections 5(c) and 5(d), each award shall be paid at the time and in the manner specified by the Committee at the time of the award. (2) Payment in the Event of Termination of Employment. If the employment with CMC of an employee to whom an award of Restricted Stock Units has been made is terminated for any reason (including death, but excluding disability (as determined by the Committee in its sole discretion), which for purposes of this Section 5(e) shall not be deemed a termination of employment) before satisfaction of the terms and conditions for the payment of all or a portion of the award, then only such portion of the award, if any, shall be paid as shall have been specified by the Committee at the time of the award and the remaining portion of such award shall be canceled. If an employee to whom Restricted Stock Units have been awarded dies after satisfaction of the terms and conditions for the payment of all or a portion of an award but prior to the actual payment of all or such portion of the award, such payment shall be made to the employee's beneficiary or beneficiaries at the time and in the same manner that such payment would have been made to the employee. 6. CHANGE IN CONTROL PROVISIONS. a. STOCK OPTIONS AND STOCK APPRECIATION RIGHTS. Notwithstanding any provision in the Plan or in any Stock Option Agreement to page 9
the contrary, the following provisions shall apply if there is a Change in Control, as defined in Section 6(e): (1) Any Option or Stock Appreciation Right, other than an Incentive Stock Option and related Stock Appreciation Rights, which is not otherwise exercisable at the date of the Change in Control may be exercised, subject to the provisions of Sections 4(d)(5) and 4(d)(7), at any time after the date of the Change in Control. 66 13 (2) If an optionee's employment is terminated within twenty-four months after a Change in Control, unless such termination is (i) for Cause (as defined in Section 6(e)), (ii) by reason of death, Disability (as defined in Section 6(e)), or retirement with the consent of CMC (as defined in Section 4(d)(7)), or (iii) by the optionee without Good Reason (as defined in Section 6(e)), the optionee shall have the right, subject to the provisions of Section 4(d)(5), to exercise his Options and Stock Appreciation Rights at any time within the twenty-four month period after such termination of employment. After a Change in Control, any purported termination of an employee's employment (other than by reason of death) shall be communicated by a Notice of Termination (as defined in Section 6(e)) from CMC to the employee or from the employee to CMC, as the case may be. b. RESTRICTED STOCK UNITS AND RESTRICTED STOCK. Notwithstanding any provision of the Plan or any terms or conditions relating to any Restricted Stock Units or shares of Restricted Stock to the contrary, in the event of a Change of Control, the terms and conditions set by the Committee at the time of an award of Restricted Stock Units shall be deemed to have been satisfied and, within 15 days after the Change in Control, a certificate for the appropriate number of shares of Common Stock shall be delivered to the employee to whom such Restricted Stock Units were awarded. Further, at the time of a Change in Control the terms and conditions with respect to any shares of Restricted Stock issued under the Plan shall be deemed to have been satisfied and, within 15 days after the Change in Control, the holder of such shares shall receive a new certificate for such shares without the legend set forth in Section 5(d). c. TERMINATION AS A RESULT OF A POTENTIAL CHANGE IN CONTROL. For purposes of Section 6(a)(2), an employee's employment shall be deemed to have been terminated following a Change in Control without Cause or by the employee with Good Reason, if the employee's employment is terminated prior to a Change in Control without Cause at the request of a Person (as defined in Section 6(e)) who has entered into an agreement with CMC the consummation of which will constitute a Change in Control or if the employee terminates his employment with Good Reason prior to a Change in Control (determined by treating a Potential Change in Control (as defined in Section 6(e)), as a Change in Control in applying the definition of Good Reason) if the circumstance or event which constitutes Good Reason occurs at the request of such Person. Further, for all purposes of Sections 6(a)(1), 6(b) and 6(d), in determining any such employee's rights to exercise Options and Stock Appreciation Rights, to receive a distribution of shares of Common Stock with respect to Restricted Stock Units, or to have the restrictions on shares of Restricted Stock deemed satisfied, a Change in Control shall be deemed to have occurred immediately prior to the employee's termination of employment. 67 14 d. RESTRICTION ON POWER TO AMEND AND TERMINATE. Notwithstanding any provision in the Plan or in any award granted under the Plan to the contrary, while Section 9 of the Plan reserves to the Committee the right, subject to certain limitations and restrictions, to from time to time and at any time alter, amend, suspend, discontinue or terminate the Plan and any awards granted under the Plan, no such action of the Committee, nor any action by the Board of Directors, shall adversely affect an employee's rights under any award granted under the Plan without the written consent of such employee if such action is within twenty-four months after the month in which a Change in Control occurred or is within twelve months after a Potential Change in Control. e. DEFINITIONS. For purposes of this Section 6, the following words and page 10
phrases shall have the meaning specified: (1) "Beneficial Owner" shall have the meaning defined in Rule 13d-3 of the Exchange Act. (2) "Cause" shall mean, unless otherwise defined in an employee's individual severance agreement with CMC or, with respect to an employee who is a participant in CMC's Special Severance Plan, in such Special Severance Plan (in which case said definition shall govern), the termination of an employee's employment, after a Change in Control, as a result of (i) the willful and continued failure by the employee to substantially perform the employee's duties, as they may be defined from time to time, with the employee's employers or abide by the written policies of CMC or the employee's primary employer (other than any such failure resulting from the employee's incapacity due to physical or mental illness or any such actual or anticipated failure after the issuance of a Notice of Termination for Good Reason by the employee) after a written demand for substantial performance is delivered to the employee by the Corporate Human Resources Executive of CMC, which demand specifically identifies the manner in which the Corporate Human Resources Executive believes that the employee has not substantially performed the employee's duties or has not abided by such written policies, or (ii) the willful engaging by the employee in conduct which is demonstrably and materially injurious to CMC or its Subsidiaries, monetarily or otherwise. For purposes of the preceding sentence, no act, or failure to act, on a employee's part shall be deemed "willful" unless done, or omitted to be done, by the employee not in good faith and without reasonable belief that the employee's act, or failure to act, was in the best interest of CMC and its Subsidiaries. (3) A "Change in Control" shall be deemed to have occurred if any one of the following conditions shall have been satisfied: 68 15 (i) any Person is or becomes the Beneficial Owner, directly or indirectly, of securities of CMC (not including in the securities beneficially owned by such Person any securities acquired directly from CMC or its affiliates) representing 25 percent or more of the combined voting power of CMC's then outstanding securities; or (ii) during any period of twenty-four consecutive months, individuals who at the beginning of such period constitute the Board of Directors and any new director (other than a director designated by a Person who has entered into an agreement with CMC to effect a transaction described in subsections (i), (iii) or (iv) of this Section) whose election by the Board of Directors or nomination for election by CMC's stockholders was approved by a vote of at least two-thirds of the directors then still in office who either were directors at the beginning of the period or whose election or nomination for election was previously so approved, cease for any reason to constitute a majority of the Board of Directors; or (iii) the stockholders of CMC approve a merger or consolidation of CMC with any other corporation, or a plan of complete liquidation of CMC, other than (A) a merger, consolidation or liquidation which would result in the voting securities of CMC outstanding immediately prior thereto continuing to represent (either by remaining outstanding or being converted into voting securities of the surviving entity), in combination with the ownership of any trustee or other fiduciary holding securities under an employee benefit plan of CMC or a Subsidiary, at least 80 percent of the combined voting power of the voting securities of CMC or such surviving entity outstanding immediately after such merger, consolidation or liquidation, or (B) a merger, consolidation or liquidation effected to implement a recapitalization of CMC (or similar transaction) in which no Person acquires more than 50 percent of the combined voting power of CMC's then outstanding securities; or (iv) the stockholders of CMC approve an agreement for the sale or disposition by CMC (other than to a Subsidiary) of all or substantially all CMC's assets. Notwithstanding the foregoing, with respect to a particular employee, a Change in Control shall not include any event, circumstance or transaction occurring during the twelve- month period following a Potential Change in Control which results from the action of any entity or group which includes, is affiliated with or is wholly or partly controlled by one or more executive officers of CMC in which the employee participates (a "Management Group"); provided, however, that such action shall not be taken 69 16 into account for this purpose if it occurs within a twelve-month period following a Potential Change in Control resulting from the action of any Person which is not a Management Group. (4) "Date of Termination" shall mean (i) if an employee's employment is terminated for page 11
Disability, 30 days after Notice of Termination is given (provided that the employee shall not have returned to the full-time performance of the employee's duties during such 30 day period), and (ii) if an employee's employment is terminated for any other reason, the date specified in the Notice of Termination (which, in the case of a termination by the employee's employer, shall not be less than 30 days (except in the case of a termination for Cause) and, in the case of a termination by the employee, shall not be less than 15 days nor more than 60 days, respectively, from the date such Notice of Termination is given). (5) "Disability" shall be deemed to be the reason for the termination of an employee's employment, if, as a result of the employee's incapacity due to physical or mental illness, the employee shall have been absent from the full-time performance of the employee's duties with the employee's employer for a period of six consecutive months, a Notice of Termination for Disability shall have been given to the employee, and, within 30 days after such Notice of Termination is given, the employee shall not have returned to the full-time performance of the employee's duties. (6) "Exchange Act" shall mean the Securities Exchange Act of 1934, as amended from time to time. (7) "Good Reason" for termination by a employee of the employee's employment shall mean, unless otherwise defined in an employee's individual severance agreement with CMC or, with respect to an employee who is a participant in CMC's Special Severance Plan, in such Special Severance Plan (in which case said definition shall govern), the occurrence (without the employee's express written consent) of any one of the following acts by the employee's employer, or failure by the employee's employer to act, unless, in the case of any act or failure to act described in subsection (i), (iii) or (iv) of this subsection, such act or failure to act is corrected prior to the Date of Termination specified in the Notice of Termination given in respect thereof: (i) the assignment to the employee of any duties materially inconsistent with the nature and status of the employee's responsibilities immediately prior to a Change in Control, or a substantial adverse alteration in the nature or status of the employee's responsibilities from those in effect immediately prior to the Change in Control; provided, however, that a redesignation of the employee's title or employer among CMC and its Subsidiaries shall not constitute Good Reason if the employee's overall duties and status among CMC and its Subsidiaries are not substantially adversely affected; (ii) a reduction in the employee's annual base salary as in effect on May 1, 1994 (or the employee's most recent date of hire, if later), as the same may be increased from time to time, where "annual base salary" is the employee's regular basic annual compensation prior to any reduction therein under a salary reduction agreement pursuant to Section 401(k) or Section 125 of the Code, and, without limitation, shall not include, cost of living allowances and post allowances for foreign service, fees, retainers, reimbursements, bonuses, incentive awards, prizes or similar payments; (iii) the failure by the employee's primary employer to pay to the employee any portion of the employee's current compensation, or to pay to the employee any portion of an installment of deferred compensation under any deferred compensation program, within seven days of the date such compensation is due; or (iv) any purported termination of the employee's employment which is not effected pursuant to a Notice of Termination, and for purposes of this Section, no such purported termination shall be effective. An employee's right to terminate the employee's employment for Good Reason shall not be effected by the employee's incapacity due to physical or mental illness. The employee's continued employment shall not constitute consent to, or a waiver of rights with respect to, any act or failure to act constituting Good Reason hereunder. (8) "Notice of Termination" shall mean, unless otherwise defined in an employee's individual severance agreement with CMC or, with respect to an employee who is a participant in CMC's Special Severance Plan, in such Special Severance Plan (in which case said definition shall govern), a written notice which shall indicate the specific termination provision in this Section 6 relied upon and shall set forth in reasonable detail the facts and circumstances claimed to provide a basis for termination of the employee's employment under the provision so indicated. A Notice of Termination for Cause is required to include a statement signed by the Corporate Human Resources Executive of CMC that, in the good page 12
faith opinion of the Corporate Human Resources Executive, the employee engaged in conduct set forth in Section 6(e)(2)(i) or 6(e)(2)(ii) (the definition of Cause), and specifying the particulars thereof in detail. (9) "Person" shall have the meaning given in Section 3(a)(9) of the Exchange Act, as modified and used in Sections 13(d) and 14(d) thereof; provided, however, a Person shall not include (i) CMC or any Subsidiary, (ii) a trustee or other fiduciary holding securities under an employee benefit plan of CMC or a Subsidiary, (iii) an underwriter temporarily holding securities pursuant to an offering of such securities, or (iv) a corporation owned, directly or indirectly, by the stockholders of CMC in substantially the same proportions as their ownership of stock of CMC. (10) "Potential Change in Control" shall be deemed to have occurred if any one of the following conditions shall have been satisfied: (i) CMC enters into an agreement, the consummation of which would result in the occurrence of a Change in Control; (ii) CMC or any Person publicly announces an intention to take or to consider taking actions which, if consummated, would constitute a Change in Control; (iii) any Person who is or becomes the Beneficial Owner, directly or indirectly, of securities of CMC representing 15 percent or more of the combined voting power of CMC's then outstanding securities, increases such Person's beneficial ownership of such securities by 5 percentage points or more over the percentage so owned by such Person on July 18, 1990; or (iv) the Board of Directors adopts a resolution to the effect that, for purposes of the Plan, a Potential Change in Control has occurred. 7. WITHHOLDING FOR TAXES Any cash payment under the Plan shall be reduced by any amounts required to be withheld or paid with respect thereto under all present or future federal, state and local tax and other laws and regulations which may be in effect as of the date of each such payment. Any distribution of shares of Common Stock under the Plan shall not be made until appropriate arrangements have been made for the payment of any amounts which may be required to be withheld or paid with respect thereto, including, but not limited to, withholding the distribution of a portion of the shares of Common Stock otherwise issuable or the tendering of such shares back to CMC (under such rules and conditions as may be established by the Committee) in order to satisfy all or a portion of the required withholdings or payments. 8. DESIGNATION OF BENEFICIARY Each employee to whom an award or awards of Restricted Stock Units has been made under this Plan may designate a beneficiary or beneficiaries (which beneficiary may be an entity other than a natural person) to receive any payment which under the terms of such award or awards may become payable on or after the employee's death. At any time, and from time to time, any such designation may be changed or canceled by the employee without the consent of any such beneficiary. Any such designation, change or cancellation must be on a form provided for that purpose by the Committee and shall not be effective until received by the Committee. If no beneficiary has been named by a deceased employee, or the designated beneficiaries have predeceased the employee, the beneficiary shall be the employee's estate. If an employee designates more than one beneficiary, any payments under this Plan to such beneficiaries shall be made in equal shares unless the employee has designated otherwise, in which case the payments shall be made in the page 13
shares designated by the employee. 9. AMENDMENT AND TERMINATION The Committee may from time to time and at any time alter, amend, suspend, discontinue or terminate this Plan and any awards granted hereunder; provided, however, that no such action of the Committee may, without the approval of the shareholders of CMC, alter the provisions of the Plan so as to (i) increase the maximum number of shares of Common Stock which may be made the subject of awards in any calendar year (except as provided in Section 3(b)) or increase the maximum number of shares of Common Stock as to which awards of Options and Stock Appreciation Rights may be made to any awardee in any calendar year (except as provided in Section 4(b)(1)); (ii) change the class of employees eligible to receive awards under the Plan; (iii) extend beyond ten years the maximum term of Incentive Stock Options or related Stock Appreciation Rights granted under the Plan or increase the aggregate number of shares of Common Stock as to which Incentive Stock Options may be granted under the Plan (except as provided in Section 4(b)(2)); (iv) permit the option price of any Option Share to be less the Market Value Per Share on the date of the granting of the Option; (v) withdraw the administration of the Plan from the Committee; or (vi) permit any member of the Committee to be eligible to receive an award pursuant to the terms of the Plan. No alteration, amendment, suspension, discontinuance or termination of any individual award (as opposed to any such action with respect to this Plan) shall, however, materially adversely affect the rights of any awardee without the written consent of the awardee. Notwithstanding the proviso to the first sentence of this Section 9 or the provisions of the second sentence of this Section 9, the Committee may alter, 73 20 amend, suspend, discontinue or terminate this Plan and any awards granted hereunder without the approval of the shareholders of CMC or any awardee under the Plan if necessary in order to enable the Plan or any award hereunder, or any other plan of CMC or any Subsidiary intended to be so qualified or any award thereunder, to qualify for (x) the exemption provided by Rule 16b-3, (y) the benefits provided under Section 422 of the Code, or (z) the exclusion for qualified performance-based compensation under Section 162(m) of the Code and the Section 162(m) Regulations. 10. PREEMPTION BY APPLICABLE LAWS AND REGULATIONS Anything in the Plan or any Stock Option Agreement or other agreement entered into pursuant to the Plan to the contrary notwithstanding, if, at any time specified herein or therein for the making of any determination, the issue or other distribution of shares of Common Stock, or the payment of consideration to an employee as a result of the exercise of any Stock Appreciation Right, as the page 14
case may be, any law, regulation or requirement of any governmental authority having jurisdiction in the premises shall require either CMC or the employee (or the employee's beneficiary thereof), as the case may be, to take any action in connection with any such determination, the shares then to be issued or distributed, or such payment, the issue or distribution of such shares or the making of such determination or payment, as the case may be, shall be deferred until such action shall have been taken. 11. MISCELLANEOUS a. NO EMPLOYMENT CONTRACT. Nothing contained in the Plan or any Stock Option Agreement or other agreement shall be construed as conferring upon an employee the right to continue in the employ of CMC or any Subsidiary. b. EMPLOYMENT WITH SUBSIDIARIES. Employment by CMC for the purposes of this Plan shall be deemed to include employment by, and to continue during any period in which an employee is in the employment of, any Subsidiary. c. NO RIGHTS AS A STOCKHOLDER. An employee shall have no rights as a stockholder with respect to Option Shares covered by the employee's Options or Stock Appreciation Rights until the date of the issuance of such shares to the employee and only after such shares are fully paid. No adjustment will be made for dividends or other distributions or rights for which the record date is prior to the date of such issuance. An employee shall have no rights as a stockholder with respect to any award of Restricted Stock Units under the Plan. d. NO RIGHT TO CORPORATE ASSETS. Nothing contained in the Plan shall be construed as giving an employee, the employee's beneficiaries or any other person any equity or interest of any kind in any assets of CMC or a Subsidiary or creating a trust of any kind or a fiduciary relationship of any kind between CMC or a Subsidiary and any such person. e. NO RESTRICTION ON CORPORATE ACTION. Nothing contained in the Plan shall be construed to prevent CMC or any Subsidiary from taking any corporate action which is deemed by CMC or such Subsidiary to be appropriate or in its best interest, whether or not such action would have an adverse effect on the Plan or any award made under the Plan. No employee, beneficiary or other person shall have any claim against CMC or any Subsidiary as a result of any such action. f. NON-ASSIGNABILITY. Neither an employee nor an employee's beneficiary shall have the power or right to sell, exchange, pledge, transfer, assign, hypothecate or otherwise encumber or dispose of such employee's or beneficiary's interest in the Plan or in any award received under the Plan, other than by will or the laws of descent and distribution; nor shall such interest be subject to seizure for the payment of an employee's or beneficiary's debts, judgments, alimony, or separate maintenance or be transferable by operation of law in the event of an employee's or beneficiary's bankruptcy or insolvency. Any Option or Stock Appreciation Right granted under the page 15
Plan shall be exercisable during an awardee's lifetime only by such awardee or his or her guardian or legal representative. CMC's or a Subsidiary's obligations under the Plan are not assignable or transferable except to a corporation which acquires all or substantially all of the assets of CMC or such Subsidiary or to any corporation into which CMC or such Subsidiary may be merged or consolidated. g. OTHER BENEFIT PLANS. No awards or payments under the Plan shall be taken into account in determining any benefits under any retirement, profit-sharing or other plan maintained by CMC or a Subsidiary. h. GOVERNING LAW; CONSTRUCTION. All rights and obligations under the Plan shall be governed by, and the Plan shall be construed in accordance with, the laws of the State of New York. Titles and headings to Sections herein are for purposes of reference only, and shall in no way limit, define or otherwise affect the meaning or interpretation of any provisions of the Plan. i. EFFECTIVE DATE. The Plan shall be effective May 1, 1994, subject to the approval of the Plan by the stockholders of CMC in accordance with Rule 16b-3 and Sections 162(m) and 422 of the Code. page 16
Exhibit 10.5(b) THE CHASE MANHATTAN CORPORATION 1994 LONG-TERM INCENTIVE PLAN INSTRUMENT OF AMENDMENT WHEREAS, The Chase Manhattan Corporation has reserved the right to amend The Chase Manhattan 1994 Long-Term Incentive Plan (the "Plan"); WHEREAS, the Compensation Committee of the Board of Directors of The Chase Manhattan Corporation has the authority to amend the Plan and desires to amend the Plan as set forth in this Instrument of Amendment; NOW, THEREFORE, the Plan is hereby amended as follows: 1. Section 6(a) of the Plan is amended as follows: (a) The phrase "Except as provided in clause (3) below," shall be added to the beginning of each of clauses (1) and (2) of Section 6(a). (b) The following new clause (3) shall be added to the end of Section 6(a): (3) If an optionee's employment is terminated after the occurrence of an Approved Change in Control (as defined in Section 6(e)(iii) below), unless such termination is (i) for "Cause" (as defined in Section 6(e) below), or (ii) by the optionee without Good Reason (as defined in Section 6(e) below but excluding for this purpose subsection (i) thereof), the optionee's outstanding Options and Stock Appreciation Rights shall become immediately exercisable and the optionee shall have the right, subject to the provisions of Section 4(d)(5) above, to exercise such Options and Stock Appreciation Rights, at any time within the twenty-four month period after such termination of employment. After the occurrence of an Approved Change in Control, any purported termination of an employee's employment (other than by reason of death) shall be communicated by a Notice of Termination (as defined in Section 6(e) below) from CMC to the employee or from the employee to CMC, as the case may be. 2. Section 6(b) of the Plan is amended as follows: (a) The following phrase shall be inserted immediately after the first use of the phrase "Change in Control" in Section (b):
2 or a termination of employment under circumstances described in Section 6(a)(3) above that would entitle such employee to exercise immediately any outstanding Options awarded to such employee (b) The phrase "or such termination" shall be inserted immediately after the second, third and fourth uses of the phrase "Change in Control" in Section 6(b). 3. Section 6(c) is amended by adding the following new sentences at the end thereof: For purposes of this Section 6(c), the definition of "Change in Control" shall be that set forth in Section 6(e) below except that the third sentence of Section 6(e)(3) shall be ignored. The definition of "Good Reason" applicable to any Potential Change in Control relating to any Approved Change in Control shall, for purposes of this Section 6(c), exclude subsection (i) of the definition of "Good Reason" set forth in Section 6(e)(7) hereof. 4. Section 6(d) is amended by adding the following new sentence the end thereof: For purposes of this Section 6(d), the definition of "Change in Control" shall be that set forth in Section 6(e) below except that the third sentence of Section 6(e)(3) shall be ignored. 5. Section 6(e)(3) of the Plan is amended by inserting at the end thereof the following: For purposes of this Plan, any Approved Change in Control shall not constitute a Change in Control. As used herein, the term "Approved Change in Control" means any Change in Control occurring by reason of or upon the occurrence of the transactions and events contemplated by the Merger Agreement. "Merger Agreement" means any agreement or plan of merger or consolidation between CMC and Chemical Banking Corporation that is approved by the Boards of Directors of CMC and Chemical Banking Corporation on or before September 30, 1995, as modified from time to time.
3 6. This Instrument of Amendment shall be effective as of August 25, 1995. IN WITNESS WHEREOF, The Chase Manhattan Corporation has executed this Instrument of Amendment as of August 25, 1995. THE CHASE MANHATTAN CORPORATION By: /s/ JOHN J. FARRELL ---------------------------- John J. Farrell Executive Vice President
EXHIBIT 10.6 CHEMICAL BANKING CORPORATION LONG-TERM INCENTIVE PLAN (As amended and restated effective as of May 19, 1992) 1. PURPOSE The purposes of the Chemical Banking Corporation Long-Term Stock Incentive Plan (the "Plan") are to encourage selected key employees of the Company to acquire a proprietary and vested interest in the growth and performance of the company, to generate an increased incentive to contribute to the Company's future success and prosperity, thus enhancing the value of the Company for the benefit of stockholders, and to enhance the Company's ability to attract and retain individuals of exceptional managerial talent upon whom, in large measure, the sustained progress, growth and profitability of the Company depends. The purposes of the Plan are to be achieved through the grant of various types of stock-based awards. 2. DEFINITIONS For purposes of the Plan, the following terms shall have the meanings set forth in the Section 2: "Award" shall mean any type of stock-based award granted pursuant to the Plan. "Board" shall mean the Board of Directors of CBC; provided that any action taken by a duly authorized committee of the Board within the scope of authority delegated to such committee by the Board shall be considered an action of the Board for purposes of this plan. "CBC" shall mean Chemical Banking Corporation, and, except as otherwise specified in this Plan in a particular context, any successor thereto, whether by merger, consolidation, purchase of substantially all its assets or otherwise. "Code" shall mean the Internal Revenue Code of 1986, as from time to time amended. "Committee" shall mean the Compensation and Benefits Committee of the Board or any subcommittee thereof composed of not less than two directors, each of whom is a "disinterested person" as defined in Rule 16 b-3 promulgated by the Securities and Exchange Commission under the Securities Exchange Act of 1934, or any successor definition adopted by the Commission. "Common Stock" shall mean the common stock of CBC, $1 par value. "Company" shall mean CBC and its Subsidiaries.
"Employee" shall mean any salaried employee of the Company. "Executive Officer" shall mean a Participant who is subject to the requirements of Sections 16(a) and 16(b) of the Securities Exchange Act of 1934. "Fair Market Value" shall mean, per share of Common Stock, the average of high and low sale prices of the Common Stock as reported on the New York Stock Exchange (the "NYSE") composite tape on the applicable date, or, if there are no such sale prices of Common Stock reported on the NYSE composite tape on such date, then the average price of the Common Stock on the last previous day on which high and low sale prices are reported on the NYSE composite tape. "Other Stock-Based Award" shall mean any of those Awards described in Section 8 hereof. "Participant" shall mean an Employee who is selected by the Committee to receive an Award under the Plan. "Retirement" shall mean normal or early retirement under the terms of a retirement plan of CBC or a Subsidiary or voluntary termination of employment; provided, however, that in either case, CBC must have given its prior consent to treat the individual's termination of employment as a retirement. "Subsidiary" shall mean any corporation which at the time qualifies as a subsidiary of CBC under the definition of "subsidiary corporation" in Section 424(f) of the code, as amended from time to time. "Total Disability" shall mean a physical or mental incapacity, which would entitle the individual to benefits under the long term disability program sponsored by the Subsidiary employing such individual; provided that if an individual has not elected coverage under the applicable program, Committee shall determine utilizing the criteria of such program whether the individual has incurred a Total Disability. 3. Shares Subject to the Plan. (a) Shares of Common Stock which may be issued under the plan may be either authorized and unissued shares of Common Stock or authorized and issued shares of Common Stock held in CBC's Treasury. Subject to adjustment as provided in Section 14, the number of shares of Common Stock with respect to which Awards (whether distributable in shares of Common Stock or in cash) may be granted under the Plan in any calendar year shall be 1.5 percent of the total shares of Common Stock outstanding on the last day of the preceding calendar year (including treasury shares); provided, that no more than a total of 15 million shares of Common Stock during the term of the Plan may be subject to incentive stock options; provided, further that grants excluded from the definition of derivative security by Rule 16a-1(c)(3)(ii) promulgated under the Securities Exchange Act of 1934, shall not be subject to the limit placed on the total shares of Common Stock with respect to which Awards may be granted hereunder. 2
(b) Notwithstanding Section 3(a), to the extent that the number of shares of Common Stock with respect to which Awards may be granted under the Plan in any calendar year exceeds the number of shares of Common Stock with respect to which Awards were granted under the Plan during that calendar year, such excess shall be available for grant under the Plan in succeeding calendar years. (c) In the event that (i) a stock option expires or is terminated unexercised as to any shares of Common Stock covered thereby (except with respect to a stock option which terminates on the exercise of a stock appreciation right) or (ii) any other Award is forfeited for any reason under the Plan, any Common Stock allocated in connection such Award, shall thereafter again be available for grant pursuant to the Plan. 4. Eligibility. All Employees who have demonstrated significant management potential or who have contributed in a substantial measure to the successful performance of the Company, as determined by the Committee, are eligible to be Participants in the Plan. 5. Administration. The Plan shall be administered by the Committee. The Committee may operate through subcommittees established by it, consisting of not fewer than two members of the Committee. As to the selection of, and Awards to, Participants who are not Executive Officers, the Committee may delegate any or all of its responsibilities to officers or employees of the Company. Subject to the provisions of the Plan, the Committee shall be authorized to interpret the Plan, to establish, amend, and rescind any rules and regulations relating to the Plan, to determine the terms and provisions of any agreements entered into hereunder, and to make all other determinations necessary or advisable for the administration of the Plan.. The Committee may correct any defect, supply any omission or reconcile any inconsistency in the Plan or in any Award in the manner and to the extent it shall deem desirable to carry the Plan or any such Award into effect. The determinations of the Committee in the administration of the Plan, as described herein, shall be final and conclusive. The validity, construction and effect of the Plan and any rules and regulations relating to the Plan shall be determined in accordance with the laws of the State of New York and applicable Federal law. 6. Stock Options. Any stock options granted under the Plan shall be in such form as the Committee may from time to time approve and shall be subject to the terms and conditions provided herein and such additional terms and conditions not inconsistent with the terms of the Plan, as the Committee shall deem desirable. Stock options may be granted to any Participant. In the case of incentive stock options, the terms and conditions of such grants shall be subject to and comply with such requirements as may be prescribed by Section 422 (b) of the Code, as from time to time amended, and any implementing regulations, including, but not limited to, the 3
requirement that such stock options are exercisable during the Participant's lifetime, only by such Participant. The Committee shall establish the option price at the time each stock option is granted, which price in the case of an incentive stock option or a non-qualified stock option shall not be less than 100% of the Fair Market Value of the Common Stock on the date of grant, except the option price of a nonqualified stock option awarded in connection with or as a part of Other Stock-based Awards shall not be less than 50% of the Fair Market Value of the Common Stock on the date of grant. Stock options may not be exercisable later than 10 years after their date of grant, except that the termination provisions of a nonqualified stock option may provide for exercise after termination beyond 10 years. The option price of each share of Common Stock as to which a stock option is exercised shall be paid in full at the time of such exercise. Such payment may be made at the sole discretion of the Committee, pursuant to and in accordance with criteria and guidelines established by the Committee (which criteria and guidelines may be different for Executive Officers and for other Participants), as the same may be modified from time to time, (i) in cash, (ii) by tender of shares of Common Stock already owned by the Participant, valued at Fair Market Value as of the date of exercise, (iii) if authorized by the Committee, by withholding pursuant to the election of the Participant, which election is subject to the disapproval of the Committee, from those shares that would otherwise be obtained upon exercise of the option a number of shares having a Fair Market Value equal to the option price, (iv) if authorized by the Committee, and in combination with services rendered by the exercising Participant, by delivery of a properly executed exercise notice together with irrevocable instructions to a securities broker (or, in the case of pledges, lender) approved by the Company to, (a) sell shares of Common Stock subject to the option and to deliver promptly to the Company a portion of the proceeds of such sale transaction on behalf of the exercising Participant to pay the option price, or (b) pledge shares of Common Stock subject to the option to a margin account maintained with a broker or lender, as security for a loan, and such broker or lender, pursuant to irrevocable instructions, delivers to the Company the loan proceeds, at the time of exercise to pay the option price, or (v) by any combination of (i), (ii), (iii) or (iv) above. 7. Stock Appreciation Rights. Stock appreciation rights may be granted independent of any stock option or in conjunction with all or any part of any stock option granted under the Plan, either at the same time as the stock option is granted or at any later time during the term of the option. Stock appreciation rights shall be subject to such terms and conditions as determined by the Committee, not inconsistent with the provisions of the Plan. No stock appreciation right shall be exercisable earlier than six months after grant, except in the event of the death or Total Disability of the Participant prior to the expiration of such six-month period. Upon exercise, a stock appreciation right shall entitle the Participant to receive from CBC an amount equal to the positive difference between the Fair Market Value of a share of Common Stock on the exercise of the stock appreciation right and the per share grant or option price, as applicable (or some lesser amount as the Committee may determine at the time of grant) multiplied by the number 4
of shares of Common Stock with respect to which the stock appreciation right is exercised. A stock appreciation right or applicable portion thereof shall terminate and no longer be exercisable upon the termination or exercise of any related stock option, except that a stock appreciation right granted with respect to less than the full number of shares covered by a related stock option shall not be reduced until the exercise or termination of the related stock option exceeds the number of shares not covered by the stock appreciation right. The Committee shall determine whether the stock appreciation right shall be settled in cash, Common Stock or a combination of cash and Common Stock. 8. Other Stock-Based Awards. Other Awards of Common Stock and Awards that are valued in whole or in part by reference to, or otherwise based on the Fair Market Value of Common Stock (all such Awards being referred to herein as "Other Stock-based Awards"), may be granted under the Plan in the discretion of the Committee. Other Stock-based Awards shall be in such form as the Committee shall determine, including without limitation, (i) the right to purchase shares of Common Stock, (ii) shares of Common Stock subject to restrictions on transfer until the completion of a specified period of service, the occurrence of an event or the attainment of performance objectives, each as specified by the Committee, and (iii) shares of Common Stock issuable upon the completion of a specified period of service, the occurrence of an event or the attainment of performance objectives, each as specified by the Committee. Other Stock-based Awards may be granted alone or in addition to any other Awards made under the Plan. Subject to the provisions of the Plan, the Committee shall have sole and absolute discretion to determine to whom and when such Other Stock based Awards will be made, the number of shares of Common Stock to be awarded under (or otherwise related to) such Other Stock-based Awards and all other terms and conditions of such Awards. The Committee shall determine whether Other Stock-based Awards shall be settled in cash, Common Stock or a combination of cash and Common Stock. 9. Dividends, Equivalents and Voting Rights. Awards, other than stock options, may provide the Participant with dividends or dividend equivalents and voting rights prior to either vesting or earnout. 10. Award Agreements. Each Award under the Plan shall be evidenced by an agreement setting forth the terms and conditions, not inconsistent with the provisions of the Plan, as determined by the Committee, which shall apply to such Award. 11. Withholding. The Company shall have the right to deduct from all amounts paid to any Participant in cash (whether under this Plan or otherwise) any taxes required by law to be withheld therefrom. In the case of payments of Awards in the form of Common Stock, at the Committee's discretion the Participant may be required to pay to the Company the amount of any taxes required to be withheld with respect to such Common Stock, or, in lieu thereof, the Company shall have the right to retain the number of shares of Common Stock the Fair Market Value of which equals the amount required to be withheld. Without limiting the foregoing, the Committee may, in its discretion and subject to such conditions as it shall impose, permit share withholding to be done at the Participant's election. 5
12. Nontransferability. No Award shall be assignable or transferable, and- no right or interest of any Participant in any Award shall be subject to any lien, obligation or liability of the Participant, except by will, the laws of descent and distribution, or as otherwise set forth in the Award agreement. 13. No Right to Employment or Continued Participation in Plan. No person shall have any claim or right to the grant of an Award, and the grant of an Award shall not be construed as giving a Participant the right to be retained in the employ of the Company or to be eligible for any subsequent Awards. Further, the Company expressly reserves the right at any time to dismiss a Participant free from any liability, or any claim under the Plan, except as provided herein or in any agreement entered into hereunder. 14. Adjustment of and Changes in Common Stock. in the event of any change in the outstanding shares of Common Stock by reason of any Common Stock dividend or split, recapitalization, merger, consolidation, spin-off, combination or exchange of shares or other corporate exchange, or any distributions to shareholders of Common Stock other than regular cash dividends, the Committee may make such substitution or adjustment, if any, as it deems to be equitable, as to the number or kind of shares of Common Stock or other securities issued or reserved for issuance pursuant to the Plan, and to outstanding Awards. 15. Amendment. The Board may amend, suspend or terminate the Plan or any portion hereof at any time, provided that no amendment shall be made without stockholder approval which shall (i) increase (except as provided in Section 14 hereof) the total number of shares or the percentage of shares reserved for issuance pursuant to the Plan; (ii) change the class of Employee eligible to be Participants; (iii) decrease the minimum option price stated in Section 6 hereof (other than to change the manner of determining Fair Market Value to conform to any then applicable provision of the Code and regulations thereunder); or (iv) extend the date after which Awards cannot be granted under the Plan. 16. Unfunded Status of Plan. The Plan is intended to constitute an "unfunded" plan for long-term incentive compensation. With respect to any payments not yet made to a Participant, including any Participant optionee, by CBC, nothing herein contained shall give any Participant any rights that are greater than those of a general creditor of CBC. In its sole discretion, the Committee may authorize the creation of trusts or other arrangements to meet the obligations created under the Plan to deliver Common Stock or payments in lieu thereof or with respect to options, stock appreciation rights and other Awards under the Plan; provided, however, that the existence of such trusts or other arrangements is consistent with the unfunded status of the Plan. 17. Effective Date. Subject to shareholder approval of Sections 3 and 17 hereof, this Amended and Restated Plan shall be effective on May 19, 1992. No Awards may be granted under the Plan after May 19, 1997. 6
Exhibit 10.9 STOCK OPTION AWARD FOR DENNIS WEATHERSTONE J.P. MORGAN & CO. INCORPORATED STOCK OPTION AWARD 1. J.P. Morgan & Co. Incorporated (the "Company") on January 16, 1995 has granted and hereby evidences the grant to Dennis Weatherstone (the "Optionee"), subject to the terms and conditions set forth herein, a non-qualified stock option (the "Option") to purchase from the Company 150,000 shares of Common Stock of the Company at a per share price of $60.50. Fifty percent of the Option shall be exercisable beginning January 16, 1996 and one hundred percent of the Option shall be exercisable beginning January 16, 1997. Upon exercise of the Option, in whole or in part, the Company shall cause a certificate for shares of Common Stock to be issued to the Optionee. 2. Subject to the terms and conditions hereof, the Option shall be exercisable at the times set forth in paragraph 1. Shares may be purchased until the Option shall expire or be canceled or surrendered, by giving the Company written notice of exercise specifying the number of shares to be purchased, which number may not be less than five shares. The notice of exercise shall be accompanied by tender to the Company of the full purchase price of said shares and the related amount of income taxes required to be withheld by the Company, if applicable. Payment of the purchase price of said shares shall be made in cash, shares of Common Stock, a combination of cash and such shares, or any additional method of payment acceptable to the Company's Committee on Management Development and Executive Compensation or any successor thereto (the "Committee"). The preceding sentence notwithstanding, the Committee may, in its sole discretion, prohibit or limit the use of shares of Common Stock as part or full payment of the purchase price. Any such shares delivered as part or full payment of the purchase price shall be valued on the date of exercise at their fair market value determined in accordance with procedures established by the Committee. 3. Without limiting the generality of paragraph 1 or 2 hereof, the Option is subject to the following conditions: (a) the Option shall not in any event be exercisable after the close of business on January 14, 2005; (b) the Option shall not be transferred except by will or the laws of descent and distribution or, during the lifetime of the Optionee, to one or more members of the Optionee's immediate family, to a partnership of which the only partners are members of the Optionee's immediate family, or to a trust established by the Optionee for the benefit of one or more members of the Optionee's immediate family ("immediate family" meaning the Optionee's spouse, parents, children, grandchildren and the spouses of such parents, children and grandchildren); (c) upon the death of the Optionee prior to January 15, 2005, the person or persons to whom the Optionee's Page 1
rights under the Option are transferred in accordance with subparagraph (b) hereof, may, on or prior to January 14, 2005, purchase any or all of the shares remaining subject to the Option at the time of such death at or after the time the Optionee would have been entitled to purchase such shares had the Optionee survived; (d) upon a "Change in Control" (which term shall have the same definition as that in Section 9.1 of the 1992 Stock Incentive Plan of J.P. Morgan & Co. Incorporated and Affiliated Companies), the Option shall, unless the Committee determines otherwise, immediately become exercisable in full; and (e) prior to the occurrence of a Change in Control, but not thereafter, the Committee may, in its sole discretion and with or without cause, cancel the Option in whole or in part to the extent it has not theretofore been exercised. 4. In the event the Committee shall determine that any stock dividend, extraordinary cash dividend, recapitalization, reorganization, merger, consolidation, split-up, spin-off, combination, exchange of shares, warrants or rights offering to purchase Common Stock at a price substantially below fair market value, or other similar corporate event has affected the Common Stock of the Company, such adjustment may be made in the number and option price of the shares subject to the Option as may be determined to be appropriate by the Committee in its sole discretion. 5. Any notice given hereunder to the Company shall be addressed to the Company in the manner specified in the notice of exercise provided by the Committee, and any notice given hereunder to the Optionee shall be addressed to him at his address as shown on the records of the Company. 6. The Optionee shall be bound by the terms and conditions hereof. - -----END PRIVACY-ENHANCED MESSAGE----- Page 2
Exhibit 10.10 As amended December 14, 1994 1992 Stock Incentive Plan of J. P. Morgan & Co. Incorporated and Affiliated Companies ARTICLE I PURPOSE The purpose of the 1992 Stock Incentive Plan (the "Plan") is to promote the success of J. P. Morgan & Co. Incorporated (the "Company") by providing a method whereby eligible employees of the Company and its affiliated companies may be awarded additional remuneration for services rendered and encouraged to invest in the Common Stock of the Company, thereby increasing their proprietary interest in the Company's business, encouraging them to remain in the employ of the Company or its affiliated companies, and increasing their personal interest in the continued success and progress of the Company. ARTICLE II DEFINITIONS 2.1. The following terms shall have the meaning described below when used in the Plan: (a) "Award" shall refer to a Restricted Stock Award granted under Article VII or a Stock Unit Award granted under Article VIII. (b) "Board of Directors" shall mean the Board of Directors of the Company. (c) "Code" shall mean the Internal Revenue Code of 1986, as it may be amended from time to time. (d) "Committee" shall mean the committee appointed by the Board of Directors to administer the Plan pursuant to Article III except that with respect to the determinations to be made under Sections 6.1, 6.5, 6.8, 7.1, page 1
7.2(c), 7.4, 8.1, 8.2, 9.1 and 9.6 with respect to an eligible employee who is a member of the Board of Directors, Committee shall mean all directors of the Company who are not employees of the Company or any other Participating Company and who are disinterested within the meaning of Rule 16b-3 under the Exchange Act and are outside directors under Section 162(m)(4)(C) of the Code. (e) "Common Stock" shall mean common stock, par value $2.50, of the Company. (f) "Company" shall mean J. P. Morgan & Co. Incorporated or any successor to it in ownership of all or substantially all of its assets. (g) "Earlier Plans" shall mean the Company's 1989 Stock Incentive Plan, 1987 Stock Incentive Plan, Stock Option Plan (1984) and Stock Option Plan (1984). (h) "Exchange Act" shall mean the Securities Exchange Act of 1934, as amended from time to time. (i) "Incentive Stock Option" shall mean a stock option granted under Article VI which is intended to meet the requirements of Section 422 of the Code. (j) "Nonqualified Stock Option" shall mean a stock option granted under Article VI which is not intended to be an Incentive Stock Option. (k) "Option" shall mean an Incentive Stock Option or a Nonqualified Stock Option, including for purposes of Section 6.5 any stock option granted under the Earlier Plans. (l) "Participant" shall mean an eligible employee who has been granted a Restricted Stock Award. (m) "Participating Company" shall mean the Company, the Trust Company or any subsidiary or other affiliated entity (whether or not incorporated). (n) "Restricted Stock Award" shall mean an award of share credits under Article VII hereof. (o) "Stock Appreciation Right" shall mean a right granted under Section 6.5. (p) "Stock Unit Award" shall mean an award granted under Article VIII. (q) "Trust Company" shall mean Morgan Guaranty Trust Company of New York or any successor to it in ownership of all or substantially all of its assets. (r) "Vesting Date" shall mean the fifth anniversary of the date a Restricted Stock Award was granted or such other time or times the Committee shall designate in respect of a Restricted Stock Award at the time of the grant of such Award. If more than one Vesting Date is designated for an Award, reference in the Plan to Vesting Date in respect of such Award shall be deemed to refer to each part of such Award and the Vesting Date for such part. page 2
ARTICLE III ADMINISTRATION 3.1. (a) The Board of Directors of the Company shall appoint not less than three Directors to the Committee which shall administer the Plan. No individual shall become a member of the Committee unless such individual is disinterested within the meaning of Rule 16b-3 under the Exchange Act. The Committee shall have full power and authority, subject to such orders or resolutions not inconsistent with the provisions of the Plan as may from time to time be issued or adopted by the Board of Directors, to grant to eligible persons Options and Stock Appreciation Rights under Article VI of the Plan, to grant Restricted Stock Awards under Article VII of the Plan, to grant Stock Unit Awards under Article VIII of the Plan, to interpret the provisions of the Plan and any agreements relating to Options or Awards granted under the Plan, to supervise the administration of the Plan and to delegate to senior officers of the Company or the Trust Company the power to act for the Committee as the Committee shall specify. (b) All decisions made by the Committee (or such persons acting under a delegation by the Committee pursuant to Section 3.1(a)) pursuant to the provisions of the Plan and related orders of the Board of Directors shall be within the absolute discretion of the Committee or its delegate, as the case may be, and shall be conclusive and binding on all persons, including the Company, stockholders, employees and beneficiaries of employees. ARTICLE IV SHARES SUBJECT TO THE PLAN 4.1. (a) Subject to adjustment pursuant to Section 4.1(c), the maximum number of shares of Common Stock with respect to which Options, Stock Appreciation Rights and Awards may be granted shall be 14,000,000 shares of Common Stock. Shares of Common Stock may be made available from the authorized but unissued shares of the Company or from shares reacquired by the Company, including shares purchased in the open market. If an Option, Restricted Stock Award or Stock Unit Award granted under the Plan shall expire or terminate for any reason other than the exercise of a Stock Appreciation Right, the shares subject to such Option or Award shall be available for other Options and Awards to the same employee or other employees. (b) Subject to adjustment pursuant to Section 4.1(c), of the total shares of Common Stock referred to in Section 4.1(a), the number of shares of Common Stock with respect to which Awards may be granted shall not exceed 2,800,000 shares of Common Stock. (c) In the event that the Committee shall determine that any stock dividend, extraordinary cash dividend, recapitalization, reorganization, merger, consolidation, split-up, spin-off, combination, exchange of page 3
shares, warrants or rights offering to purchase Common Stock at a price substantially below fair market value, or other similar corporate event affects the Common Stock such that an adjustment is required in order to preserve the benefits or potential benefits intended to be made available under this Plan, then the Committee shall, in its sole discretion, and in such manner as the Committee may deem equitable, adjust any or all of (1) the number and kind of shares which thereafter may be awarded or optioned and sold or made the subject of Stock Appreciation Rights under the Plan, (2) the number and kind of shares subject to outstanding Options and Awards, and Stock Appreciation Rights, and (3) the option price with respect to any of the foregoing and/or, if deemed appropriate, make provision for a cash payment to a Participant or a person who has an outstanding option provided, however, that the number of shares subject to any Option or Award shall always be a whole number. ARTICLE V ELIGIBILITY 5.1. The employees eligible to participate in the Plan and receive Options, Stock Appreciation Rights and Awards under the Plan shall consist of key employees of the Company and other Participating Companies. ARTICLE VI STOCK OPTIONS 6.1. Subject to the limitations of the Plan, the Committee shall, after such consultation with and consideration of the recommendations of management as the Committee considers desirable, select from eligible employees those to be granted Options and determine the time when each Option shall be granted and the number of shares subject to each Option and shall select the optionees to receive Stock Appreciation Rights and the Options to which such rights shall relate. Options may be either Incentive Stock Options or Nonqualified Stock Options and more than one Option may be granted to the same person. 6.2. Option Agreements. Each Option under the Plan shall be evidenced by an option agreement which shall contain such provisions as may be approved by the Committee. Any such option agreement may be supplemented and amended from time to time as approved by the Committee provided that the terms of such option agreement after being amended or supplemented conform to the terms of the Plan. 6.3. Option Price. The price at which shares may be purchased upon exercise of a particular Option shall be not less than 100% of the fair market value of such shares on the date such Option is granted, as determined in accordance with procedures to be established by the Committee. 6.4. Exercise of Options. (a) Subject to the provisions of the Plan with respect to death, retirement and termination of employment, the period during which each page 4
Option may be exercised shall be fixed by the Committee at the time such Option is granted, but such period in no event shall expire later than ten years from the date the Option is granted. (b) Except as permitted by Sections 6.7 and 9.1, each Option may be exercised only after one year of continued employment by the Company or any of its affiliated companies and only during the continuance of the optionee's employment with the Company or any of its affiliated companies. Subject to the foregoing limitations and the terms and conditions of the option agreement and unless cancelled prior to exercise, each Option shall be exercisable in whole or in part in installments at such time or times as the Committee may prescribe and specify in the applicable option agreement. (c) No shares shall be delivered pursuant to any exercise of an Option until payment in full of the option price therefor is received by the Company. Such payment shall be made in cash or, unless prohibited by the Committee, through the delivery of shares of Common Stock of the Company with a value equal to the total option price or a combination of cash and shares. In addition, the Committee may prescribe additional methods of payment to the extent permitted by applicable law. Any shares so delivered shall be valued at their fair market value on the exercise date determined as provided in Section 6.3. No optionee or legal representative, legatee or distributee of any optionee shall be deemed to be a holder of any shares subject to any Option prior to the issuance of such shares upon exercise of such Option or any related Stock Appreciation Right. 6.5. Stock Appreciation Rights. (a) Stock Appreciation Rights may be granted to such optionees holding Options granted under the Plan or the Earlier Plans as the Committee may select and upon such terms and conditions as the Committee may prescribe. Each Stock Appreciation Right shall relate to a specific Option granted and may be granted concurrently with the Option to which it relates or at any time prior to the exercise, expiration or termination of such Option. A Stock Appreciation Right shall entitle the optionee, subject to the provisions of the Plan and the related option agreement, to receive from the Company an amount not more than the excess of the fair market value on the exercise date of the number of shares for which the Stock Appreciation Right is exercised over the option price for such shares under the related Option. For this purpose, such fair market value shall be determined as provided in Section 6.3. (b) A Stock Appreciation Right shall be exercisable on such dates or during such periods as may be determined by the Committee from time to time, provided that the Committee may, for administrative convenience, determine that, for any Stock Appreciation Right relating to a Nonqualified Stock Option which right can only be exercised during a limited period of time in order to satisfy rules imposed by the Securities and Exchange Commission, the exercise of any such right for cash during such limited period shall be deemed to occur for all purposes hereunder on the day during such limited period on which the fair market value of the Common Stock, determined as provided in page 5
Section 6.3, is the highest, and provided, further, that no Stock Appreciation Right shall be exercisable at a time when the related Option could not be exercised nor may it be exercised with respect to a number of shares in excess of the number for which such Option could then be exercised. Any such determination by the Committee may be changed by the Committee from time to time and may govern the exercise of Stock Appreciation Rights granted prior to such determination as well as Stock Appreciation Rights thereafter granted. (c) A Stock Appreciation Right may be exercised only upon surrender of the related Option by the optionee, which shall be terminated to the extent of the number of shares for which the Stock Appreciation Right is exercised. Shares covered by such a terminated Option or portion thereof granted under the Plan shall not be available for other Options or Awards under the Plan. (d) The amount payable by the Company upon exercise of a Stock Appreciation Right may be paid in cash, in shares (valued at their fair market value on the exercise date determined as provided in Section 6.3) or in any combination thereof as the Committee shall determine from time to time. No fractional shares shall be issued and the optionee shall receive cash in lieu thereof. (e) The Committee may impose any other conditions upon the exercise of a Stock Appreciation Right, which conditions may include a condition that the Stock Appreciation Right may be exercised only in accordance with rules and regulations adopted by the Committee from time to time. Such rules and regulations may govern the right to exercise Stock Appreciation Rights granted prior to the adoption or amendment of such rules and regulations as well as Stock Appreciation Rights granted thereafter. (f) The Committee may at any time amend or suspend any Stock Appreciation Right theretofore granted under the Plan, provided that the terms of any Stock Appreciation Right after any amendment shall conform to the provisions of the Plan. A Stock Appreciation Right shall terminate upon the termination or expiration of the related Option. 6.6. Transferability of Options and Stock Appreciation Rights. (a) Except as provided in subsection (b) below, an Option granted under the Plan may not be transferred except by will or the laws of descent and distribution and, during the lifetime of the person to whom granted, may be exercised only by such person. A Stock Appreciation Right may not be transferred to anyone and may be exercised only by the optionee to whom it was granted. (b) Notwithstanding subsection (a) above the Committee may determine at the time of grant or thereafter, that an Option granted under the Plan may be transferred by the optionee to one or more members of the optionee's immediate family, to a partnership of which the only partners are members of the optionee's immediate family, or to a trust established by the optionee for the benefit of one or more members of the optionee's immediate family. For this purpose immediate family means the optionee's spouse, page 6
parents, children, grandchildren and the spouses of such parents, children and grandchildren. A transferee described in this subsection may not further transfer an Option except by will or the laws of descent and distribution. An Option transferred pursuant to this subsection shall remain subject to the provisions of the Plan, including, but not limited to, the provisions of Section 6.7 relating to the exercise of the Option upon the death, retirement or termination of employment of the optionee. 6.7. Death, Retirement and Termination of Employment. Subject to the condition that no Option may be exercised in whole or in part after the expiration of the option period specified in the applicable option agreement and subject to the Committee's right to cancel any Option in accordance with Section 9.6: (a) Upon termination of employment prior to an optionee's attainment of age 55 but after the optionee is eligible for retirement pursuant to a retirement plan of the Company or any of its subsidiaries, an optionee may, within three years after the date of such termination, purchase any or all of the shares subject to an Option granted at least one year prior to such termination of employment at or after the time or times specified in the applicable option agreement (determined without regard to such termination of employment); (b) Upon termination of employment on or after attainment of age 55 and after the optionee is eligible for retirement pursuant to a retirement plan of the Company or any of its subsidiaries, an optionee may, at any time prior to the expiration of the option period specified in the applicable option agreement, purchase any or all of the shares subject to an Option granted at least one year prior to such termination of employment at or after the time or times specified in the applicable option agreement (determined without regard to such termination of employment); and (c) (i) Upon the death of an optionee while employed or after a termination of employment described in clause (b) above, the person or persons to whom such optionee's rights under the Option are transferred by will or the law of descent and distribution may, at any time during the period commencing one year from the date of grant of such Option and ending on the expiration of the option period specified in the applicable option agreement, purchase any or all of the shares remaining subject to the Option at the time of such death at or after the time the optionee would have been entitled to purchase such shares had the optionee survived; and (ii) Upon the death of an optionee after a termination of employment described in clause (a) above, the person or persons to whom such optionee's rights under the Option are transferred by will or the law of descent and distribution may, at any time prior to the expiration of the three year period specified in clause (a), purchase any or all of the shares remaining subject to such Option at or after the time the optionee would have been entitled to purchase such shares had the optionee survived; and page 7
(d) Upon termination of employment for any reason other than death or retirement as aforesaid, an optionee's Options shall be cancelled to the extent not theretofore exercised. 6.8. Waiver of Limitations. Notwithstanding anything to the contrary in the Plan, in such circumstances as the Committee may deem advisable, the Committee may waive or otherwise remove, in whole or in part, any restrictions or limitations applicable to an Option granted to an eligible employee (including, without limitation, any restriction or limitation on the period during which such Option may be exercised following termination of such eligible employee's employment and any restriction or limitation on the exercisability of such Option) who, at the time of such waiver or removal, is not subject to Section 16 of the Exchange Act. ARTICLE VII RESTRICTED STOCK AWARDS 7.1. Subject to the limitations of the Plan, the Committee shall, after such consultation with and consideration of the recommendations of management as the Committee considers desirable, select from eligible employees those Participants to be granted Restricted Stock Awards and determine the time when each Award shall be granted, the Vesting Date or Vesting Dates for each Award, the time or times as of which vested Awards shall be paid and the number of share credits (each of which shall be equivalent to one share of Common Stock) subject to each Award. 7.2. Vesting of Restricted Stock Awards. (a) Subject to the rules of Sections 7.2(b), 7.2(c) and 9.1 each Award shall fully vest and be 100% nonforfeitable on the Vesting Date. (b) Subject to the rules of Section 9.1, upon termination of a Participant's employment prior to the Vesting Date for any reason except for retirement, as described below, or death, his Awards shall be forfeited and the Participant shall have no right with respect to such Awards. Upon termination of employment prior to the Vesting Date by reason of the Participant's retirement under a retirement plan maintained by the Company or a subsidiary or by reason of death, an Award granted to such Participant shall be vested and nonforfeitable to the extent of 20% (or such other percentage as the Committee shall have determined at the time of grant of such Award) for each complete twelve month period from the date of the granting of such Award to the date of such retirement or death. (c) Notwithstanding the provisions of Sections 7.2(a) and 7.2(b), upon termination of a Participant's employment prior to 100% vesting under the rules of Sections 7.2(a) and 7.2(b), the Committee may, in its sole discretion, determine that Awards granted to such Participant shall be vested to the extent determined by the Committee but in no event less than the vesting computed under the rules of Section 7.2(b). page 8
7.3. Payment of Awards. (a)(i) Subject to the provisions of subparagraph (ii) below, as soon as practicable after an Award has become vested in accordance with Section 7.2, such vested Award shall be paid to the Participant or, in the case of the death of the Participant, his designated beneficiary or beneficiaries or, in the absence of a designated beneficiary, to the estate of the Participant. (ii) The Committee may, in its discretion, provide that payment of vested Awards be deferred until such time or times as the Committee shall specify at the time of grant of such Award or thereafter, or such time or times as the Participant may elect. Any election of a Participant pursuant to the preceding sentence shall be filed with the Committee in accordance with such rules and regulations, including any deadline for the making of such an election, as the Committee may provide. (b)(i) Except as may be otherwise determined by the Committee at the time of grant of an Award or thereafter, in addition to the payment provided for in Section 7.3(a), each Participant (or beneficiary) entitled to payment under Section 7.3(a) shall receive the dividend equivalent amount calculated under subparagraph (ii) below. (ii) The dividend equivalent amount is the number of additional share credits attributable to the number of share credits awarded plus additional share credits calculated hereunder. Such additional share credits shall be determined and credited as of the end of each calendar year by dividing (A) the aggregate cash dividends which would have been paid had the share credits awarded or credited under this subparagraph (ii), as the case may be, been actual shares of Common Stock on the record date for each such dividend during such calendar year by (B) the average market prices per shares of Common Stock on the last trading day of each calendar month during the 12 months ending on the November 30 preceding the date such determination is being made. For this purpose, the market price on any day shall be the average of the highest and lowest price of a share of Stock as reported on the composite tape for such day, unless the Committee determines that another procedure for determining market price would be more appropriate. (iii) In such cases as the Committee may deem advisable, the Committee may, in lieu of the crediting provided for in subparagraph (ii), determine to pay all or part of the dividend equivalent amount in cash as dividends are actually paid on Common Stock, or at such other time or times as the Committee may otherwise determine. (c) Payments pursuant to Section 7.3(a) and 7.3(b) shall be made in shares of Common Stock except there may be paid in cash dividend equivalents or that part of the total payment determined by the Company to be necessary to satisfy tax withholding. 7.4. Waiver of Restrictions. In such circumstances as the Committee may deem advisable, the Committee may waive or otherwise remove, in whole or in page 9
part, any restrictions or limitations to which a Restricted Stock Award was made subject at the time of grant. ARTICLE VIII STOCK UNIT AWARDS 8.1. In addition to granting Options, Stock Appreciation Rights and Restricted Stock Awards, the Committee shall have authority to grant to eligible employees Stock Unit Awards which can be in the form of Common Stock or units, the value of which is based, in whole or in part, on the value of Common Stock. Subject to the provisions of the Plan, including Section 8.2 below, Stock Unit Awards shall be subject to such terms, restrictions, conditions, vesting requirements and payment rules (all of which are sometimes hereinafter collectively referred to as "rules") as the Committee may determine in its sole discretion, all such rules applicable to a particular Stock Unit Award to be reflected in writing and furnished to the employee at the time of grant. The rules need not be identical for each Stock Unit Award. 8.2. Rules. In the sole discretion of the Committee, a Stock Unit Award shall be granted subject to the following rules: (a) Any shares of Common Stock which are part of a Stock Unit Award may not be assigned, sold, transferred, pledged or otherwise encumbered prior to the date on which the shares are issued or, if later, the date provided by the Committee at the time of the Award. (b) Stock Unit Awards may provide for the payment of cash consideration by the person to whom such Award is granted or provide that the Award, and Common Stock to be issued in connection therewith, if applicable, shall be delivered without the payment of cash consideration. (c) Stock Unit Awards may relate in whole or in part to certain performance criteria established by the Committee at the time of grant. (d) Stock Unit Awards may provide for deferred payment schedules, vesting over a specified period of employment, the payment (on a current or deferred basis) of dividend equivalent amounts, with respect to the number of shares of Common Stock covered by the Award, and elections by the employee to defer payment of the Award or the lifting of restrictions on the Award, if any. (e) In such circumstances as the Committee may deem advisable, the Committee may waive or otherwise remove, in whole or in part, any restrictions or limitations to which a Stock Unit Award was made subject at the time of grant. ARTICLE I GENERAL PROVISIONS page 10
9.1. Change in Control. (a)(i) In the case of a Change in Control (as defined below) of the Company, each Option then outstanding shall (unless the Committee determines otherwise) immediately become exercisable in full; (ii) In the case of a Change in Control (as defined below) of the Company, each Award shall (unless the Committee determines otherwise) immediately be fully vested and nonforfeitable and shall thereupon be paid as soon as practicable. (b) Any determination by the Committee made pursuant to this Section 9.1 may be made as to all outstanding Options or Awards or only as to certain Options or Awards specified by the Committee and all such determinations shall be made in cases covered by subparagraphs (i) or (ii) below, prior to or as soon as practicable after the occurrence of such event and in the cases covered by subparagraphs (iii) and (iv) below, prior to the occurrence of such event. (c) A Change in Control shall occur if: (i) any "person" or "group of persons" as such terms are used in Section 13(d) and 14(d) of the Exchange Act directly or indirectly purchases or otherwise becomes the "beneficial owner" (as defined in Rule d-3 under the Exchange Act) or has the right to acquire such beneficial ownership (whether or not such right is exercisable immediately, with the passage of time, or subject to any condition), of voting securities representing 25% or more of the combined voting power of all outstanding voting securities of the Company; (ii) during any period of two consecutive years, the individuals who at the beginning of such period constitute the Board of Directors cease for any reason to constitute at least a majority of the members thereof, unless (1) there are seven or more directors then still in office who were directors at the beginning of the period, and (2) the election, or the nomination for election by the Company's stockholders, of each new director was approved by at least two-thirds of the directors then still in office who were directors at the beginning of the period; (iii) the stockholders of the Company shall approve an agreement to merge or consolidate the Company with or into another corporation as a result of which less than 50% of the outstanding voting securities of the surviving or resulting entity are or are to be owned by the former shareholders of the Company (excluding from former shareholders, a shareholder who is or, as a result of the transaction in question, becomes an "affiliate," as defined in Rule 12b-2 under the Exchange Act, of any party to such consolidation or merger); or (iv) the stockholders of the Company shall approve the sale of all or substantially all of the Company's business and/or assets to a person or entity which is not a wholly-owned subsidiary of the Company. page 11
9.2. Designation of Beneficiary. Subject to such rules and regulations as the Committee may prescribe, including the right of the Committee to limit the types of designations which are acceptable for purposes of the Plan, each employee who shall be granted an Option or Award under the Plan may designate a beneficiary or beneficiaries and may change such designation from time to time by filing a written designation of beneficiaries with the Committee on a form to be prescribed by it, provided that no such designation shall be effective unless so filed prior to the death of such employee. 9.3. No Right of Continued Employment. Neither the establishment of the Plan, the granting of Options or Awards, nor the payment of any benefits hereunder nor any action of the Company or of the Board of Directors or of the Committee shall be held or construed to confer upon any person any legal right to be continued in the employ of the Company or its subsidiaries, each of which expressly reserves the right to discharge any employee whenever the interest of any such company in its sole discretion may so require without liability to such company, the Board of Directors or the Committee except as to any rights which may be expressly conferred upon such employee under the Plan. 9.4. No Segregation of Cash or Shares. The Company shall not be required to segregate any cash or any shares of Common Stock which may at any time be represented by Options, Awards, share credits or dividend equivalent amounts and the Plan shall constitute an "unfunded" plan of the Company. No employee shall have voting or other rights with respect to shares of Common Stock prior to the delivery of such shares. The Company shall not, by any provisions of the Plan, be deemed to be a trustee of any Common Stock or any other property, and the liabilities of the Company to any employee pursuant to the Plan shall be those of a debtor pursuant to such contract obligations as are created by or pursuant to the Plan, and the rights of any employee, former employee or beneficiary under the Plan shall be limited to those of a general creditor of the Company. In its sole discretion, the Board of Directors may authorize the creation of trusts or other arrangements to meet the obligations of the Company and each other Participating Company under the Plan, provided, however, that existence of such trusts or other arrangements is consistent with the unfunded status of the Plan. 9.5. Delivery of Shares. No shares shall be delivered pursuant to any exercise of an Option or Stock Appreciation Right or pursuant to the payment of any Award until the requirements of such laws and regulations as may be deemed by the Committee to be applicable thereto are satisfied. 9.6. Cancellation of Options, Stock Appreciation Rights and Awards. (a) Prior to the occurrence of a Change in Control, but not thereafter, the Committee may, in its sole discretion and with or without cause, cancel any Option, Stock Appreciation Right or Award in whole or in part to the extent it has not theretofore been exercised or, in the case of Awards, become vested. Such cancellation shall be effective as of the date specified by the Committee. page 12
(b) Notwithstanding subsection (a) above, prior to payment of any Award, the Committee may, in its sole discretion, in cases involving a serious breach of conduct by an employee or former employee, or activity of a former employee in competition with the business of a Participating Company, cancel any Award, whether or not vested, in whole or in part. Such cancellation shall be effective as of the date specified by the Committee. The determination of whether an employee or former employee has engaged in a serious breach of conduct or activity in competition with the business of a Participating Company shall be determined by the Committee in good faith and in its sole discretion. 9.7. Transfer, Leave of Absence, etc. For purposes of the Plan: (a) a transfer of an employee from a Participating Company to an affiliated company, (b) a leave of absence, duly authorized in writing by the Participating Company, for military service or sickness, or for any other purpose approved by the Participating Company if the period of such leave does not exceed ninety days, and (c) a leave of absence in excess of ninety days, duly authorized in writing by the Participating Company, provided the employee's right to reemployment is guaranteed either by a statute or by contract, shall not be deemed a termination of employment. 9.8. New York Law to Govern. All questions pertaining to the construction, regulation, validity and effect of the provisions of the Plan shall be determined in accordance with the laws of the State of New York. 9.9. Payments and Tax Withholding. The delivery of any shares of Common Stock and the payment of any amount in respect of a Stock Appreciation Right or Award shall be of the account of the applicable Participating Company and any such delivery or payment shall not be made until the recipient shall have made satisfactory arrangements for the payment of any applicable withholding taxes. ARTICLE X AMENDMENT AND TERMINATION 10.1. Amendments, Suspension or Discontinuance. The Board of Directors may amend, suspend or discontinue the Plan, provided, however, that except as permitted by Section 4.1(c), the Board of Directors may not, without the prior approval of the stockholders of the Company, make any amendment for which stockholder approval is necessary to comply with any applicable tax or regulatory requirement, including for these purposes any approval requirement which is a prerequisite for exemptive relief under Section 16(b) of the Exchange Act, and provided, further, that upon the occurrence of a Change in Control no amendment may adversely affect the rights of any person in connection with any Option or Award previously granted. 10.2. Termination. No Option or Award shall be granted under the Plan after expiration of three years from the date upon which the Plan is approved by vote of the stockholders of the Company. page 13
page 14
EXHIBIT 10.11 As amended December 14, 1994 J. P. MORGAN & CO. INCORPORATED STOCK OPTION PLAN (1984) SECTION 1. Purpose. The purpose of the Stock Option Plan (1984) (the "Plan") is to promote the success of J. P. Morgan & Co. Incorporated (the "Company") by providing a method whereby key employees of the Company and its subsidiaries may be encouraged to invest in the Common Stock of the Company and thereby increase their proprietary interest in its business, encourage them to remain in the employ of the Company or its subsidiaries, and increase their personal interest in the continued success and progress of the Company. SECTION 2. Administration. (a) The Board of Directors of the Company shall designate a committee of not less than three Directors (the "Committee"). No individual shall become a member of the Committee if he shall have been eligible to receive options to acquire shares of capital stock of the Company or any subsidiary, or stock appreciation rights, at any time during the 12-month period prior to his becoming a member and no member of the Committee shall be eligible to receive options or stock appreciation rights. The Committee shall have full power and authority, subject to such orders or resolutions not inconsistent with the provisions of the Plan as may from time to time be issued or adopted by the Board of Directors, to grant to eligible persons options to purchase shares of the Company and stock appreciation rights pursuant to the provisions of the Plan, to interpret the provisions of the Plan and any option agreements issued under the Plan, and to supervise the administration of the Plan. (b) All decisions made by the Committee pursuant to the provisions of the Plan and related orders or resolutions of the Board of Directors shall be final, conclusive and binding on all persons, including the Company, stockholders, employees and optionees. SECTION 3. Shares Subject to the Plan. (a) The shares to be delivered upon exercise of options and stock appreciation rights granted under the Plan may be made available from the authorized but unissued shares of the Company or from shares reacquired by the Company, including shares purchased in the open market. (b) Subject to adjustments made pursuant to the
provisions of paragraph (c) of this Section 3, (i) the aggregate number of shares to be delivered upon exercise of all options which may be granted under the plan shall not exceed 1,200,000 shares of Common Stock, $2.50 par value, of the Company and (ii) the aggregate number of shares which may be delivered to any one employee upon exercise of all options granted to him under the Plan shall not exceed 50,000 shares. The aggregate fair market value (determined as of the time the option is granted) of the stock for which any employee may be granted "incentive stock options" in any calendar year under this Plan and all other stock options plans of the Company (and any subsidiary or any parent corporation within the meaning of Section 425 of the Internal Revenue Code of 1954, as amended (the "Code")) shall not exceed $100,000 plus any unused limit carryover calculated in accordance with Section 422A of the Code with respect to such employee. If an option granted under the Plan shall expire or terminate for any reason other than the exercise of a stock appreciation right, the shares subject to, but not delivered under, such option shall be available for other options to the same employee or other employees. (c) In the event of any merger, reorganization, consolidation, recapitalization, stock dividend, or other change in corporate structure affecting the Common Stock of the Company, such adjustment shall be made in the aggregate number of shares which may be delivered under the Plan, the maximum number of shares which may be delivered to any one employee under the Plan and the number and option price of shares subject to the outstanding options granted under the Plan (provided that the number of shares subject to any option shall always be a whole number) as may be determined to be appropriate by the Committee. SECTION 4. Eligibility and Extent of Participation. (a) The employees eligible to receive options under the Plan shall consist of key employees of the Company and its subsidiaries. Stock appreciation rights may be granted to holders of any unexpired options granted under this Plan or the Company's Stock Option Plan (1979) and the Company's Stock Option Plan (1974) (collectively referred to herein as the "Earlier Plans"). For the purpose of the Plan, the term "subsidiary" is a corporation 50% or more of the voting power of which is owned by the Company directly or indirectly through one or more subsidiaries. (b) Subject to the limitations of the Plan, the Committee shall, after such consultation with and consideration of the recommendations of management as the Committee considers desirable, select from eligible employees those to be granted options and determine the time when each option shall be granted and the number of shares subject to each option and shall select the optionees to receive stock appreciation rights and the options to which such rights shall relate. Subject to the provisions of paragraph (b) of Section 3, more than one option and stock
appreciation right may be granted to the same person. SECTION 5. Option Agreements. Each option under the Plan shall be evidenced by an option agreement which shall be signed by an officer of the Company and the optionee, shall contain such provisions as may be approved by the Committee and may be supplemented and amended from time to time as approved by the Committee. Each stock appreciation right shall be evidenced by the option agreement for the option to which it relates. In the case of any such right relating to a previously granted option, the option agreement shall be supplemented to evidence such right. SECTION 6. Option Price. The price at which shares may be purchased upon exercise of a particular option shall be not less than 100 per cent of the fair market value of such shares on the date such option is granted, as determined in accordance with procedures to be established by the Committee. SECTION 7. Exercise of Options. (a) Subject to the provisions of the Plan with respect to death, retirement and termination of employment, the period during which each option may be exercised shall be fixed by the Committee at the time such option is granted, but such period in no event shall expire later than ten years from the date the option is granted. (b) Each option granted under the Plan may be exercised only after one year of continued employment by the Company or any of its subsidiaries immediately following the date the option is granted and, except as provided in Section 10, only during the continuance of the optionee's employment with the Company or any of its subsidiaries. Subject to the foregoing limitations and the terms and conditions of the option agreement and unless cancelled prior to exercise in accordance with Section 13, each option shall be exercisable in whole or in part in installments at such time or times as the Committee may prescribe and specify in the applicable option agreement. (c) No shares shall be delivered pursuant to any exercise of an option until payment in full of the option price therefor is received by the Company. Such payment shall be made in cash or, in the discretion of the Committee, through the delivery of shares of Common Stock of the Company with a value equal to the total option price or a combination of cash and shares. In addition, the Committee may prescribe additional methods of payment to the extent permitted by applicable law. Any shares so delivered shall be valued at their fair market value on the exercise date determined as provided in Section 6 hereof. No optionee or the legal representative, legatee or distributee of an optionee, shall be deemed to be a holder of any shares subject to any option prior to the issuance of such shares upon exercise of such option or any related stock
appreciation right. SECTION 8. Stock Appreciation Rights. (a) Stock appreciation rights may be granted to such optionees holding options granted under this Plan or the Plans as the Committee may select and upon such terms and conditions as the Committee may prescribe. Each stock appreciation right shall relate to a specific option granted and may be granted concurrently with the option to which it relates or at any time prior to the exercise, expiration or termination of such option. A stock appreciation right shall entitle the optionee, subject to the provisions of the Plan and the related option agreement, to receive from the Company an amount equal to the excess of the fair market value on the exercise date of the number of shares for which the stock appreciation right is exercised over the option price for such shares under the related option. For this purpose, such fair market value shall be determined as provided in Section 6 hereof. (b) A stock appreciation right shall be exercisable on such dates or during such periods as may be determined by the Committee from time to time, provided that the Committee may, for administrative convenience, determine that, for any stock appreciation right relating to an option which is not an "incentive stock option" which right can only be exercised during a limited period of time in order to satisfy rules imposed by the Securities and Exchange Commission, the exercise of any such right for cash during such limited period shall be deemed to occur for all purposes hereunder on the day during such limited period on which the fair market value of the Common Stock of the Company, determined as provided in Section 6, is the highest, and provided, further, that no stock appreciation right shall be exercisable at a time when the related option could not be exercised nor may it be exercised with respect to a number of shares in excess of the number for which such option could then be exercised. Any such determination by the Committee may be changed by the Committee from time to time and may govern the exercise of stock appreciation rights granted prior to such determination as well as rights thereafter granted. (c) A stock appreciation right may be exercised only upon surrender of the related option by the optionee, which shall be terminated to the extent of the number of shares for which the stock appreciation right is exercised. Shares covered by such a terminated option or portion thereof granted under this Plan shall not be available for other options under this Plan. (d) The amount payable by the Company upon exercise of a stock appreciation right may be paid in cash, in shares (valued at their fair market value on the exercise date determined as provided in Section 6) or in any combination thereof as the Committee shall determine from time to time. No fractional shares shall be issued and the optionee shall receive cash in lieu thereof.
(e) The Committee may impose any other conditions upon the exercise of a stock appreciation right, which conditions may include a condition that the stock appreciation right may only be exercised in accordance with rules and regulations adopted by the Committee from time to time. Such rules and regulations may govern the right to exercise stock appreciation rights granted prior to the adoption or amendment of such rules and regulations as well as stock appreciation rights granted thereafter. (f) The Committee may at any time amend, terminate or suspend any stock appreciation right theretofore granted under this Plan, provided that the terms of any stock appreciation right after any amendment shall conform to the provisions of this Plan. A stock appreciation right shall terminate upon the termination or expiration of the related option. SECTION 9. Transferability of Options and Stock Appreciation Rights. (a) Except as provided in subsection (b) below, an option granted under the Plan may not be transferred except by will or the laws of descent and distribution and, during the lifetime of the person to whom granted, may be exercised only by such person. A stock appreciation right may not be transferred to anyone and may be exercised only by the optionee to whom it was granted. (b) Notwithstanding subsection (a) above, the Committee may determine, at the time of grant or thereafter, that an Option granted under the Plan may be transferred by the optionee to one or more members of the optionee's immediate family, to a partnership of which the only partners are members of the optionee's immediate family or to a trust established by the optionee for the benefit of one or more members of the optionee's immediate family. For this purpose immediate family means the optionee's spouse, parents, children, grandchildren and the spouses of such parents, children and grandchildren. A transferee described in this subsection may not further transfer an Option except by will or the laws of descent and distribution. An Option transferred pursuant to this subsection shall remain subject to the provisions of the Plan, including, but not limited to, the provisions of Section 10 relating to the exercise of the Option upon the death, retirement or termination of employment of the optionee. SECTION 10. Death, Retirement and Termination of Employment. Subject to the condition that no option may be exercised in whole or in part after the expiration of the option period specified in the applicable option agreement and subject to the Committee's right to cancel any option in accordance with Section 13: (a) Upon the death of any optionee while employed or within the three-year period referred to in clause (b) below, the person or persons to whom such optionee's rights
under the option are transferred by will or the laws of descent and distribution may, prior to three years after (i) the date of such optionee's death while employed or (ii) the termination of such optionee's employment for a reason referred to in clause (b) below, as the case may be, purchase any or all of the shares with respect to which such optionee was entitled to exercise such option immediately prior to his death; (b) Upon termination of employment as a result of retirement pursuant to a retirement plan of the Company or any of its subsidiaries, an optionee may, within three years after the date of such termination, purchase any or all of the shares with respect to which such optionee was entitled to exercise such option immediately prior to such termination; and (c) Upon termination of employment for any reason other than death or retirement as aforesaid, an optionee's options shall be cancelled to the extent not theretofore exercised. SECTION 11. Waiver of Limitations. Notwithstanding anything to the contrary in the Plan, in such circumstances as the Committee may deem advisable, the Committee may waive or otherwise remove, in whole or in part, any restrictions or limitations applicable to an Option granted to an eligible employee (including, without limitation, any restriction or limitation on the period during which such Option may be exercised following termination of such eligible employee's employment any restriction or limitation on the exercisability of such Option) who, at the time of such waiver or removal, is not subject to Section 16 of the Securities Exchange Act of 1934. SECTION 12. Delivery of Shares. No shares shall be delivered pursuant to any exercise of an option or stock appreciation right until the requirements of such laws and regulations as may be deemed by the Committee to be applicable thereto are satisfied. SECTION 13. Cancellation of Options and Stock Appreciation Rights. The Committee may, in its sole discretion, and with or without cause cancel any option or stock appreciation right in whole or in part to the extent it has not theretofore been exercised. Such cancellation shall be effective as of the date specified by the Committee. SECTION 14. Designation of Beneficiary. Subject to such rules and regulations as the Committee may prescribe, including the right of the Committee to limit the types of designations which are acceptable for purposes of the Plan, each employee who shall be granted an option under the Plan may designate a beneficiary or beneficiaries and may change such designation from time to time by filing a
written designation of beneficiaries with the Committee on a form to be prescribed by it, provided that no such designation shall be effective unless so filed prior to the death of such employee. SECTION 15. Amendments, Suspension or Discontinuance. The Board of Directors may amend, suspend, or discontinue the Plan, but except as permitted by paragraph (c) of Section 3, may not, without the prior approval of the stockholders of the Company, make any amendment which operates (a) to abolish the Committee, change the qualification of its members or withdraw the administration of the Plan from its supervision, (b) to make any material change in the class of eligible employees as defined in the Plan, (c) to increase the total number of shares which may be delivered on exercise of options granted under the Plan, (d) to increase the number of shares which may be delivered to any one optionee upon exercise of options granted under the Plan, (e) to extend the maximum option period or the period during which options may be granted under the Plan, (f) to decrease the minimum option price or (g) to increase the number of shares with respect to which stock appreciation rights granted under the Plan may be exercised or to increase the amount which may be received upon exercise of any stock appreciation right. SECTION 16. Termination. No option shall be granted under the Plan after expiration of three years from the date upon which the Plan is approved by vote of the stockholders of the Company.
Exhibit 10.12 As Amended December 11, 1996 1995 Stock Incentive Plan of J.P. Morgan & Co. Incorporated and Affiliated Companies Article I Purpose The purpose of the 1995 Stock Incentive Plan (the "Plan") is to afford an incentive to key employees of J.P. Morgan & Co. Incorporated (the "Company") and its affiliates to acquire a proprietary interest in the Company, to encourage such employees to increase their efforts on behalf of the Company and remain in its employ, and to more closely align the interests of such key employees with those of the Company's stockholders. Article II Definitions 2.1. The following terms shall have the meanings described below when used in the Plan: (a) "Award" shall refer to a Restricted Stock Award granted under Article VIII or a Stock Unit Award granted under Article IX. (b) "Board of Directors" shall mean the Board of Directors of the Company. (c) "Code" shall mean the Internal Revenue Code of 1986, as amended from time to time. (d ) "Committee" shall mean the committee appointed by the Board of Directors to administer the Plan pursuant to Article III. (e) "Common Stock" shall mean common stock, par value $2.50, of the Company. 1
(f) "Company" shall mean J.P. Morgan & Co. Incorporated or any successor to it in ownership of all or substantially all of its assets. (g) "Exchange Act" shall mean the Securities Exchange Act of 1934, as amended from time to time. (h) "Fair Market Value" of Common Stock on any day shall mean the average of the highest and lowest price of Common Stock as reported on the composite tape for such day, unless the Committee determines that another procedure for determining Fair Market Value would be more appropriate. (i) "Incentive Stock Option" shall mean a stock option granted under Article VI which is intended to meet the requirements of Section 422 of the Code. (j) "Nonqualified Stock Option" shall mean a stock option granted under Article VI which is not intended to be an Incentive Stock Option. (k) "Option" shall mean an Incentive Stock Option or a Nonqualified Stock Option. (l) "Optionee" shall mean a Participant who is granted an Option. (m) "Participant" shall mean an eligible employee who has been granted an Option, Stock Appreciation Right or Award under the Plan. (n) "Participating Company" shall mean the Company, the Trust Company or any subsidiary or other affiliated entity (whether or not incorporated). (o) "Plan" shall mean this 1995 Stock Incentive Plan of J.P. Morgan & Co. Incorporated and Affiliated Companies. (p) "Related Right" shall mean a Stock Appreciation Right described in Section 7.2. (q) "Restricted Period" shall mean the period during which a Restricted Stock Award is being earned in accordance with Section 8.3. (r) "Restricted Stock Award" shall mean an award granted under Article VIII. (s) "Stand Alone Right" shall mean a Stock Appreciation Right described in Section 7.3. (t) "Stock Appreciation Right" shall mean a right granted under Article VII. (u) "Stock Unit Award" shall mean an award granted under Article IX. 2
(v) "Trust Company" shall mean Morgan Guaranty Trust Company of New York or any successor to it in ownership of all or substantially all of its assets. Article III 3.1. (a) The Board of Directors shall appoint not less than three Directors to the Committee which shall administer the Plan. With respect to determinations regarding the grant, amount, acceleration or forfeiture of Options, Stock Appreciation Rights or awards with respect to an eligible employee who is a member of the Board of Directors, the Committee shall be composed of all directors of the Company who are not employees of the Company or any other Participating Company. No individual shall be a member of the Committee unless such individual is disinterested within the meaning of Rule 16b-3 under the Exchange Act. The Committee shall have full power and authority, subject to such orders or resolutions not inconsistent with the provisions of the Plan as may from time to time be issued or adopted by the Board of Directors, to grant to eligible persons Options, Stock Appreciation Rights and Awards under the Plan; to waive any restrictions or limitations, or impose additional limitations or restrictions, on previously granted Options, Stock Appreciation Rights, or Awards (within the parameters of the Plan); to interpret the provisions of the Plan and any agreements relating to Options, Stock Appreciation Rights or Awards granted under the Plan; to supervise the administration of the Plan and to delegate to senior officers of the Company or the Trust Company the power to act for the Committee as the Committee shall specify. (b) All decisions made by the Committee (or such persons acting under a delegation by the Committee pursuant to subsection 3.1 (a) ) pursuant to the provisions of the Plan and related orders of the Board of Directors shall be within the absolute discretion of the Committee or its delegate, as the case may be, and shall be conclusive and binding on all persons, including the Company, stockholders, employees and beneficiaries of employees. Article IV Shares Subject To The Plan 4.1. (a) Subject to adjustment pursuant to subsection 4.1 (d), the maximum number of shares of Common Stock with respect to which Options, Stock Appreciation Rights and Awards may be granted shall be 28,000,000 shares of Common Stock. Shares of Common Stock may be made available from the authorized but unissued shares of the Company or from shares reacquired by the Company, including shares purchased in the open market. If an Option, Stock Appreciation Right or Award granted under the Plan shall expire or terminate for any reason other than the exercise of a Related Right (to the extent set forth in subsection 7.2(c) ), the shares subject to such Option, Stock Appreciation Right or Award shall be 3
available for other Options, Stock Appreciation Rights and Awards to the same Participant or other eligible employees. Any shares delivered in payment of the exercise price of an Option shall be available for other Options, Stock Appreciation Rights and Awards to the same Participant or other eligible employees. (b) Subject to adjustment pursuant to subsection 4.1 (d), of the total shares of Common Stock referred to in subsection 4.1 (a), the number of shares of Common Stock with respect to which Awards may be granted shall not exceed 7,000,000 shares of Common Stock. (c) Subject to adjustment pursuant to subsection 4.1 (d), of the total shares of Common Stock referred to in subsection 4.1 (a), the number of shares of Common Stock with respect to which Options or Stock Appreciation Rights may be granted to any Participant during the term of the Plan shall not exceed 2,800,000 shares of Common Stock. (d) In the event that the Committee shall determine that any stock dividend, extraordinary cash dividend, recapitalization, reorganization, merger, consolidation, split-up, spin-off, combination, exchange of shares, warrants or rights offering to purchase Common Stock at a price substantially below fair market value, or other similar corporate event affects the Common Stock such that an adjustment is required in order to preserve the benefits or potential benefits intended to be made available under this Plan, then the Committee shall, in its sole discretion, and in such manner as the Committee may deem equitable, adjust any or all of ( 1 ) the number and kind of shares which thereafter may be awarded or optioned and sold or made the subject of Stock Appreciation Rights under the Plan, (2) the number and kind of shares subject to outstanding Options, Stock Appreciation Rights and Awards, and (3) the option price with respect to any of the foregoing and/or, if deemed appropriate, make provision for a cash payment to a Participant. The number of shares subject to any Option, Stock Appreciation Right or Award shall always be a whole number. Article V Eligibility 5.1. The employees eligible to participate in the Plan and receive Options, Stock Appreciation Rights and Awards under the Plan shall consist of key employees of the Company and other Participating Companies. 4
Article VI Stock Options 6.1. Grant of Options. Subject to the limitations of the Plan, the Committee shall, after such consultation with and consideration of the recommendations of management as the Committee considers desirable, select from eligible employees those Participants to be granted Options and determine the time when each Option shall be granted and the number of shares subject to each Option. Options may be either Incentive Stock Options or Nonqualified Stock Options and more than one Option may be granted to the same person. Options shall be evidenced in such manner as may be approved by the Committee. Options may be amended or supplemented from time to time as approved by the Committee, provided that the terms of such Options after being amended or supplemented conform to the terms of the Plan. 6.2. Option Price. The price at which shares may be purchased upon exercise of a particular Option shall be not less than 100% of the Fair Market Value of such shares on the date such Option is granted. 6.3. Medium and Time of Payment. No shares shall be delivered pursuant to any exercise of an Option until payment in full of the Option price therefor is received by the Company. Such payment shall be made in cash or, unless prohibited by the Committee, through the delivery of shares of Common Stock of the Company with a Fair Market Value equal to the total Option price or a combination of cash and shares. The Committee may prescribe additional methods of payment to the extent permitted by applicable law. Any shares so delivered shall be valued at their Fair Market Value on the exercise date, or on such other date as determined by the Committee for administrative convenience. No Optionee, transferee, legal representative, legatee or distributee of any Optionee shall be deemed to be a holder of any shares subject to any Option prior to the issuance of such shares upon exercise of such Option or any related Stock Appreciation Right. 6.4. Term and Exercisability of Options. An Option shall be exercisable ratably on each of the first three anniversaries of the date of grant of such Option or as otherwise determined by the Committee, but in no event shall such Option be exercised earlier than one year or later than ten years from the date the Option is granted. The Committee may require that an Option only be exercised upon the achievement of such performance objectives as the Committee shall designate. An Option shall be subject to earlier termination as provided in Section 6.6 with respect to death, retirement and termination of employment or as provided in Section 10.6. 6.5. Transferability of Options. (a) Except as provided in subsection (b) below, an Option may not be sold, assigned, transferred, pledged, hypothecated or otherwise disposed of, except by will or the laws of descent and distribution and, during the lifetime of the 5
Optionee, may be exercised only by such Optionee. (b) Notwithstanding subsection (a) above, the Committee may determine that an Option may be transferred by the Optionee to one or more members of the Optionee's immediate family, to a partnership of which the only partners are members of the Optionee's immediate family, or to a trust established by the Optionee for the benefit of one or more members of the Optionee's immediate family. For this purpose immediate family means the Optionee's spouse, parents, children, grandchildren and the spouses of such parents, children and grandchildren. A transferee described in this subsection may not further transfer an Option. An Option transferred pursuant to this subsection shall remain subject to the provisions of the Plan, including, but not limited to, the provisions of Section 6.6 relating to the exercise of the Option upon the death, retirement or termination of employment of the Optionee, and shall be subject to such other rules as the Committee shall determine. 6.6. Death, Retirement and Termination of Employment. Subject to the condition that no Option be exercised in whole or in part after the expiration of the Option period specified by the Committee, and subject to the Committee's right to cancel any Option in accordance with Section 10.6, unless otherwise determined by the Committee: (a) Upon termination of employment prior to an Optionee's attainment of age 55 but after the Optionee is eligible for retirement pursuant to a retirement plan of the Company or any of its subsidiaries, an Optionee or a transferee described in subsection 6.5(b), may, within three years after the date of such termination, purchase any or all of the shares subject to an Option granted at least one year prior to such termination of employment, at or after the time or times the Optionee would have been entitled to purchase such shares had the Optionee not terminated employment; (b) Upon termination of employment on or after an Optionee's attainment of age 55 and after the Optionee is eligible for retirement pursuant to a retirement plan of the Company or any of its subsidiaries, an Optionee or a transferee described in subsection 6.5(b), may, at any time prior to the expiration of the Option period, purchase any or all of the shares subject to an Option granted at least one year prior to such termination of employment, at or after the time or times the Optionee would have been entitled to purchase such shares had the Optionee not terminated employment; (c) Upon the death of an Optionee after a termination of employment described in subsections (a) or (b) above, the Optionee's designated beneficiary, or if none, the person or persons to whom such Optionee's rights under the Option are transferred by will or the laws of descent and distribution, or a transferee described in subsection 6.5(b), may, at any time prior to the expiration of the Option period determined under subsection (a) or (b), as the case may be, purchase any or all of the shares subject to an Option at or after the time the Optionee would have been entitled to purchase such shares had the Optionee survived; 6
(d) Upon the death of an Optionee while employed, the Optionee's designated beneficiary, or if none, the person or persons to whom such Optionee's rights under the Option are transferred by will or the laws of descent and distribution, or a transferee described in subsection 6.5(b), may, within three years after the date of such death, but no later than the expiration of the Option period, purchase any or all of the shares subject to an Option at or after the time the Optionee would have been entitled to purchase such shares had the Optionee survived; and (e) Upon termination of employment for any reason other than death or retirement as aforesaid, an Optionee's Options, including any Options transferred pursuant to subsection 6.5(b), shall be cancelled to the extent not theretofore exercised. In addition, the Optionee shall repay to the Company the value of the difference between the Fair Market Value on the date of exercise over the Option price of any Options exercised within the six month period preceding the date of such termination and the value of any Related Right described in Section 7.2 exercised during such period. Article VII Stock Appreciation Rights 7.1. Grant of Stock Appreciation Rights. Subject to the limitations of the Plan, the Committee shall, after such consultation with and consideration of the recommendations of management as the Committee considers desirable, select from eligible employees those Participants to be granted Stock Appreciation Rights and determine the time when each Stock Appreciation Right shall be granted and such other terms of each Stock Appreciation Right pursuant to this Article VII. Stock Appreciation Rights may be granted either alone ("Stand Alone Rights") or in conjunction with all or part of any Option granted under the Plan ( "Related Rights" ) . In the case of a Nonqualified Stock Option, Related Rights may be granted either at or after the time of the grant of the Nonqualified Stock Option. In the case of an Incentive Stock Option, Related Rights may be granted only at the time of the grant of the Incentive Stock Option. 7.2. Related Rights. (a) A Related Right shall be exercisable only at such time or times and to the extent that the Option to which it relates shall be exercisable in accordance with Article 6, provided that the Committee may, for administrative convenience, determine that, for any Related Right which can only be exercised during a limited period of time in order to satisfy rules imposed by the Securities and Exchange Commission, the exercise of any such Related Right for cash during such limited period shall be deemed to occur for all purposes hereunder on the day during such limited period on which the Fair Market Value of the Common Stock is the highest. A Related Right granted with respect to an Option shall terminate and no longer be exercisable upon the termination or exercise of the related Option, provided that, unless otherwise provided by the Committee, a Related Right granted with 7
respect to less than the full number of shares covered by a related Option shall only be reduced if and to the extent that the number of shares covered by the exercise or termination of the related Option exceeds the number of shares not covered by the Related Right, provided further that, in the event of the death of the Participant, the Related Right shall be cancelled to the extent not theretofore exercised, whether or not the related Option is cancelled. (b) Upon the exercise of a Related Right, a Participant shall be entitled to receive up to, but not more than, an amount in cash or shares of Common Stock equal in value to the excess of the Fair Market Value of one share of Common Stock over the Option price per share of Common Stock of the related Option multiplied by the number of shares of Common Stock in respect of which the Related Right shall have been exercised. The Committee shall have the right to determine the form of payment. Any shares delivered in payment shall be valued at their Fair Market Value on the date of exercise. No fractional shares shall be issued and the Participant shall receive cash in lieu thereof. (c) Upon the exercise of a Related Right, the Option or part thereof to which such Related Right is related shall be deemed to have been exercised for the purpose of the limitations set forth in Section 4.1 on the number of shares of Common Stock to be issued under the Plan, but only to the extent of the number of shares of Common Stock issued under the Related Right. 7.3. Stand Alone Rights. (a) A Stand Alone Right shall be exercisable ratably on each of the first three anniversaries of the grant of such Stand Alone Right or as otherwise determined by the Committee, but in no event shall such Stand Alone Right be exercised earlier than one year or later than ten years from the date the Stand Alone Right is granted. The Committee may require that a Stand Alone Right only be exercised upon the achievement of such performance objectives as the Committee shall designate. The Committee may, for administrative convenience, determine that, for any Stand Alone Right which can only be exercised during a limited period of time in order to satisfy rules imposed by the Securities and Exchange Commission, the exercise of any such Stand Alone Right for cash during such limited period shall be deemed to occur for all purposes hereunder on the day during such limited period on which the Fair Market Value of the Common Stock is the highest. A Stand Alone Right shall be subject to earlier termination as provided in subsection 7.3(c) with respect to death, retirement and termination of employment. (b) Upon the exercise of a Stand Alone Right, a Participant shall be entitled to receive up to, but not more than, an amount in cash or shares of Common Stock equal in value to the excess of the Fair Market Value of one share of Common Stock on the date of exercise over the Fair Market Value of one share of Common Stock on the date of grant multiplied by the number of shares in respect of which the right is being exercised. The Committee shall have the right to determine the form of payment. Any shares delivered in payment shall be valued at their Fair Market Value on the date of exercise. No fractional shares shall be issued and the 8
Participant shall receive cash in lieu thereof. (c) Subject to the condition that no Stand Alone Right may be exercised in whole or in part after the expiration of the period specified by the Committee, and subject to the Committee's right to cancel any Stock Appreciation Right in accordance with Section 10.6, unless otherwise determined by the Committee: (i) Upon termination of employment prior to a Participant's attainment of age 55 but after the Participant is eligible for retirement pursuant to a retirement plan of the Company or any of its subsidiaries, a Participant may, within three years after the date of such termination, exercise any or all of the Stand Alone Right granted at least one year prior to such termination of employment, at or after the time or times the Participant would have been entitled to exercise such Stand Alone Right had the Participant not terminated employment; (ii) Upon termination of employment on or after a Participant's attainment of age 55 and after the Participant is eligible for retirement pursuant to a retirement plan of the Company or any of its subsidiaries, a Participant may, at any time prior to the expiration of the Stock Appreciation Right exercise period, exercise any or all of the Stand Alone Right granted at least one year prior to such termination of employment, at or after the time or times the Participant would have been entitled to exercise such Stand Alone Right had the Participant not terminated employment; and (iii) Upon termination of employment for any reason other than retirement as aforesaid, a Participant's Stand Alone Rights shall be cancelled to the extent not theretofore exercised. In addition, except in the event of death, the Participant shall repay to the Company the value of any Stand Alone Right exercised within the six month period preceding the date of such termination. 7.4. Transfer of Stock Appreciation Rights. A Stock Appreciation Right may not be transferred to anyone and may only be exercised by the Participant to whom it is granted Article VIII Restricted Stock Awards 8.1. Grant of Restricted Stock Awards. Subject to the limitations of the Plan, the Committee shall, after such consultation with and consideration of the recommendations of management as the Committee considers desirable, select from eligible employees those Participants to be granted Restricted Stock Awards and determine the time when each Award shall be granted, the vesting date or vesting dates for each Award, the time or times as of which vested Awards shall be paid and the number of share credits (each of which shall be equivalent to one share of Common Stock) subject to each Award. Restricted Stock Awards 9
shall be evidenced in such manner as may be approved by the Committee. Restricted Stock Awards may be amended or supplemented from time to time as approved by the Committee, provided that the terms of such Awards after being amended or supplemented conform to the terms of the Plan. No provision of this Plan shall be interpreted to prohibit the grant of a Restricted Stock Award hereunder in connection with awards granted pursuant to the 1995 Executive Officer Performance Plan of J.P. Morgan & Co. Incorporated and Affiliated Companies or any other plan of the Company, provided that any such Award conforms to the terms of this Plan. 8.2. Number of Share Credits. Each Restricted Stock Award shall state the number of share credits to be subject to the Award. 8.3. Restrictions. A Restricted Stock Award may not be sold, assigned, transferred, pledged, hypothecated or otherwise disposed of, except by will or the laws of descent and distribution, for a period of five years from the date of grant of the Award or such other period as the Committee shall determine, and for such further period as the payment of Awards may be deferred pursuant to Section 8.5. The Committee may define the Restricted Period in terms of the passage of time, the satisfaction of performance criteria, a combination of time and performance, or in any other manner it deems appropriate. Restricted Stock Awards shall not be paid until the successful completion of the Restricted Period except as may be otherwise provided in circumstances of death or retirement pursuant to Section 8.4, or until the end of any deferral period described in subsection 8.5(b). 8.4. Death, Retirement and Termination of Employment. Unless otherwise determined by the Committee: (a) Upon termination of a Participant's employment prior to the end of the Restricted Period for any reason except for death, as described below, the Participant's Awards shall be forfeited and the Participant shall have no right with respect to such Award. (b) Upon the death of a Participant, an Award granted to such Participant shall be (i) 100% (or such other percentage as the Committee shall have determined at the time of grant of such Award) vested and nonforfeitable and (ii) shall be payable to the Participant's beneficiary, or if none, the person or persons to whom such Participant's rights under the Award are transferred by will or the laws of descent and distribution, subject to any further deferral of the Award in accordance with subsection 8.5(b), provided that with respect to an Award subject to performance restrictions, the Committee shall make such determination with respect to such Award as it deems appropriate. 8.5. Payment of Awards. (a) Subject to the provisions of subsection (b) hereof, as soon as practicable after the successful completion of the Restricted Period, such Award shall be paid to the Participant or, in the case of the death of the Participant, the Participant's beneficiary, or if none, the person or persons to whom such Participant's rights under the 10
Award are transferred by will or the laws of descent and distribution. (b) The Committee may, in its discretion, provide that payment of Awards be deferred until such time or times as the Committee shall specify, or such time or times as the Participant may elect. Any election of a Participant pursuant to the preceding sentence shall be filed with the Committee in accordance with such rules and regulations, including any deadline for the making of such an election, as the Committee may provide. (c) Except as otherwise determined pursuant to subsection 8.6(c), payments pursuant to this Section 8.5, including any dividend equivalents determined under subsection 8.6(b), shall be made in shares of Common Stock, except there may be paid in cash the value of any partial shares of Common Stock and that part of the total payment determined by the Company to be necessary to satisfy tax withholding requirements. 8.6. Dividend Equivalents. (a) Except as may be otherwise determined by the Committee, in addition to the payment provided for in Section 8.5, each Participant (or beneficiary) entitled to payment under Section 8.5 shall receive the dividend equivalent amount calculated under subsection (b) hereof. (b) The dividend equivalent amount is the number of additional share credits attributable to the number of share credits awarded plus additional share credits calculated hereunder. Such additional share credits shall be determined and credited as of the end of each calendar year by dividing (1) the aggregate cash dividends which would have been paid had the share credits awarded or credited under this subsection (b), as the case may be, been actual shares of Common Stock on the record date for each such dividend during such calendar year by (2) the average market prices per shares of Common Stock on the last trading day of each calendar month during the 12 months ending on the November 30 preceding the date such determination is being made. For this purpose, the market price on any day shall be the average of the highest and lowest price of a share of Common Stock as reported on the composite tape for such day. The Committee may designate any other manner for determining and crediting dividend equivalents as it deems appropriate. (c) In such cases as the Committee may deem advisable, the Committee may, in lieu of the crediting provided for in subsection (b), determine to pay all or part of the dividend equivalent amount in cash or stock as dividends are actually paid on Common Stock, or at such other time or times as the Committee may otherwise determine. 11
Article IX Stock Unit Awards 9.1. Grant of Stock Unit Awards. The Committee shall have authority to grant to eligible employees Stock Unit Awards which can be in the form of Common Stock or units, the value of which is based, in whole or in part, on the value of Common Stock. Subject to the provisions of the Plan, including Section 9.2 below, Stock Unit Awards shall be subject to such terms, restrictions, conditions, vesting requirements and payment rules (all of which are sometimes hereinafter collectively referred to as "rules" ) as the Committee may determine in its sole discretion, all such rules applicable to a particular Stock Unit Award to be reflected in writing and furnished to the Participant. In no event shall any Award vest less than one year from the date of grant. The rules need not be identical for each Stock Unit Award. No provision of this Plan shall be interpreted to prohibit the grant of a Stock Unit Award hereunder in connection with awards granted pursuant to the 1995 Executive Officer Performance Plan or any other plan of the Company, provided that any such Award conforms to the terms of the Plan. 9.2. Rules. In the sole discretion of the Committee, a Stock Unit Award shall be granted subject to the following rules (a) Any shares of Common Stock which are part of a Stock Unit Award may not be sold, assigned, transferred, pledged, hypothecated or otherwise disposed of, except by will or the laws of descent and distribution, prior to the date on which the shares are issued or such other date provided by the Committee at the time of grant of the Award or thereafter. (b) Stock Unit Awards may provide for the payment of cash consideration by the person to whom such Award is granted or provide that the Award, and Common Stock to be issued in connection therewith, if applicable, shall be delivered without the payment of cash consideration. (c) Stock Unit Awards may relate in whole or in part to performance criteria established by the Committee at the time of grant. (d) Stock Unit Awards may provide for deferred payment schedules, vesting over a specified period of employment, the payment (on a current or deferred basis) of dividend equivalent amounts, with respect to the number of shares of Common Stock covered by the Award, and elections by the Participant to defer payment of the Award or the lifting of restrictions on the Award, if any. 12
Article X General Provisions 10.1. Change in Control. (a) (i) In the case of a Change in Control (as defined below) of the Company, each Option and Stock Appreciation Right then outstanding shall (unless the Committee determines otherwise) immediately be nonforfeitable and exercisable in full; (ii) In the case of a Change in Control (as defined below) of the Company, each Award shall (unless the Committee determines otherwise) immediately be fully vested and nonforfeitable and shall thereupon be paid as soon as practicable. (b) Any determination by the Committee made pursuant to this Section 10.1 may be made as to all outstanding Options, Stock Appreciation Rights or Awards or only as to certain Options, Stock Appreciation Rights or Awards specified by the Committee, and all such determinations shall be made in cases covered by paragraphs (c) (i) or (ii) below, prior to or as soon as practicable after the occurrence of such event and in the cases covered by paragraphs (c) (iii) and (iv) below, prior to the occurrence of such event. (c) A Change in Control shall occur if: (i) any "person" or "group of persons" as such terms are used in Section 13(d) and 14(d) of the Exchange Act directly or indirectly purchases or otherwise becomes the "beneficial owner" (as defined in Rule 13d-3 under the Exchange Act) or has the right to acquire such beneficial ownership (whether or not such right is exercisable immediately, with the passage of time, or subject to any condition), of voting securities representing 25% or more of the combined voting power of all outstanding voting securities of the Company; (ii) during any period of two consecutive years, the individuals who at the beginning of such period constitute the Board of Directors cease for any reason to constitute at least a majority of the members thereof, unless ( 1 ) there are seven or more directors then still in office who were directors at the beginning of the period, and (2) the election, or the nomination for election by the Company's stockholders, of each new director was approved by at least two-thirds of the directors then still in office who were directors at the beginning of the period; (iii) the stockholders of the Company shall approve an agreement to merge or consolidate the Company with or into another corporation as a result of which less than 50% of the outstanding voting securities of the surviving or resulting entity are or are to be owned by the former shareholders of the Company (excluding from former shareholders, a shareholder who is or, as a result of the transaction in question, becomes an "affiliate," as defined in Rule 12b-2 under the Exchange Act, of any party to such consolidation or merger); or 13
(iv) the stockholders of the Company shall approve the sale of all or substantially all of the Company's business and/or assets to a person or entity which is not a wholly-owned subsidiary of the Company. 10.2. Designation of Beneficiary. Subject to such rules and regulations as the Committee may prescribe, including the right of the Committee to limit the types of designations which are acceptable for purposes of the Plan, each Participant who shall be granted an Option or Award under the Plan may designate a beneficiary or beneficiaries and may change such designation from time to time by filing a written designation of beneficiaries with the Committee on a form to be prescribed by it, provided that no such designation shall be effective unless so filed prior to the death of such Participant. 10.3. No Right of Continued Employment. Neither the establishment of the Plan, the granting of Options, Stock Appreciation Rights or Awards, nor the payment of any benefits hereunder nor any action of the Company or of the Board of Directors or of the Committee shall be held or construed to confer upon any person any legal right to be continued in the employ of the Company or its subsidiaries, each of which expressly reserves the right to discharge any employee whenever the interest of any such company in its sole discretion may so require without liability to such company, the Board of Directors or the Committee except as to any rights which may be expressly conferred upon such employee under the Plan. 10.4. No Segregation of Cash or Shares. The Company shall not be required to segregate any cash or any shares of Common Stock which may at any time be represented by Options, Stock Appreciation Rights, Awards, share credits or dividend equivalent amounts and the Plan shall constitute an "unfunded" plan of the Company. No employee shall have voting or other rights with respect to shares of Common Stock prior to the delivery of such shares. The Company shall not, by any provisions of the Plan, be deemed to be a trustee of any Common Stock or any other property, and the liabilities of the Company to any employee pursuant to the Plan shall be those of a debtor pursuant to such contract obligations as are created by or pursuant to the Plan, and the rights of any employee, former employee or beneficiary under the Plan shall be limited to those of a general creditor of the Company. In its sole discretion, the Committee may authorize the creation of trusts or other arrangements to meet the obligations of the Company and each other Participating Company under the Plan, provided, however, that existence of such trusts or other arrangements is consistent with the unfunded status of the Plan. 10.5. Delivery of Shares. No shares shall be delivered pursuant to any exercise of an Option or Stock Appreciation Right or pursuant to the payment of any Award until the requirements of such laws and regulations as may be deemed by the Committee to be applicable thereto are satisfied. 10.6. Cancellation of Options, Stock Appreciation Rights and Awards. 14
(a) Prior to the occurrence of a Change in Control, but not thereafter, the Committee may, in its sole discretion and with or without cause, cancel any Option, Stock Appreciation Right or Award in whole or in part to the extent it has not theretofore been exercised or, in the case of Awards, become vested. Such cancellation shall be effective as of the date specified by the Committee. (b) Notwithstanding subsection (a) above, prior to payment of any Award, the Committee may, in its sole discretion, in cases involving a serious breach of conduct by an employee or former employee, or activity of a former employee in competition with the business of a Participating Company, cancel any Award, whether or not vested, in whole or in part. Such cancellation shall be effective as of the date specified by the Committee. The determination of whether an employee or former employee has engaged in a serious breach of conduct or activity in competition with the business of a Participating Company shall be determined by the Committee in good faith and in its sole discretion. 10.7. Transfer, Leave of Absence, etc. For purposes of the Plan: (1 ) a transfer of a Participant from a Participating Company to an affiliated company, (2) a leave of absence, duly authorized in writing by the Participating Company, for military service or sickness, or for any other purpose approved by the Participating Company H the period of such leave does not exceed ninety days, and (3) a leave of absence in excess of ninety days, duly authorized in writing by the Participating Company, provided the Participant's right to reemployment is guaranteed either by a statute or by contract, shall not be deemed a termination of employment. 10.8. New York Law to Govern. All questions pertaining to the construction, regulation, validity and effect of the provisions of the Plan shall be determined in accordance with the laws of the State of New York. 10.9. Payments and Tax Withholding. The delivery of any shares of Common Stock and the payment of any amount in respect of a Stock Appreciation Right or Award shall be of the account of the applicable Participating Company and any such delivery or payment shall not be made until the recipient shall have made satisfactory arrangements for the payment of any applicable withholding taxes. Article XI Amendment and Termination 11.1. Amendments, Suspension or Discontinuance. The Board of Directors may amend, suspend or discontinue the Plan, provided, however, that the Board of Directors may not, without the prior approval of the stockholders of the Company, make any amendment for which stockholder approval is necessary to comply with any applicable tax 15
or regulatory requirement, including for these purposes any approval requirement which is a prerequisite for exemptive relief under Section 16(b) of the Exchange Act, and provided, further, that upon or following the occurrence of a Change in Control no amendment may adversely affect the rights of any person in connection with any Option, Stock Appreciation Right or Award previously granted. 11.2. Termination. No Option, Stock Appreciation Right or Award shall be granted under the Plan after expiration of ten years from the date upon which the Plan is approved by vote of the stockholders of the Company. 16
Exhibit 10.13 1998 PERFORMANCE PLAN OF J.P. MORGAN & CO. INCORPORATED AND AFFILIATED COMPANIES ARTICLE I PURPOSE OF PLAN The purpose of the Plan is to promote the success of J.P. Morgan & Co. Incorporated and encourage certain employees to remain in its employ by providing compensation to such employees. ARTICLE II DEFINITIONS The following words and phrases herein shall have the following meanings unless a different meaning is plainly required by the context. 2.1 "Award" shall mean any award granted under the Plan. 2.1 "Company" shall mean J.P. Morgan & Co. Incorporated or any successor to it in ownership of all or substantially all of its assets. 2.3 "Board of Directors" shall mean the Board of Directors of the Company. 2.4 "Participating Company" shall mean the Company, and any subsidiary or other affiliated entity (whether or not incorporated). 2.5 "Code" shall mean the Internal Revenue Code of 1986, as amended from time to time. 2.6 "Employee" shall mean any executive employed by one or more Participating Companies who is selected by the Committee to receive an Award under the Plan. 2.7 "Plan" shall mean the 1998 Performance Plan of J.P. Morgan & Co. Incorporated and Affiliated Companies, as amended from time to time. 2.8 "Committee" shall mean the Committee established to administer the Plan in accordance with Section 3.1. 1
2.9 "Stock Incentive Plan" shall mean the 1995 Stock Incentive Plan of J.P. Morgan & Co. Incorporated and Affiliated Companies, as the same may be amended from time to time, and any successor plan thereto. 2.10 "Stock Plans" shall mean equity-based compensation plans of the Company, including but not limited to, the Stock Incentive Plan. ARTICLE III ADMINISTRATION OF THE PLAN 3.1. The Committee. The Plan shall be administered by a Committee consisting of at least three persons chosen by the Board of Directors from among those members of the Board of Directors who (i) are not eligible to participate in the Plan and (ii) are not employees of a Participating Company. The Committee may consult with management but shall have the responsibility of determining the Employees who are to receive Awards under the Plan and the amount of such Awards and shall otherwise be responsible for the administration of the Plan. The Committee also shall construe and interpret the Plan and adopt rules and regulations governing administration of the Plan, and exercise the remaining duties and powers conferred on it by the Plan, provided, however, the Committee may delegate to senior officers of the Company the power to act for the Committee as the Committee shall specify. ARTICLE IV AWARDS UNDER THE PLAN 4.1. Grant of Awards under the Plan. The Committee is hereby authorized to grant Awards to participants. Subject to the terms of the Plan and any applicable Award agreement, an Award granted under the Plan (i) may be denominated or payable in cash, shares of Common Stock of the Company (including, without limitation, grants or awards under the Stock Plans), other securities, other awards, or other property, or any combination thereof, and (ii) shall confer on the holder thereof rights valued as determined by the Committee and payable to, or exercisable by, the holder of the Award, based, in whole or in part, upon the Committee's assessment of the level of achievement of such performance or other goals during such performance or vesting periods as the Committee shall establish. Subject to the terms of the Plan and any applicable Award agreement, the performance or other goals for any performance or vesting period, the length of any performance or vesting period, the amount of any Award granted, and the amount of any payment or transfer to be made pursuant to any Award shall be determined by the Committee. Except as otherwise determined by the Committee, an Award shall be 2
forfeited if the Employee's employment terminates for any reason prior to the end of the applicable performance or vesting period established by the Committee. 4.2. Payment. (a) An Award shall be deemed "earned" if and to the extent the Committee so determines following the close of the applicable performance or vesting period. Except as provided in Section 4.2(b), Awards earned under the Plan shall be paid as promptly as practicable after the close of the applicable year, or after such further vesting or performance period as may be imposed by the Committee in its sole discretion. (b) The Committee shall have the right to require that payment of all or any portion of an earned Award be deferred until such time or times as the Committee, in its sole discretion, shall determine. In addition, the Committee may provide that an Employee may elect to defer the payment of any Award earned under the Plan. Deferral elections shall be made at such time and in such manner as the Committee shall prescribe. The Committee shall establish such terms, conditions, rules and regulations as it shall deem necessary and advisable with respect to deferred Awards including, but not limited to, the time of payment (including acceleration), the method of determining additional amounts, if any, to be credited with respect to a deferred Award, the applicable methods of payment of deferred Awards, and any special rules that may apply in the event of termination of employment for any reason. ARTICLE V GENERAL PROVISIONS 5.1. No Right of Continued Employment. Neither the establishment of the Plan nor the payment of any benefits hereunder nor any action of any Participating Company or of the Board of Directors or of the Committee shall be held or construed to confer upon any person any legal right to be continued in the employ of a Participating Company and each Participating Company expressly reserves the right to discharge an Employee whenever the interest of any such company in its sole discretion may so require without liability to such Participating Company, the Board of Directors or the Committee except as to any rights which may be expressly conferred upon such Employee under the Plan. 5.2. Discretion of the Company, Board of Directors and Committee. Any decision made or action taken by the Company, the Board of Directors or by the Committee arising out of or in connection with the construction, administration, interpretation and effect of the Plan shall lie within the absolute discretion of the Company, the Board of Directors or the Committee, as the case may be, and shall be conclusive and binding upon all persons. 5.3. Absence of Liability. No member of the Board of Directors or of the Committee or officer of any Participating Company shall be liable for any act or action hereunder, 3
whether of commission or omission, taken by any other member, or by an officer, agent, or employee, or, except in circumstances involving his bad faith, for anything done or omitted to be done by himself. 5.4. No Segregation of Cash or Shares. (a) The Company shall not be required to segregate any cash or any other assets which may at any time be represented by Awards credited to an Employee and the Plan shall constitute an "unfunded" plan of the Company. (b) The Company shall not, by any provisions of this Plan, be deemed to be a trustee of any property, and the liabilities of the Company to any Employee pursuant to the Plan shall be those of a debtor pursuant to such contract obligations as are created by or pursuant to the Plan, and the rights of any Employee, former Employee or beneficiary shall be limited to those of an unsecured creditor of the Company. In its sole discretion, the Board of Directors may authorize the creation of trusts or other arrangements to meet the obligations of the Participating Companies under the Plan, provided, however, that the existence of such trusts or arrangements is consistent with the unfunded status of the Plan. 5.5. Inalienability of Benefits and Interests. (a) Except as expressly provided by the Committee and subsection (b) hereof, no Award, nor any benefit payable under or interest in the Plan, shall be subject in any manner to anticipation, alienation, sale, transfer, assignment, pledge, encumbrance or charge, and any such attempted action shall be void and no such benefit or interest shall be in any manner liable for or subject to debts, contracts, liabilities, engagements or torts of any Employee, or former Employee. (b) The provisions of subsection (a) hereof shall not apply to an assignment by the Employee's legal representative or beneficiary of a payment due after the death of the Employee if such assignment is made for the purposes of settling the affairs of such deceased Employee nor to a beneficiary designation made by an Employee to the extent authorized by the Committee. 5.6. New York Law to Govern. All questions pertaining to the construction, regulation, validity and effect of the provisions of the Plan shall be determined in accordance with the laws of the State of New York. 5.7. Payment of Awards. Payment of Awards shall be by or for the account of the Participating Companies and the Company and the Participating Companies may make such arrangements as they may deem appropriate with respect thereto. 5.8. Cancellation of Awards. (a) Prior to the occurrence of a Change in Control, but not thereafter, the Committee may, in its sole discretion and with or without cause, cancel any Award in whole or in part to the extent it has not theretofore become vested. Such cancellation shall be effective as of the date specified by the Committee. 4
(b) Notwithstanding subsection (a) above, prior to payment of any Award, the Committee may, in its sole discretion, in cases involving a serious breach of conduct by an Employee or former Employee, or activity of a former Employee in competition with the business of a Participating Company, cancel any Award, whether or not vested, in whole or in part. Such cancellation shall be effective as of the date specified by the Committee. The determination of whether an Employee or former Employee has engaged in a serious breach of conduct or activity in competition with the business of a Participating Company shall be determined by the Committee in good faith and in its sole discretion. 5.9. Change in Control. (a) In the event of a Change in Control, the payment of all outstanding Awards (whether or not vested, earned, deferred or subject to attainment of further goals) shall (unless the Committee otherwise determines) be made as soon as practicable and the Committee shall, in its discretion, determine the terms of such payments, if any, including but not limited to, the amount and form of such payments. (b) For purposes of this Section 5.9, a Change in Control shall have the same meaning as specified in Section 10.1(c) of the Stock Incentive Plan. In addition, any determination made by the Committee under Section 5.9(a) shall be made in cases covered by a Change in Control as defined in Section 10.1(c)(i) or (ii) of the Stock Incentive Plan prior to or as soon as practicable after the occurrence of such event and in cases covered by a Change in Control as defined in Section 10.1(c)(iii) and (iv) of the Stock Incentive Plan prior to the occurrence of such event. ARTICLE VI AMENDMENT, SUSPENSION OR TERMINATION OF PLAN The Board of Directors or the Committee may from time to time amend, suspend or terminate the Plan in whole or in part, and if suspended or terminated, may reinstate any or all of the provisions of the Plan, except that without the consent of the Employee no amendment, suspension or termination of the Plan shall adversely affect the rights of any Employee with respect to an Award previously made to such Employee. 5
Exhibit 10.16
JPMorgan Chase & Co.
Severance Policy—Summary of Terms
Purpose: To provide severance and other benefits in the case of involuntary termination, except for cause.
Benefit Amount: For executive officers other than the CEO, an amount equal to two times current base salary, plus two times such officer’s three-year average cash performance bonus. For the CEO, an amount equal to the greater of (a) $22.2 million or (b) three times current base salary and, three times his three-year average cash performance bonus.
Treatment of Stock Awards: Under the terms and conditions of restricted stock unit awards and option grants, upon a job elimination:
(1) officers would be entitled to full vesting of restricted stock units, except that performance-based restrictions on restricted stock or other stock-based awards would continue; and
(2) stock options (other than Growth Performance Incentive Program stock options) would become exercisable immediately and remain exercisable for their term for persons who are retirement eligible and for up to two years for persons not retirement eligible.
Welfare Benefits: Officers continue to receive medical and dental benefits for two years following such termination (three years for the CEO).
Severance provisions for James Dimon are contained in his employment agreement.
EXHIBIT 10.28 FIRST CHICAGO CORPORATION STOCK INCENTIVE PLAN 1. Purpose The purpose of the First Chicago Corporation Stock Incentive Plan is to provide incentive and rewards for Employees of the Corporation and its Subsidiaries (i) to support the execution of the Corporation's business And human resource strategies and the achievement of its goals and (ii) to Associate the interests of Employees with those of the Corporation's stockholders. 2. Definitions (a) "Award" includes, without limitation, stock options (including incentive stock options under Section 422 of the Code), stock appreciation rights, performance share or unit awards, dividend or equivalent rights, stock awards, restricted share or unit awards, or other awards that are valued in whole or in part by reference to, or are otherwise based on, the Corporation's Common Stock ("other Common Stock-based Awards"), all on a stand alone, combination or tandem basis, as described in or granted under this Plan. (b) "Award Summary" means a written summary setting forth the terms and conditions of each Award made under this Plan. (c) "Board" means the Board of Directors of the Corporation, excluding any member who is an officer or employee of the Corporation or who otherwise would not be considered a disinterested person within the meaning of Rule 16b-3 of the Securities and Exchange Commission. (d) "Code" means the Internal Revenue Code of 1986, as amended from time to time. (e) "Committee" means the Organization Committee of the Board or such other committee of the Board as may be designated by the Board from time to time to administer this Plan. (f) "Common Stock" means the $5.00 par value Common Stock of the Corporation. (g) "Corporation" means First Chicago Corporation, a Delaware corporation. (h) "Employee" means an employee of First Chicago Corporation or a Subsidiary. (i) "Exchange Act" means the Securities Exchange Act of 1934, as amended. (j) "Fair Market Value" means the average of the highest and the lowest quoted selling price on the New York Stock Exchange Composite
Transactions Tape on the relevant valuation date or, if there were no sales on the valuation date, on the next preceding date on which such selling prices were recorded; provided, however, that the Committee may specify some other definition of Fair Market Value with respect to any particular Award. (k) "Participant" means an Employee who has been granted an Award under the Plan. (l) "Plan" means this First Chicago Corporation Stock Incentive Plan. (m) "Plan Year" means a twelve-month period beginning with January 1 of each year. (n) "Subsidiary" means any corporation or other entity, whether domestic or foreign, in which the Corporation has or obtains, directly or indirectly, a proprietary interest of more than 50% by reason of stock ownership or otherwise. 3. Eligibility Any Employee selected by the Committee is eligible to receive an Award. 4. Plan Administration (a) Except as otherwise determined by the Board, the Plan shall be administered by the Committee. The Board, or the Committee to the extent determined by the Board, shall periodically make determinations with respect to the participation of Employees in the Plan and, except as otherwise required by law or this Plan, the grant terms of Awards including vesting schedules, price, length of relevant performance, restriction or option period, dividend rights, post-retirement and termination rights, payment alternatives such as cash, stock, contingent awards or other means of payment consistent with the purposes of this Plan, and such other terms and conditions as the Board or the Committee deems appropriate. (b) The Committee shall have authority to interpret and construe the provisions of the Plan and the Award Summaries and make determinations pursuant to any Plan provision or Award Summary which shall be final and binding on all persons. No member of the Committee shall be liable for any action or determination made in good faith, and the members shall be entitled to indemnification and reimbursement in the manner provided in the Corporation's Certificate of Incorporation, as it may be amended from time to time. (c) The Committee may designate persons other than its members to carry out its responsibilities under such conditions or limitations as it may set, other than its authority with regard to Awards granted to Employees who are officers or directors of the Corporation for purposes of Section 16 of the Exchange Act. (d) The Committee shall have the authority at any time prior to a Change of Control (as defined in Section 12(b)) to cancel Awards for reasonable cause and to provide for the conditions and circumstances under which Awards shall be forfeited.
5. Stock Subject To The Provisions Of This Plan (a) The stock subject to the provisions of this Plan shall be shares of authorized but unissued Common Stock and shares of Common Stock held as treasury stock. Subject to adjustment in accordance with the provisions of Section 10, and subject to Section 5(c) below, the total number of shares of Common Stock available for grants of Awards in any Plan Year shall not exceed 2% of the outstanding Common Stock as reported in the Corporation's Annual Report on Form 1O-K for the fiscal year ending immediately prior to such Plan Year. (b) The exercise of an option or stock appreciation right granted in tandem therewith will reduce proportionately the amount of shares subject to the tandem stock appreciation right or option. In addition, any shares ceasing to be subject to the related option or right because of such reduction shall not increase the number of shares of Common Stock available for future Awards granted under the Plan. The grant of a performance or restricted share Unit Award shall be deemed to be equal to the maximum number of shares which may be issued under the Award. Where the value of an Award is variable on the date it is granted, the value shall be deemed to be the maximum limitation of the Award. Awards payable solely in cash will not reduce the number of shares available for Awards granted under the Plan. (c) There shall be carried forward and be available for Awards under the Plan in succeeding Plan Years, in addition to shares available for grant under paragraph (a) of this Section 5, all of the following: (i) any unused portion of the limit set forth in paragraph (a) of this Section 5 for a prior Plan Year; (ii) shares represented by Awards which are cancelled, forfeited, surrendered, terminated, paid in cash or expire unexercised; (iii) the excess amount of variable Awards which become fixed at less than their maximum limitations; (iv) authorized shares as to which options, restricted shares, performance shares or stock appreciation rights were not granted under either the First Chicago Corporation 1983 Stock Option Plan or the First Chicago Corporation Strategic Stock Incentive Plan; and (v) shares under either of those plans subject to stock options, restricted shares, performance shares or stock appreciation rights which are forfeited, surrendered, terminated or expire unexercised. 6. Awards Under This Plan As the Board or Committee may determine, the following types of Awards and other Common Stock-based Awards may be granted under this Plan on a stand alone, combination or tandem basis: (a) Stock Option. A right to buy a specified number of shares of Common Stock at a fixed exercise price during a specified time, all as the Committee may determine; provided that the exercise price of any option shall not be less than 100% of the Fair Market Value of the Common Stock on the date of grant of the Award. (b) Incentive Stock Option. An Award in the form of a stock option which shall comply with the requirements of Section 422 of the Code or any successor Section as it may be amended from time to time. Subject to adjustment in accordance with the provisions of Section 10, the aggregate number of shares which may be subject to incentive stock option Awards under this Plan shall not exceed 7,000,000 shares, subject in any Plan Year tothe limitations of Section 5 of this Plan.
(c) Stock Appreciation Right. A right to receive the excess of the Fair Market Value of a share of Common Stock on the date the stock appreciation right is exercised over the Fair Market Value of a share of Own Stock on the date the stock appreciation right was granted. (d) Restricted and Performance Shares. A transfer of Common Stock to a Participant, subject to such restrictions on transfer or other incidents of ownership, or subject to specified performance standards, for such periods of time as the Committee may determine. (e) Restricted and Performance Share Unit. A fixed or variable share or dollar denominated unit subject to such conditions of vesting, performance and time of payment as the Committee may determine, which unit may be paid in Common Stock, cash or a combination of both. (f) Dividend or Equivalent Right. A right to receive dividends or their equivalent in value in Common Stock, cash or in a combination of both with respect to any new or previously existing Award. (g) Stock Award. An unrestricted transfer of ownership of Common Stock which may only be made to Employees other than Employees who are officers or directors of the Corporation for purposes of Section 16 of the Exchange Act. (h) Other Stock-Based Awards. Other Common Stock-based Awards which are-related to or serve a similar function to those Awards set forth in this Section 6. In addition to granting Awards for purposes of incentive compensation, Awards may also be made in tandem with or in lieu of current or deferred Employee compensation. No Common Stock shall be issued pursuant to any Award unless consideration at least equal to the par value thereof has been Received by the Corporation in the form of cash, services rendered or property. 7. Award Summaries Each Award under the Plan shall be evidenced by an Award Summary. Delivery of an Award Summary to each Participant shall constitute an agreement, Subject to Section 4(d) and Section 9 hereof, between the Corporation and the Participant as to the terms and conditions of the Award. 8. Other Terms and Conditions (a) Assignability. No Award shall be assignable or transferable except by will, by the laws of descent and distribution or pursuant to a qualified domestic relations order as defined by the Code, and during the lifetime of a Participant, the Award shall be exercisable only by such Participant or such Participant's guardian, legal representative or assignee pursuant to a qualified domestic relations order. (b) Termination of Employment. The Committee shall determine the disposition of the grant of each Award in the event of the retirement, disability, death or other termination of a Participant's employment. (c) Rights as a Shareholder. A Participant shall have no rights
as a stockholder with respect to shares covered by an Award until the date the Participant or his nominee, guardian or legal representative is the holder of record. No adjustment will be made for dividends or other rights for which the record date is prior to such date. (d) No Obligation To Exercise. The grant of an Award shall impose no obligation upon the Participant to exercise the Award. (e) Payments By Participants. The Committee may determine that Awards for which a payment is due from a Participant may be payable: (i) in U.S. dollars by personal check, bank draft or money order payable to the order of the Corporation, by money transfers or direct account debits; (ii) through The delivery or deemed delivery based on attestation to the ownership of shares of Common Stock with a Fair Market Value equal to the total payment due from the Participant; (iii) by a combination of the methods described in (i) and (ii) above; or (iv) by such other methods as the Committee may deem appropriate. (f) Withholding. Except as otherwise provided by the Committee, (i) the deduction of withholding and any other taxes required by law will be made from all amounts paid in cash and (ii) in the case of payments of Awards in shares of Common Stock, the Participant shall be required to pay the amount of any taxes required to be withheld prior to receipt of such stock, or alternatively, a number of shares the Fair Market Value of which equals the amount required to be withheld may be deducted from the payment. The Committee may provide for shares of Common Stock to be withheld for tax withholding purposes in excess of the required minimum amount but not in excess of a Participant's maximum marginal tax rate. (g) Restrictions On Sale and Exercise. With respect to Employees who are officers and directors for purposes of Section 16 of the Exchange Act, and if required to comply with rules promulgated thereunder, (i) no Award providing forexercise, a vesting period, a restriction period or the attainment of performance standards shall permit unrestricted ownership of Common Stock by the Participant for at least six months from the date of grant, and (ii) Common Stock acquired pursuant to this Plan (other than Common Stock acquired as a result of the granting of a "derivative security") may not be sold for at least six months after acquisition. 9. Amendments The Board may alter, amend, suspend or discontinue the Plan or at any time prior to a Change of Control (as defined in Section 12(b)) alter or amend any or all Award Summaries granted under the Plan to the extent permitted by law. Any such action of the Board may be taken without the approval of the Corporation's stockholders, but only to the extent that such stockholder approval is not required by applicable law or regulation, including specifically Rule 16b-3 of the Securities and Exchange Commission. 10. Recapitalization The aggregate number of shares of Common Stock as to which Awards may be granted to Participants, the number of shares thereof covered by each outstanding Award, and the price per share thereof in each such Award, shall all be proportionately adjusted for any increase or decrease in the number
of issued shares of Common Stock resulting from a subdivision or consolidation of shares or other capital adjustment, or the payment of a stock dividend or other increase or decrease in such shares, effected without receipt of consideration by the Corporation, or other change in corporate or capital structure; provided, however, that any fractional shares resulting from any such adjustment shall be eliminated. The Committee may also make the foregoing changes and any other changes, including changes in the classes of securities available, to the extent it is deemed necessary or desirable to preserve the intended benefits of the Plan for the Corporation and the Participants in the event of any other reorganization, recapitalization, merger, consolidation, spin-off, extraordinary dividend or other distribution or similar transaction. 11. No Right To Employment No person shall have any claim or right to be granted an Award, and the grant of an Award shall not be construed as giving a Participant the right to be retained in the employ of the Corporation or a Subsidiary. Further, the Corporation and each Subsidiary expressly reserve the right at any time to dismiss a Participant free from any liability, or any claim under the Plan, except as provided herein or in any Award Summary issued hereunder. 12. Change of Control (a) Notwithstanding anything contained in this Plan or any Award Summary to the contrary, in the event of a Change of Control, as defined below, The following shall occur with respect to any and all Awards outstanding as of such Change of Control: (i) automatic maximization of performance standards, lapse of all restrictions and acceleration of any time periods relating to the exercise, realization or vesting of such Awards so that such Awards may be immediately exercised, realized or vested in full on or before the relevant date fixed in the Award Summary; (ii) performance shares or performance units shall be paid entirely in cash; (iii) upon exercise of a stock option or an incentive stock option (collectively an "Option") during the 60-day period from and after the date of a Change of Control, the Participant exercising the Option may in lieu of the receipt of Common Stock upon the exercise of the Option, elect by written notice to the Corporation to receive an amount in cash equal to the excess of the aggregate Value (as defined below) of the shares of Common Stock covered by the Option or portion thereof surrendered determined on the date the Option is exercised, over the aggregate exercise price of the Option (such excess is referred to herein as the "Aggregate Spread"); provided, however, and notwithstanding any other provision of the Plan, if the end of such 60- day period from and after the date of a Change of Control is within six months of the date of grant of an Option held by a Participant who is an officer or director of the Corporation (within the meaning of Section 16(b) of the Exchange Act), such Option shall be cancelled in exchange for a cash payment to The Participant equal to the Aggregate Spread on the day which is six months and one day after the date of grant of such Option. As used in this Section
12(a)(iii) the term "Value" means the higher of (i) the highest Fair Market Value during the 60-day period from and after the date of a Change of Control and (ii) if the Change of Control is the result of a transaction or series of transactions described in paragraphs (i) or (iii) of the definition of Change of Control set forth in Section 12(b), the highest price per share of the Common Stock paid in such transaction or series of transactions (which in the case of paragraph (i) shall be the highest price per share of the Common Stock as reflected in a Schedule 18D by the person having made the acquisition); (iv) if a Participant's employment terminates for any reason other than retirement or death following a Change of Control, any Options held by the Participant may be exercised by the Participant until the earlier of three months after such termination of employment or the expiration date of such Options; and (v) all Awards become non-cancellable. (b) A "Change of Control" of the Corporation shall be deemed to have occurred upon the happening of any of the following events: (i) the acquisition, other than from the Corporation, by any individual, entity or group (within the meaning of Section 13(d)(3) or 14(d)(2) of the Exchange Act) of beneficial ownership (within the meaning of Rule 13d-3 promulgated under the Exchange Act) of 20% or more of either the then outstanding shares of Common Stock of the Corporation or the combined voting power of the then outstanding voting securities of the Corporation entitled to vote generally in the election of directors, but excluding, for this purpose, any such acquisition by the Corporation or any of its Subsidiaries, or any employee benefit plan (or related trust) of the Corporation or its Subsidiaries, or any corporation with respect to which, following such acquisition, more than 50% of, respectively, the then outstanding shares of common stock of such corporation and the combined voting power of the then outstanding voting securities of such corporation entitled to vote generally in the election of directors is then beneficially owned, directly or indirectly, by all or substantially all of the individuals and entities who were the Beneficial owners, respectively, of the Common Stock and voting securities of the Corporation immediately prior to such acquisition in substantially the Same proportion as their ownership, immediately prior to such acquisition, of the then outstanding shares of Common Stock of the Corporation or the combined voting power of the then outstanding voting securities of the Corporation entitled to vote generally in the election of directors, as the case may be; (ii) individuals who, as of the date hereof, constitute the Board (as of the date hereof the "Incumbent Board") cease for any reason to constitute at least a majority of the Board, provided that any individual becoming a director subsequent to the date hereof whose election, or nomination for election by the Corporation's shareholders, was approved by a vote of at least a majority of the directors then comprising the Incumbent Board shall be considered as though such individual were a member of the Incumbent Board, but excluding, for this purpose, any such individual whose initial assumption of office is in connection with an actual or threatened election contest relating to the election of the directors of the Corporation (as such terms are used in Rule 14a-11 of Regulation 14A promulgated under the Exchange Act); or
(iii) approval by the stockholders of the Corporation of a reorganization, merger or consolidation of the Corporation, in each case, with respect to which all or substantially all of the individuals and entities who were the respective beneficial owners of the Common Stock and voting securities of the Corporation immediately prior to such reorganization, merger or consolidation do not, following such reorganization, merger or consolidation, beneficially own, directly or indirectly, more than 50% of, respectively, the then outstanding shares of Common Stock and the combined voting power of the then outstanding voting securities entitled to vote generally in the election of directors, as the case may be, of the corporation resulting from such reorganization, merger or consolidation, or a complete liquidation or dissolution of the Corporation or of the sale or other disposition of all or substantially all of the assets of the Corporation. 13. Governing Law To the extent that federal laws do not otherwise control, the Plan shall be construed in accordance with and governed by the law of the State of Delaware. 14. Supplemental Plans The Board shall have the authority to adopt plans, supplemental to This Plan, covering Employees residing outside the United States, including but not limited to the United Kingdom. 15. Savings Clause This Plan is intended to comply in all aspects with applicable law And regulation, including, with respect to those Employees who are officers Or directors for purposes of Section 16 of the Exchange Act, Rule 16b-3 of The Securities and Exchange Commission. In case any one or more of the Provisions of this Plan shall be held invalid, illegal or unenforceable in any Respect under applicable law and regulation (including Rule 16b-3), the validity, legality and enforceability of the remaining provisions shall not in any way be affected or impaired thereby and the invalid, illegal or unenforceable provision shall be deemed null and void; however, to the extent permissible by law, any provision which could be deemed null and void shall first be construed, interpreted or revised retroactively to permit this Plan to be construed in compliance with all applicable laws (including Rule 16b-3) so as to foster the intent of this Plan. 16. Effective Date and Term The effective date of this Plan is January 1, 1991, subject to its Approval by the stockholders of the Corporation at the annual meeting to be held on April 12, 1991, or any adjournment thereof. The Plan shall remain in effect until terminated by the Board.
EXHIBIT 10.29 NBD BANCORP, INC. PERFORMANCE INCENTIVE PLAN (As Amended March 21, 1994) SECTION 1 - PURPOSE The NBD BANCORP, INC. PERFORMANCE INCENTIVE PLAN (hereinafter called the "Plan") is a plan to provide long term incentive compensation to certain current and former key officers and employees of NBD Bancorp, Inc. (hereinafter called the "Corporation") and of its affiliated entities (hereinafter, including the Corporation, called "participating affiliates") based upon such officers' and employees' individual contributions to the long term growth and profitability of the Corporation, in order to encourage their identity with shareholder concerns and their current and continuing interest in the development and financial success of the Corporation. Because it is expected that the efforts of the officers and employees selected for participation in the Plan will have a significant impact on the results of the Corporation's operations in future years, the Plan is intended to assist the Corporation in attracting and retaining as officers and employees individuals of superior ability and in motivating their activities on behalf of the Corporation. SECTION 2 - DEFINITIONS (a) The term "affiliated entities" shall mean those corporations and partnerships in which the Corporation owns directly or indirectly a significant equity interest as defined under generally accepted accounting principles. (b) The term "Code" shall mean the Internal Revenue Code of 1986, as the same may be from time to time amended. (c) The term "Committee" shall mean the Compensation Committee of the Board of Directors of the Corporation, the members of which shall be "disinterested persons"' under Rule 16b-3 of the Securities and Exchange Commission (or any successor regulation issued under federal securities laws) and shall be ineligible to participate in the Plan. (d) The term "company stock" shall mean shares of the common capital stock of the Corporation available for award or awarded, or subject to options or rights granted, under the Plan. (e) The term "market value" shall mean for a share of company stock as of any date the mean between the highest and lowest sale prices for the company stock as reflected in the New York Stock Exchange Composite Transactions Quotations for that date, or if there is no sale on such date, then on the next preceding date on which a sale has occurred. 1
(f) The term "options" shall mean collectively the incentive stock options and the non-qualified options available for grant or granted under Section 10 of the Plan. (g) The term "optionee" means any person to whom an option or right has been granted or who becomes a holder of an option or right under Section 10 of the Plan. (h) The term "performance share" shall mean one share of company stock available for award or awarded under Section 8 of the Plan. (i) The term "rights" shall mean the stock appreciation rights available for grant or granted in connection with options under Section 10 of the Plan. (j) The term "share unit" shall mean a unit available for award under the Plan having a cash value upon distribution equal to the market value of one share of company stock on the distribution date. SECTION 3 - EFFECTIVE DATE AND DURATION Subject to the approval of the Plan by the shareholders of the Corporation, the Plan shall be generally effective as of January 1, 1988. The Plan shall continue until it is terminated by the Board of Directors as provided in Section 12. SECTION 4 -ADMINISTRATION The Committee shall be responsible for the general operation and administration of the Plan and shall have the authority to interpret the Plan and to adopt administrative rules and regulations governing its operation. The Committee may delegate the performance of administrative functions to the Secretary of the Committee. SECTION 5 - PARTICIPATION, STOCK AWARDS AND OPTION GRANTS (a) Each year, the Committee shall designate as participants in the Plan those officers and employees of the participating affiliates and those former officers and employees who have a consulting arrangement with the Corporation whom the Committee determines to have significant responsibility for the success and future growth and profitability of the Corporation. (b) Each year, the Committee may award shares of company stock, performance shares, share units, and/or may grant stock options that qualify as "incentive stock options" within the meaning of Section 422 of the Code or stock options that do not qualify as incentive stock options and/or stock appreciation rights for use in connection with options to each current and former officer and employee whom it has designated as a participant for such year. Upon the approval by the Board of Directors of the Corporation of the individual awards and/or grants, if any, made to executive officers and of the total of all awards and grants made to all other persons, the determination of the Committee as to each such award and grant shall become final. 2
SECTION 6 - SHARES RESERVED UNDER THE PLAN There is hereby reserved for award and/or grant under the Plan an aggregate number of whole shares of company stock equal as nearly as possible to, but not more than, 5% of the aggregate shares of company stock outstanding on the first day of January of each year, less the number of shares and share units awarded or subject to options granted under the Plan during the immediately preceding four-calendar-year period that have not been forfeited. Of such aggregate number, no more than 1,000,000 shares of company stock shall be available for the grant of incentive stock options under the Plan. Shares of company stock may be authorized but unissued shares, treasury shares, shares acquired in the open market, or any combination of the foregoing, and if acquired in the open market, shall be acquired by an agent independent of the participating affiliates. Any shares of company stock (including performance shares), share units, or options that are forfeited pursuant to Sections 8(f) or (g), 9(d) or (e), or 10(h) of the Plan and, to the extent permissible for purposes of allowing the Plan to continue to be considered as described under Rule 16b-3 under the Securities Exchange Act of 1934, as amended (the "Exchange Act"), any shares of company stock that are used for full or partial payment of the purchase price of shares with respect to which an option is exercised pursuant to Section 10 of the Plan may thereafter again be awarded or made subject to grant under the Plan. In the event of any change in the outstanding shares of the common capital stock of the Corporation by reason of a stock dividend, stock split, recapitalization, merger, consolidation, combination or exchange of shares, or other similar change, the Committee may make appropriate adjustments in the aggregate number of shares of company stock (including performance shares) and share units already awarded or made subject to options granted or reserved for award or grant under the Plan, in the prices of options granted, or provide for the substitution of other securities of the class exchanged for common capital stock of the Corporation in any merger or consolidation. SECTION 7 - SHARES AWARDED AND OPTIONS GRANTED UNDER THE PLAN (a) Shares of company stock (including performance shares), share units, options and/or rights awarded or granted to a participant may not be sold, transferred, alienated or assigned (other than by will or the laws of descent and distribution) during the award period, performance period and/or exercise period established with respect to such shares, but nothing contained in this sentence shall preclude the sale or other transfer of shares of company stock obtained by the proper exercise of any option. During the lifetime of an optionee, the option or right shall be exercisable only by the optionee personally or by the optionee's legal representative. (b) Subject to the vesting provisions of Sections 8(e) and 9(c), shares of company stock awarded to a participant will become freely transferable by the participant only at the end of the award period or performance period established with respect to such shares. (c) The vesting of awards of shares of company stock (including performance shares) and/or share units in, and the exercise of options and/or rights by, a participant under this Plan shall be subject to satisfaction of the conditions precedent that the participant refrain from engaging in any activity that, in the opinion of the Committee, is competitive with any activity of the Corporation or 3
any of the participating affiliates (except that employment at the request of the Corporation with an entity in which the Corporation has, directly or indirectly, a substantial ownership interest, or other employment specifically approved by the Committee, shall not be considered to be an activity that is competitive with any activity of the Corporation or any of the participating affiliates) and from otherwise acting, either prior to or after termination of employment, in any manner inimical or in any way contrary to the best interests of the Corporation and that the participant furnish to the Corporation such information with respect to the satisfaction of the foregoing conditions precedent as the Committee shall reasonably request. Any shares of company stock awarded or issued under the Plan may be made subject to such other conditions or restrictions as the Committee deems advisable, including without limitation, provisions to comply with federal and state securities laws. (d) Whenever shares of company stock are awarded to a participant, such shares shall be outstanding, and stock certificates may be issued in the name of the participant or a book entry may be made by the Corporation's stock transfer agent for the account of the participant, which certificates and/or account shall bear a legend stating that the shares are issued subject to the restrictions set forth in the Plan. Any certificates actually issued for shares of company stock awarded under the Plan shall be deposited for the benefit of the participant with NBD Bank, N.A., as custodian until such time as the shares are vested and transferable. (e) A participant who is awarded shares of company stock under Section 8 or Section 9 of the Plan shall have full voting rights on such shares, whether or not the shares are vested or transferable. (f) Shares of company stock awarded to a participant under Section 8 or Section 9 of the Plan, whether or not vested or transferable, shall have full dividend rights with respect to dividends declared after the award, with such dividends being paid directly to the participant. If all or part of a dividend is paid in the form of shares of common capital stock of the Corporation, such shares shall be issued in the same manner, and subject to the same deposit requirements, vesting provisions and transferability restrictions as the shares of company stock that are the basis for the dividend. Like requirements, provisions and restrictions shall be applicable to shares or securities issued as a result of a merger, consolidation or similar event. A participant to whom share units have been awarded may be given by the Committee the right to receive during the performance or award period as additional compensation cash in an amount equal to the product of (i) the per share dividend on company stock that is declared after the award of share units and (ii) the number of share units awarded to such participant, and in such case such sums shall be payable directly to the participant at the same time as dividends on company stock are paid. SECTION 8 - PERFORMANCE AWARDS AND PERIODS (a) Participants eligible to receive awards of performance shares and/or share units under the Plan shall be selected by the Committee from among the more senior officers of the Corporation and its participating affiliates. For officers who are "covered employees" under Section 162(m) of the Internal Revenue Code of 1986, as amended, and related regulations, the Committee shall administer awards under this Section 8 of the Plan in accordance with the provisions of Appendix A. 4
(b) Effective January 1, 1988, and each year thereafter, the Committee shall establish a performance period of no less than one (1) year and no more than five (5) years in duration for the award of performance shares, which period shall begin on the first day of January of the first year of the period and shall end on the last day of December of the final year of such period. At the beginning of a performance period, the Committee shall make such award or awards of performance shares or share units to each selected participant as it determines. During a performance period the Committee may increase awards of performance shares or share units to such selected participants whose increased corporate responsibilities warrant, in the judgment of the Committee, such increase and may make awards of performance shares or share units to such newly selected participants whose corporate responsibilities warrant, in the judgment of the Committee, such award. (c) As of the beginning of each performance period, the Committee shall establish one or more business performance goals for that period, and the weight to be given to each such goal. In setting performance goals, the Committee may take into account performance in comparison with such peer financial institutions as may be selected by the Committee for that purpose. The Committee may, from time to time thereafter, make appropriate adjustments in performance goals to reflect major unforeseen transactions, events or circumstances that alter or affect such goals. (d) As soon as practicable after the end of each performance period, the Committee shall determine the extent to which the performance goals for that period were attained and shall make the distributions, if any, prescribed in Section 8(h). (e) If a participant has received an award pursuant to the provisions of Section 8(b) of the Plan and is employed by the participating affiliates at the end of a performance period and the Committee determines that the performance goals for such performance period were fully met, the participant shall be fully vested at the end of the performance period in the number of performance shares or share units awarded to the participant for that performance period. In the event that the Committee determines that the performance goals for such performance period were only partially met or were unmet, then the Committee will determine what portion of the performance share or share unit award, if any, will be distributable for such performance period, and the balance of the participant's performance share or share unit award, if any, shall be forfeited to the Corporation as of the last day of the performance period. In the event that the Committee determines that the satisfaction the performance goals for such performance period so warrant, the Committee may for that performance period make additional awards of performance shares or share units to such selected participants as the Committee determines, which additional performance shares and/or share units shall be fully vested and nonforfeitable. (f) Unless the Committee provides otherwise, in the event that before the end of a performance period a participant dies, becomes totally and permanently disabled, or retires at normal retirement age, or with the consent of the participating affiliate with which he or she is employed retires at early retirement age under a retirement plan maintained by a participating affiliate, the participant, or the participant's beneficiary or estate in the event of the participant's death, will be vested as of the day on which such death, disability or retirement occurs in the number of performance shares or share units the participant would have received had the participant's 5
employment with the participating affiliate continued to the end of the performance period, but proportionately reduced to reflect the shorter period of employment. The balance of performance shares or share units awarded to the participant for such performance period shall be forfeited to the Corporation as of the last day of the performance period. In the event of the death of the participant before the end of a performance period, the Committee may elect to advance the distribution date. (g) Unless the Committee provides otherwise, if a participant should terminate employment with the participating affiliates before the end of a performance period for a reason other than death, total and permanent disability, or retirement, all performance shares or share units awarded to the participant for which the applicable performance period has not ended shall automatically be forfeited to the Corporation as of the date of termination of employment. (h) Except as otherwise provided for in Section 8(f), distribution of vested performance shares shall be made as soon as practicable after the last day of the applicable performance period in the form of full shares of company stock, with fractional shares, if any, being distributed in cash, and distribution of vested share units shall be made on the same date to the participant entitled thereto in cash, or in shares of company stock if the Committee shall so determine. SECTION 9 - RESTRICTED AWARDS AND PERIODS (a) Participants eligible to receive awards of company stock or share units under this Section 9 shall be selected by the Committee from among the officers and employees of the Corporation and its participating affiliates and shall exclude, except by special Committee action, any of the more senior officers selected for participation in the Plan under Section 8. (b) Each year, the Committee shall establish one (1) or more award periods for the shares of company stock to be awarded to those participants selected by the Committee for such awards under this Section 9 during that year. At the beginning of an award period, the Committee shall make such award or awards of shares of company stock and/or share units to each selected participant as it determines. Each award period must extend for at least twelve (12) months after the date of the award. (c) If a participant has received an award pursuant to the provisions of Section 9(b) of the Plan and is employed by a participating affiliate at the end of the award period, the participant shall be fully vested, at the end of the award period, in the shares of company stock or share units awarded to the participant for that award period. (d) Unless the Committee provides otherwise, in the event that before the end of an award period a participant dies, becomes totally and permanently disabled, or retires at normal retirement age, or with the consent of the participating affiliate with which he or she is employed retires at early retirement age under a retirement plan maintained by a participating affiliate, the participant, or the participant's beneficiary or estate in the event of the participant's death, will be vested, as of the day on which such death, disability or retirement occurs, in the number of shares of company stock or share units the participant would have received had the participant's employment with the 6
participating affiliate continued to the end of the award period, but proportionately reduced to reflect the shorter period of employment. The balance of the shares of company stock or share units awarded to the participant shall be forfeited to the Corporation as of the last day of the award period. The Committee may provide in such cases for accelerated distribution of awards made pursuant to the provisions of this Section 9. (e) Unless the Committee provides otherwise, if a participant should terminate employment with a participating affiliate before the end of an award period for a reason other than death, total and permanent disability, or retirement, all shares of company stock or share units awarded to the participant for which the applicable award period has not ended shall automatically be forfeited to the Corporation as of the date of his or her termination of employment. (f) Except as otherwise provided for in Section 9(d), distribution of vested awards of company stock shall be made as soon as practicable after the last day of the applicable award period in the form of full shares of company stock, with fractional shares, if any, being awarded in cash, and distribution of vested share units shall be made on the same date to the participant entitled thereto in cash, or in shares of company stock if the Committee shall so determine. SECTION 10 - GRANTS OF OPTIONS AND RIGHTS (a) Participants eligible to receive grants of options and/or rights under this Section 10 shall be selected by the Committee from among the officers and employees of the Corporation and its participating affiliates and from former officers and employees who have a consulting arrangement with the Corporation, and may include officers selected for participation under Section 8 or officers and employees selected for participation under Section 9 of the Plan. The Committee may grant more than one option or right to any eligible current or former officer or employee; but no more than five-tenths of one percent (0.5%) of the average of the aggregate shares of company stock outstanding on the first day of January of each of the preceding five years shall be granted subject to option and/or right during each rolling five-year period to any individual current or former officer or employee. (b) The Committee shall determine the eligible participants to whom, and the time or times at which, options and rights will be granted, the number of shares to be subject to each option, the duration of each option or right, the time or times within which the option or right may be exercised, the cancellation of the option or right (with the consent of the holder thereof) and the other conditions of the grant of the option or right. The provisions and conditions of the grants of options and rights need not be the same with respect to each optionee or with respect to each option or each right. (c) Except as otherwise specifically provided herein, options granted pursuant to the Plan shall be subject to the following terms and conditions: (i) Option Price. At the time the Committee approves the grant, the Committee shall determine the option price that shall be not less than one hundred percent (100%) of the market value of the company stock on the date of Committee approval of the grant. 7
(ii) Payment. The option price shall be paid in full at the time of exercise. No shares shall be issued until full payment has been received therefor. Payment may be in cash or, with the prior approval of and upon the conditions established by the Committee, by delivery of shares of company stock owned by the optionee; provided, however, that company stock acquired by the optionee through the exercise of an incentive stock option may not be used for payment prior to the expiration of the holding periods prescribed in Section 422(a)(1) of the Code. If payment is made by the delivery of shares of company stock, the value of the shares on the date of exercise shall be the market value on such day. (iii) Duration of Options. The duration of options shall be determined by the Committee, but in no event shall the maximum duration of an incentive stock option exceed ten (10) years from the date of its grant. (iv) Restoration Options. The Committee may provide that an option include the right to receive a restoration option. An option that provides for the grant of a restoration option shall entitle the participant, upon exercise of the option prior to retirement of the participant and payment of the option price in shares of company stock that have been owned by the participant for not less than six months prior to the date of exercise, to receive a restoration option. In addition to any other terms and conditions the Committee deems appropriate, the restoration option shall be subject to the following terms: the number of shares shall not exceed the number of whole shares delivered in payment of the original option, the date of grant will be the date of the exercise of the original option, the exercise price shall not be less than 100% of the market value of the company stock on the date of the grant of the restoration option, the option may not be exercised for at least six months after grant, the option term will not extend beyond the term of the original option, and the restoration option shall be a non-qualified option. (v) Other Terms and Conditions. Options may contain such other provisions, not inconsistent with the provisions of the Plan, as the Committee shall determine to be appropriate from time to time; provided, however, that no option shall be exercisable in whole or in part for a period of twelve (12) months from the date on which the option is granted. Options shall be exercisable in full or in such cumulative installments as shall be determined by the Committee on the grant of the option. If an option shall be exercisable in installments, the Committee may, in its discretion, provide for other events in which all installments shall become immediately exercisable if any installment be presently exercisable. (vi) Incentive Stock Options. The Committee, with respect to each grant of an option to an optionee, shall determine whether such option shall be an incentive stock option, and, upon determining that an option shall be an incentive stock option, shall designate it as such in the written instrument evidencing such option. If the written instrument evidencing an option does not contain a designation that it is an incentive stock option, it shall contain a designation that it is a non-qualified option. The Committee may not grant a participant incentive stock options in the aggregate that are 8
first exercisable during any one calendar year with respect to company stock the aggregate market value of which exceeds $100,000, taking into account all stock option plans of the Corporation and any parent or subsidiary entities. (d) The Committee may grant a right to an optionee of any option granted under the Plan with respect to some or all of the company stocked covered by such option. A right may be granted either at the time of grant of the option or at any time thereafter during its term. Each right shall be exercisable only if and to the extent that the related option is then exercisable; provided, no right may be exercised until a date at least six (6) months subsequent to the date of grant of the right. Upon the exercise of a right, the related option will cease to be exercisable to the extent of the company stock with respect to which such right is exercised, but shall be considered to have been exercised to that extent for purposes of determining the number of shares available for the grant of further awards and/or options pursuant to the Plan. Upon the exercise or termination of an option, the right with respect to such option shall terminate to the extent of the shares of company stock with respect to which the option was exercised or terminated. (e) For purposes of this Section 10, the word "increment" means with respect to the exercise of any right associated with an option an amount equal to the product computed by multiplying (i) the excess of (A) the market value on the date such right is exercised over (B) the market value on the date the related option was granted by (ii) the number of shares of company stock with respect to which such right is being exercised. (f) Subject to the approval of the Committee, an optionee upon the exercise of a right may elect to receive either: (i) a number of shares of company stock equal to the quotient computed by dividing the increment by the market value on the date of exercise of the right, provided, however, that cash will be paid in lieu of any fractional share and that the total number of shares of company stock will not exceed the total number of shares subject to the related option, or (ii) an amount in cash equal to the increment, or (iii) a combination of cash in the amount specified by the optionee, and the number of shares of company stock calculated as provided in clause (i) of this Paragraph (f), after reducing the increment that was utilized by such cash amount, plus cash in lieu of any fractional share. (g) Notwithstanding the provisions of Paragraph (f) of this Section 10, the Committee may require that a cash payment election may be made only in the period beginning on the third business day following the date of release for publication of the quarterly and annual summary statements of earnings of the Corporation and ending on the twelfth business day following such date. Such restriction will be imposed on an optionee if it is required under the Exchange Act. (h) In the event that the employment of an optionee to whom an incentive stock option has been granted under the Plan shall be terminated (except as set forth below) such option may be exercised, to the extent that the option was exercisable on the date of termination of employment, only until the earlier of three (3) months after such termination or the original expiration date of the option; provided, however, that any option held by an optionee whose employment shall be terminated either (i) for cause or (ii) voluntarily by the optionee and without the consent of the 9
participating affiliate by which the optionee was employed (which consent shall be assumed in the case of retirement at normal retirement age but not in the case of early retirement) shall, to the extent not theretofore exercised, forthwith terminate. If an optionee to whom an incentive stock option has been granted under the Plan shall become disabled while employed and such disability results in the termination of employment, such option may be exercised, to the extent that the option was exercisable on the date of termination of employment, by either the disabled optionee or such optionee's legal representative, as the case may be, and the right to exercise the option shall terminate upon the earlier of the expiration of twelve (12) months from the date of such termination of employment or the original expiration date of the option. If an optionee has been granted an option exercisable in installments, then, notwithstanding the terms specifying the installments in which the option shall be exercisable, upon the death or disability of the optionee at any time subsequent to the expiration of the first year of the term of the option, the option shall be exercisable within the time period set forth above as to all shares of company stock remaining subject to the option. For the purposes of this Section 10, the term "option" shall include any right related to the option and the term "disabled" shall have the meaning contained within Section 22 (e) (3) of the Code. (i) In the event that the employment of an optionee to whom an option other than an incentive stock option has been granted under the Plan shall be terminated (except as set forth below), such option may be exercised, to the extent that the option was exercisable on the date of termination of employment, only until the earlier of such date after termination as provided by the Committee on the grant of the option or the original expiration date of the option; provided, however, that any option held by an optionee whose employment shall be terminated either (i) for cause or (ii) voluntarily by the optionee and without the consent of the participating affiliate by which the optionee was employed (which consent shall be assumed in the case of retirement at normal retirement age but not in the case of early retirement) shall, to the extent not theretofore exercised, forthwith terminate. If an optionee to whom an option other than an incentive stock option has been granted under the Plan shall become disabled while employed or within six (6) months after the termination of such employment (other than termination for cause or voluntarily by the optionee and without the consent of the participating affiliate by which the optionee was employed), such option may be exercised, to the extent that the option was exercisable on the date of termination of employment, by either the disabled optionee or such optionee's legal representative, as the case may be, and the right to exercise the option shall terminate upon the earlier of such date following termination of employment as provided by the Committee on the grant of the option or the original expiration date of the option. If an optionee to whom an option other than an incentive stock option has been granted under the Plan shall die while employed or within six (6) months after the termination of such employment (other than termination for cause or voluntarily by the optionee and without the consent of the participating affiliate by which the optionee was employed), such option may be exercised, to the extent that the option was exercisable on the date of termination of employment, by either the executor, administrator or personal representative of the optionee's estate or a transferee of the option under Section 7(a) or a beneficiary designated under Section 11(b), as the case may be, and the right to exercise the option shall terminate upon the earlier of such date following termination of employment as provided by the Committee on the grant of the option or the original expiration date of the option. If an optionee has been granted an option exercisable in installments, then, notwithstanding the terms specifying the installments in which the option shall be exercisable, upon the disability or death of the 10
optionee at any time subsequent to the expiration of the first year of the term of the option, the option shall be exercisable within the time periods set forth above as to all shares of company stock remaining subject to the option. (j) An optionee or a transferee of an option pursuant to Section 7(a) shall have no rights as a shareholder with respect to any company stock the subject of either an unexercised or exercised option or right until the optionee or transferee shall have become the holder of record of such stock, and no adjustments shall be made for dividends in cash or other property or other distributions or rights in respect of such stock for which the record date is prior to the date on which the optionee or transferee shall have in fact become the holder of record of the company stock acquired pursuant to the option or right. SECTION 11 - GENERAL (a) If, in connection with the payment of any award hereunder in shares of company stock or the exercise of any option or right hereunder, it is necessary or desirable, to comply with any law or regulation of any governmental authority relating to the issuance or sale of securities, that the participant receiving such shares shall agree that the participant will take the shares for investment and not with any present intention to resell the same and that the participant will dispose of such shares only in compliance with such laws and regulations, the participant shall, upon the request of the Committee, execute and deliver to the Committee an agreement to such effect satisfactory to the Committee. (b) If a participant dies prior to the receipt in full of any award under the Plan to which the participant is entitled and/or prior to the exercise in full of any option or right granted to the participant, the award or grant shall be distributed to the participant's designated beneficiary or, in the absence of a beneficiary designation, to the participant's estate. The designation of a beneficiary shall be made in writing on a form prescribed by and filed with the Secretary of the Committee. (c) Neither the establishment of the Plan nor any provisions of the Plan or modification thereof shall be held or construed as giving any participant in the Plan the right to be retained in the service of any participating affiliate and each participating affiliate expressly reserves its right to discharge any such participant whenever the interests of such participating affiliate may so require. (d) A forfeiture of shares of company stock (including performance shares) pursuant to Sections 8(e), (f) or (g) or 9(d) or (e) of the Plan shall effect a complete forfeiture of voting rights, dividend rights and all other rights relating to the award or grant as of the date of forfeiture. (e) Each distribution of company stock under this Plan shall be made subject to such federal, state and local tax withholding requirements as apply on the distribution date. For this purpose, the Committee may provide for the withholding of shares of company stock or allow a participant to tender back to the Corporation shares of company stock received in such distribution. (f) Notwithstanding any other provisions in the Plan, in the event of a Change in Control (as 11
hereinafter defined) each participant shall be fully vested in the number of shares of company stock (including performance shares) or share units awarded to such participant for all award periods and/or performance periods that, upon such event, have not yet ended, and all options and rights then outstanding shall become immediately exercisable. Distribution of all shares of company stock, and all cash with respect to which rights have become vested, or due because of the exercise of options or rights, shall be made as soon as practicable within sixty (60) days after the date of the Change in Control, as if, in the case of awards under Section 8 and Section 9, the applicable award period or periods and/or performance period or periods had ended on such date. In addition, the Corporation shall reimburse a participant for legal fees and expenses incurred by such participant in successfully seeking to obtain or enforce any right to distribution under this Section 11(f) and in the event that it shall be determined that such participant is entitled to a cash distribution hereunder, such participant shall also be entitled to interest thereon payable to such participant in an amount equivalent to the prime rate of interest of NBD Bank, N.A., from time to time during the period from the date such distribution should have been made to the date it is made. For purposes of this Plan, a Change in Control shall occur if (i) any "person" or "group" within the meaning of Section 13(d) and 14(d)(2) of the Exchange Act becomes the "beneficial owner" as defined in Rule 13d-3 under the Exchange Act of more than thirty percent (30%) of the then outstanding voting securities of the Corporation otherwise than through a transaction or transactions arranged by or consummated with the prior approval of the Corporation's Board of Directors; or (ii) during any period of twenty- four (24) consecutive months (not including any period prior to the adoption of this Plan) Present Directors and/or New Directors cease for any reason to constitute a majority of the Board. For purposes of subsection (ii) of the preceding sentence, "Present Directors" shall mean individuals who at the beginning of such consecutive twenty-four (24) month period were members of the Corporation's Board and "New Directors" shall mean any director of the Corporation whose election by the Corporation's Board or whose nomination for election by the Corporation's shareholders was approved by a vote of at least two- thirds the Corporation's Directors then still in office who were Present Directors or New Directors. Notwithstanding any other provisions of the Plan, the provisions of this Section 11(f) may not be amended after the date a Change in Control occurs without the written consent of a majority in number of participants. SECTION 12 - AMENDMENT, SUSPENSION AND TERMINATION The Board of Directors of the Corporation reserves the right at any time to amend, suspend, or terminate the Plan; provided, however, no such amendment, suspension or termination shall adversely affect any award or grant then in effect unless the prior approval of the participant so affected is obtained. No amendment of the Plan shall, without approval of the shareholders of the Corporation, (a) increase the aggregate number of shares of company stock (including performance shares) that are reserved for award and/or grant under the Plan (except as provided in Section 6), (b) change the group of eligible employees under the Plan, (c) change the manner of determining the option price or the amount payable upon exercise of a right, or (d) increase the maximum duration of an option. 12
SECTION 13 - GOVERNING LAW The Plan and all determinations made and action taken pursuant thereto shall be governed by the laws of the State of Michigan and construed in accordance therewith. 13
NBD BANCORP, INC. PERFORMANCE INCENTIVE PLAN Appendix A The following provisions have been disclosed to and approved by the shareholders of the Corporation at the annual meeting held on May 16, 1994: The performance-based long-term incentive criteria for the chief executive officer and the next four highest paid executive officers (the "class of employees" covered) provide for annual grants of performance shares, starting in 1994, that will be earned out 0-100% at the end of a four-year performance period based on NBD's average return on equity ("ROE") in comparison to average ROE during the period at peer banking institutions selected by the Committee (the "performance measure"). TARGET AND MAXIMUM AWARDS. Each participating officer is assigned a target award at the start of each performance period stated as a percent of salary. Under the criteria, the Committee is able to grant a maximum target award of 100% of the salary stated in the Corporation's proxy statement for the first year of the performance period. The target award is multiplied by the participant's salary and divided by the fair market value of a share of the Corporation's Common Stock at the start of each performance period to determine a target number of performance shares. If average ROE during the performance period is at or above the goal, the target number of performance shares will be earned. The target number of shares is also the maximum number of shares (the "maximum award"). If ROE performance is below the goal, individual awards will be less than the target, down to an ROE threshold below which all performance shares will be forfeited. DEFINITIONS. For purposes of determining awards, "Return on Equity" is calculated by dividing "Net Income" by "Stockholders' Equity" for the year. "Net Income" is defined as consolidated net income as reported in the Corporation's audited financial statements for the year, before any extraordinary, unusual or non-recurring items of gain or loss that are identified and quantified separately in the audited financial statements, net of tax effect, and after any preferred dividends. The Compensation Committee retains the right in its discretion to reduce Net Income for purposes of the performance-based long-term incentive criteria if it believes that such Net Income produces a level of payout above the level warranted by management performance. It may not, however, increase Net Income or individual awards above the level produced by the calculations. "Stockholders' Equity" is the Corporation's common stockholders' equity on its consolidated balance sheet at the end of the preceding year. TERM OF CRITERIA. The term of the performance-based long-term incentive criteria is five years, 1994 through 1998, unless sooner terminated or amended by the Board. Any amendment that would materially change the "class of employees" covered, the "performance measure," or the "maximum award" payable is subject to stockholder approval.
EXHIBIT 10.30 REVISED AND RESTATED BANC ONE CORPORATION 1989 STOCK INCENTIVE PLAN SECTION 1. Establishment, Purpose, and Effective Date of Plan 1.1 Establishment. BANC ONE CORPORATION, a Delaware corporation, (the "Corporation") hereby establishes the "1989 STOCK INCENTIVE PLAN" (the "Plan")for key employees of the Corporation and its subsidiaries and for directors of the Corporation who are not employees of the Corporation or any of its subsidiaries. The Plan permits the grant of Director Stock Options to such directors and the grant of Stock-Options, Stock Appreciation Rights, Restricted Stock Awards, Performance Shares, and Performance Awards to such employees. 1.2 Purpose. The purpose of the Plan is to advance the interests of the Corporation by encouraging and providing for the acquisition of an equity interest in the Corporation by directors of the Corporation and key employees of the Corporation and its subsidiaries and by enabling the Corporation to attract and retain the services of such directors and key employees upon whose judgment, interest, and special effort the successful conduct of its operations is largely dependent. 1.3 Effective Date. The Plan shall become effective as of January 18, 1989, the date of its adoption by the Board of Directors of the Corporation, subject to ratification by the shareholders of the Corporation within twelve months of the adoption date. SECTION 2. Definitions 2.1 Definitions. Whenever used herein, the following terms shall have their respective meanings set forth below: (a) "Award" means any Option, Stock Appreciation Right, Restricted Stock Awards, Performance Share, or Performance Award. (b) "Board" means the Board of Directors of the Corporation. (c) "Code" means the Internal Revenue Code of 1986, as amended. (d) "Committee" means the Committee of the Corporation's Board of Directors which shall consist of two or more non-employee directors, within the meaning set forth in Rule 16b-3 of the Securities Exchange Act of 1934, appointed by the Board. (e) "Corporation" means BANC ONE CORPORATION, a bank holding company under the Bank Holding Company Act of 1956 headquartered in Columbus, Ohio. (f) "Disability" means disability as determined by the Committee. (g) "Director Stock Option" means an Option granted to an Eligible Director. Each Director Stock Option shall be a nonqualified stock option whose grant is not intended to fall under the provisions of Section 422A of the Code. (h) "Eligible Director" means any statutory director of the Corporation who is not an employee of the Corporation or any of its subsidiaries. I-1
(i) "Fair Market Value" means the closing price of the Stock as reported by the New York Stock Exchange on a particular date. In the event that there are no Stock transactions on such date, the Fair Market Value shall be determined as of the immediately preceding date on which there were Stock transactions. (j) "Option" means the right to purchase Stock at a stated price for a specified period of time. For purposes of the Plan an Option, other than a Director Stock Option, may be either (i) an incentive stock option within the meaning of Section 422A of the Code or (ii) a nonqualified stock option whose grant is intended not to fall under the provisions of Section 422A. (k) "Option Agreement" means an agreement entered into between the Corporation and an employee or an Eligible Director in the form prescribed by the Committee. (l) "Option Price" means the price at which each share of Stock subject to an Option may be purchased, determined in accordance with Section 8.4 herein. (m) "Participant" means any individual, other than an Eligible Director, designated by the Committee to participate in the Plan pursuant to Section 3.1 herein. (n) "Period of Restriction" means the period during which the transfer of shares of Restricted Stock and/or Performance Shares is restricted pursuant to Section 10 and/or Section 11 of the Plan. (o) "Performance Awards" means awards of cash granted to a Participant pursuant to Section 12 of the Plan. (p) "Performance Objective" shall mean the performance measure(s) and the achievement goals of the Corporation or one or more of its subsidiaries set by the Committee. (q) "Performance Period" shall mean two or more successive fiscal years of the Corporation with respect to which a Performance Share or Performance Award may be earned pursuant to this Plan. Performance Periods shall begin with the first day of the fiscal year in which a Performance Share or Performance Award is granted. The length of a Performance Period shall be at the discretion of the Committee. For each Performance Share and Performance Award, no more than one Performance Period shall begin in any one fiscal year of the Corporation. (r) "Performance Shares" means Stock granted to a Participant pursuant to Section 11 of the Plan. Each Performance Share shall be the equivalent of one share of Stock. (s) "Restricted Stock" means Stock granted to a Participant pursuant to Section 10 of the Plan. (t) "Restricted Stock Agreement" means an agreement entered into between the Corporation and the Employee in the form prescribed by the Committee. (u) "Retirement," "Normal Retirement," and "Early Retirement" means termination of employment as defined in the BANC ONE CORPORATION Retirement Plan. (v) "Stock" means the common stock of the Corporation, without par value. (w) "Stock Appreciation Right" and "SAR" means the right to receive a cash payment from the Corporation equal to the excess of the Fair Market Value of a share of Stock at the date of exercise over a specified price fixed by the Committee which shall not be less than 100% of the Fair Market Value of the Stock on the date of grant. In the case of a Stock Appreciation Right which is granted in conjunction with an Option, the specified price shall be the Option exercise price. I-2
2.2 Gender and Number. Except when otherwise indicated by the context, words in the masculine gender when used in the Plan shall include the feminine gender, the singular shall include the plural, and the plural shall include the singular. SECTION 3. Eligibility and Participation 3.1 Eligibility and Participation. Participants in the Plan shall be selected by the Committee from among those employees of the Corporation and its subsidiaries who are recommended for participation by the Chief Executive Officer of the Corporation and who, in the opinion of the Committee, are in a position to contribute materially to the Corporation's continued growth, development, and long-term financial success. Persons serving on the Committee shall not be eligible to be a Participant. 3.2 Eligible Directors. Eligible Directors are entitled to participate in the Plan solely with respect to the grant of Director Stock Options and may not receive any other Award under the Plan. The selection of Eligible Directors is not subject to the discretion of the Committee. Persons serving on the Committee who are Eligible Directors may receive grants of Director Stock Options. SECTION 4. Administration 4.1 Administration. The Committee shall be responsible for the administration of the Plan. The Committee, by majority action thereof, is authorized to interpret the Plan, to prescribe, amend, and rescind rules and regulations relating to the Plan, to provide for conditions and assurances deemed necessary or advisable to protect the interests of the Corporation, and to make all other determinations necessary or advisable for the administration of the Plan, but only to the extent not contrary to the explicit provisions of the Plan. Determinations, interpretations, or other actions made or taken by the Committee pursuant to the provisions of the Plan shall be final and binding and conclusive for all purposes and upon all persons whomsoever. SECTION 5. Stock Subject to Plan 5.1 Number. The total number of shares of Stock subject to issuance under the Plan may not exceed six million three hundred thousand (6,300,000) subject to adjustment upon occurrence of any of the events indicated in Subsection 5.3. Of this total number, up to six million (6,000,000) shares of Stock may be granted in Restricted Stock or in common stock as a payout medium to Participants under the Plan and up to three hundred thousand (300,000) shares may be issued pursuant to the exercise of Director Stock Options. The shares to be delivered under the Plan may consist, in whole or in part, of authorized but unissued Stock or issued stock reacquired and held as treasury Stock not reserved for any other purpose. 5.2 Unused Stock. In the event any shares of Stock that are subject to an Option which, for any reason, expires or is terminated unexercised as to such shares, or any shares of Stock subject to a Restricted Stock or Performance Share grant made under the Plan are reacquired by the Corporation pursuant to the Plan, such shares again shall become available for issuance under the Plan except as provided in Section 9.4. 5.3 Adjustment in Capitalization. In the event that subsequent to the date of adoption of the Plan by the Board the shares of Stock should as a result of a stock split, stock dividend, combination or exchange of shares, exchange for other securities, reclassification, reorganization, redesignation, merger, consolidation, recapitalization or other such change, be increased or decreased or changed into or exchanged for a different number or kind of shares of Stock or other securities of the Corporation or of another corporation, then (a) there shall automatically be substituted for each share of Stock subject to an unexercised Option (in whole or in part) granted under the Plan and each share of Stock available for additional grants of Options under the Plan the number and kind of shares of Stock or other securities into which each outstanding share of Stock shall be changed or for which each such shares shall be exchanged, (b) the Option Price shall I-3
be increased or decreased proportionately so that the aggregate purchase price for the securities subject to the Option shall remain the same as immediately prior to such event and (c) the Board shall make such other adjustments to the securities subject to Options and the provisions of the Plan and Option Agreements as may be appropriate and equitable. Any such adjustment may provide for the elimination of fractional shares. In such event, the Committee also shall have discretion to make appropriate adjustments in the number and type of shares subject to Restricted and Performance Share grants then outstanding under the Plan pursuant to the terms of such grants or otherwise. SECTION 6. Stock Appreciation Rights Subject to Plan 6.1 Unexercised Rights. In the event any Stock Appreciation Rights expire unexercised, such Stock Appreciation Rights again shall become available for issuance under the Plan. 6.2 Adjustment in Capitalization. In the event of any change in the outstanding shares of Stock that occurs after ratification of the Plan by the shareholders of the Corporation by reason of a Stock dividend or split, recapitalization, merger, consolidation, combination, exchange of shares, or other similar corporate change, the Committee shall make appropriate adjustments in the number of outstanding Stock Appreciation Rights and the related grant values. SECTION 7. Duration of Plan The Plan shall remain in effect, subject to the Board's right to earlier terminate the Plan pursuant to Section 16 hereof, until all Stock subject to it shall have been purchased or acquired pursuant to the provisions hereof. Notwithstanding the foregoing, no Option, Stock Appreciation Right, Restricted Stock, Performance Share or Performance Award may be granted under the Plan on or after the tenth (10th) anniversary of the Plan's effective date. SECTION 8. Stock Options 8.1 Grant of Options Other than Director Stock Options. Subject to the provisions of Sections 5 and 7, Options other than Director Stock Options may be granted to Participants at any time and from time to time as shall be determined by the Committee. The Committee shall have complete discretion in determining the number of Options granted to each Participant. The Committee also shall determine, whether an Option is to be an incentive stock option within the meaning of Code Section 422A, or a nonqualified stock option whose grant is intended not to fall within the provisions of Section 422A. However, in no event shall the aggregate Fair Market Value (determined at the date of grant) of the stock for which incentive stock options are first exercisable in a particular calendar year exceed $100,000, computed in accordance with Section 422A(b)(7) of the Code. An incentive stock option shall not be granted to any person who owns, directly or indirectly, Stock possessing more than 10% of the total combined voting power of all classes of Stock of the Corporation. Nothing in this Section 8 shall be deemed to prevent the grant of nonqualified stock options in excess of the maximum established by Section 422A of the Code. 8.2 Grant of Director Stock Options. Subject to the provisions of Sections 5 and 7, Director Stock Options shall be granted to Eligible Directors as provided in this Section 8.2 and the Committee shall have no discretion with respect to any matters set forth in this Section 8.2. (a) Vesting. Each Director Stock Option shall become exercisable on and after the first anniversary of the date of the grant. (b) Number of Shares. Director Stock Options shall be granted as follows: (i) Each Eligible Director on the effective date of the Plan shall automatically be granted a Director Stock Option for 3,000 shares of Stock. I-4
(ii) Each other person who is elected or appointed to serve as a director of the Corporation after the effective date of the Plan and who is an Eligible Director shall, upon his initial appointment or election as an Eligible Director, automatically be granted a Director Stock Option for 3,000 shares of Stock; (iii) Commencing immediately after the adjournment of the Corporation's annual meeting of shareholders (an "Annual Meeting") in 1990 and immediately after the adjournment of the Annual Meeting each year thereafter, each Eligible Director who was an Eligible Director immediately preceding such Annual Meeting and who has been elected as a director at such Annual Meeting shall automatically be granted a Director Stock Option for 1,000 shares of Stock if, but only if, the return on common equity of the Corporation as set forth in the Corporation's annual report to shareholders for the immediately preceding fiscal year is equal to or greater than 10%. 8.3 Option Agreement. Each Option shall be evidenced by an Option Agreement that shall specify the type of Option granted, the Option Price, the duration of the Option, the number of shares of Stock to which the Option pertains, and such other provisions as the Committee shall determine. 8.4 Option Price. No Option granted pursuant to the Plan shall have an Option Price that is less than the Fair Market Value of the Stock on the date the Option is granted. 8.5 Duration of Options. Each Option, other than Director Stock Options, shall expire at such time as the Committee shall determine at the time it is granted; provided, however, that no Option, other than incentive stock options within the meaning of Section 422A of the Code, shall be exercisable later than twenty years and one day from the date of its grant and no such incentive stock option shall be exercisable more than ten years and one day from the date of grant. No Director Stock Option may be exercisable later than twenty years and one day from the date of its grant. 8.6 Exercise of Options. Options granted under the Plan other than Director Stock Options shall be exercisable at such times and be subject to such restrictions and conditions as the Committee shall in each instance approve, which need not be the same for all Participants. 8.7 Payment. The Option Price upon exercise of any Option shall be payable to the Corporation in full either (i) in cash or its equivalent, or (ii) by tendering shares of previously acquired Stock having a Fair Market Value at the time of exercise equal to the total Option Price, or (iii) by a combination of (i) and (ii). The proceeds from such a payment shall be added to the general funds of the Corporation and shall be used for general corporate purposes. As soon as practicable after receipt of full payment (including the necessary tax withholding), the Corporation shall deliver to the Participant or the Eligible Director, as the case may be, Stock certificates in an appropriate amount based upon the number of Options exercised, issued in the name of the Participant or the Eligible Director, as the case may be. 8.8 Restrictions on Stock Transferability. The Committee shall impose such restrictions on any shares of Stock acquired pursuant to the exercise of an Option under the Plan as it may deem advisable, including, without limitation, restrictions under applicable Federal securities law, under the requirements of any stock exchange upon which such shares of Stock are then listed and under any blue sky or state securities laws applicable to such shares. 8.9 Termination of Employment. If the employment of a Participant terminates, other than pursuant to paragraphs (a) through (d) of this Section, all non-vested awards shall be canceled immediately, unless the Award Agreement provides otherwise. Vested awards shall remain subject to the terms of the Award Agreement, except to the extent modified by the provisions of paragraphs (a) through (d) of this Section. (a) Retirement Under the Retirement Plan. When a Participant's employment terminates as a result of Retirement with management approval in accordance with the terms of the BANC ONE CORPORATION Retirement Plan, the Committee (in the form of an amended Award Agreement or otherwise) may permit awards to continue in effect beyond the date of Retirement in accordance with the applicable Award Agreement and the exercisability and vesting of any award may be accelerated. I-5
(b) Resignation in the Best Interest of the Corporation. When a Participant resigns from the Corporation and, in the judgment of the chief executive officer or other senior officer designated by the Committee, the acceleration and/or continuation of outstanding awards would be in the best interest of the Corporation, the Committee may (i) authorize, where appropriate, the acceleration and/or continuation of all or any part of awards granted prior to such termination, and (ii) permit the exercise, vesting and payment of such awards for such period as may be set forth in the applicable Award Agreement, subject to earlier cancellation pursuant to Section 8.10 or at such time as the Committee shall deem the continuation of all or any of the Participant's awards to be not in the Corporation's best interest. (c) Death or Disability of a Participant. (i) In the event of a Participant's death, the Participant's estate or beneficiaries shall have a period specified in the Award Agreement within which to receive or exercise any outstanding award held by the Participant under such terms as may be specified in the applicable Award Agreement. (ii) In the event a participant is deemed by the Corporation to be disabled and eligible for benefits pursuant to the terms of the Corporation's Long-Term Disability Plan, any successor plan, or any predecessor plan, awards and rights to any such awards may be paid to or exercised by the Participant, if legally competent, or a committee or other legally designated guardian or representative if the Participant is legally incompetent by virtue of such disability. (iii) After the death or disability of a Participant, the Committee may in its sole discretion at any time (1) terminate restrictions in Award Agreements; (2) accelerate any or all installments and rights; and (3) instruct the Corporation to pay the total of any accelerated payments in a lump sum to the Participant, the Participant's estate, beneficiaries or representative - notwithstanding that, in the absence of such termination of restrictions or acceleration of payments, any or all of the payments due under the awards may ultimately have become payable to other beneficiaries. (iv) In the event of uncertainty as to interpretation of or controversies concerning this paragraph (c) of this Section 8.9, the Committee's determination shall be binding and conclusive. (d) Sale of a Subsidiary. In the event of the sale of a subsidiary, or any portion thereof, the Committee may in its sole discretion at any time (1) terminate restrictions in Award Agreements; (2) accelerate any or all installments and rights; and (3) instruct the Corporation to pay the total of accelerated payments in a lump sum to affected Participants. 8.10 Cancellation and Rescission of Awards. Unless the Award Agreement specifies otherwise, the Committee may cancel any unexpired, unpaid, or deferred awards at any time if the Participant is in violation of or not in compliance with all other applicable provisions of the Plan, or the applicable Award Agreement. 8.11 Termination of Eligible Director Shares. In the event that an Eligible Director ceases to be an Eligible Director for any reason, the rights under any then outstanding Director Stock Option granted pursuant to the Plan which are exercisable as of the date he ceases to be an Eligible Director shall terminate upon the date determined as provided in Section 8.5, above, or three months after such cessation date, whichever first occurs; provided, however, that if he ceases to be an Eligible Director by reason of death, the three-month period shall be extended to the sooner of twelve (12) months and five (5) days or the expiration date of the Director Stock Option. 8.12 Nontransferability of Options. No Option granted under the Plan may be sold, transferred, pledged, assigned, or otherwise alienated or hypothecated, otherwise than by will or by the laws of descent and distribution. All Options granted to a Participant or an Eligible Director under the Plan shall be exercisable during his lifetime only by such Participant or Eligible Director. SECTION 9. Stock Appreciation Rights I-6
9.1 Grant of Stock Appreciation Rights. Subject to the provisions of Sections 6 and 7, Stock Appreciation Rights may be granted to Participants at any time and from time to time as shall be determined by the Committee. An SAR may be granted, in the discretion of the Committee, in any of the following forms: (a) In lieu of Options, (b) In addition to Options, (c) Upon lapse of Options, or (d) Independent of Options. 9.2 Exercise of SARs in Lieu of Options. SARs granted in lieu of Options may be exercised for all or part of the shares of Stock subject to the related Option upon the surrender of the right to exercise an equivalent number of Options. The SAR may be exercised only with respect to the shares of Stock for which its related Option is then exercisable. SARs granted in lieu of Options will lapse in the event and to the extent that the related Option is exercised. 9.3 Exercise of SARs in Addition to Options. SARs granted in addition to Options shall be deemed to be exercised upon the exercise of the related Options. 9.4 Exercise of SARs Upon Lapse of Options. SARs granted upon lapse of Options shall be deemed to have been exercised upon the lapse of the related Options as to the number of shares of Stock subject to the Options. 9.5 Exercise of SARs Independent of Options. SARs granted independent of Options may be exercised upon whatever terms and conditions the Committee, in its sole discretion, imposes upon the SARs. 9.6 Payment of SAR Amount. Upon exercise of the SAR, the holder shall be entitled to receive payment of an amount (subject to Section 9.8 below) determined by multiplying: (a) The difference between the Fair Market Value of a share of Stock at the date of exercise over the price fixed by the Committee at the date of grant, by (b) The number of shares with respect to which the SAR is exercised. 9.7 Form and Timing of Payment. At the discretion of the Committee, payment for SARs may be made in cash or stock, or in a combination thereof. If payment is made in Stock, the value of such Stock shall be the Fair Market Value determined as of the date of exercise. 9.8 Limit on Appreciation. At the time of grant, the Committee may establish, in its sole discretion, a maximum amount per share which will be payable upon exercise of an SAR. 9.9 Rule 16b-3 Requirements. Notwithstanding any other provision of the Plan, the Committee may impose such conditions on exercise of an SAR (including, without limitation, the right of the Committee to limit the time of exercise to specified periods) as may be required to satisfy the requirements of Rule 16b-3 (or any successor rule), under the Securities Exchange Act of 1934. 9.10 Term of SAR. The term of an SAR granted under the Plan shall not exceed ten years and one day. 9.11 Termination of Employment. In the event the employment of a Participant is terminated by reason of Death, Disability, Retirement, or any other reason, any SARs outstanding shall terminate in the same manner as specified for Options under Sections 8.9 and 8.10 herein. I-7
9.12 Nontransferability of SARs. No SAR granted under the Plan may be sold, transferred, pledged, assigned, or otherwise alienated or hypothecated, otherwise than by will or by the laws of descent and distribution. Further, all SARs granted to a Participant under the Plan shall be exercisable during his lifetime only by such Participant. SECTION 10. Restricted Stock Awards. 10.1 Grant of Restricted Stock. Subject to the provisions of Sections 5 and 7, the Committee, at any time and from time to time, may award shares of Restricted Stock under the Plan to such Participants and in such amounts as it shall determine. Each Restricted Stock Award shall be evidenced by a Restricted Stock Agreement that shall specify the Period or Periods of Restriction, the number of Restricted Stock shares awarded, and such other provisions as the Committee shall determine. 10.2 Transferability. Except as provided in this Section 10, the shares of Restricted Stock awarded hereunder may not be sold, transferred, pledged, assigned, or otherwise alienated or hypothecated for such period of time as shall be determined by the Committee and shall be specified in the Restricted Stock Agreement, or upon earlier satisfaction of other conditions as specified by the Committee in its sole discretion and set forth in the Restricted Stock Agreement. 10.3 Other Restrictions. The Committee shall impose such other restrictions on any shares of Restricted Stock awarded pursuant to the Plan as it may deem advisable including, without limitation, restrictions under applicable federal or state securities or tax laws, and may legend the certificates representing Restricted Stock to give appropriate notice of such restrictions. 10.4 Certificate Legend. In addition to any legends placed on certificates pursuant to Section 10.3 hereof, each certificate representing shares of Restricted Stock granted pursuant to the Plan shall bear a legend which is comparable to the following: "The sale or other transfer of this certificate or the shares of stock represented by this certificate, whether voluntary, involuntary, or by operation of law, is subject to certain restrictions on transfer and other terms and conditions set forth in the BANC ONE CORPORATION 1989 Stock Incentive Plan and a Restricted Stock Agreement dated , 19 . A copy of the Plan and such Restricted Stock Agreement may be obtained from the Secretary of BANC ONE CORPORATION, 100 East Broad Street, Columbus, Ohio 43271-0261." 10.5 Removal of Restrictions. Except as otherwise provided in this Section 10, shares of Restricted Stock covered by each Restricted Stock Award made under the Plan shall become freely transferable by the Participant after the last day of the Period of Restriction. Once the shares are released from the restrictions, the Participant shall be entitled to have the legend required by Section 10.4 removed from his Stock certificates. 10.6 Voting Rights. During the Period of Restriction, Participants holding shares of Restricted Stock awarded hereunder may exercise full voting rights with respect to those shares. 10.7 Dividends and Other Distributions. During the Period of Restriction, Participants holding shares of Restricted Stock awarded hereunder shall be entitled to receive all dividends and other distributions paid with respect to those shares while they are so held. If any such dividends or distributions are paid in shares of Stock, the shares shall be subject to the same restrictions on transferability as the shares of Restricted Stock with respect to which they were paid. 10.8 Termination of Employment. If the employment of a Participant terminates other than pursuant to paragraphs (a) through (d) of this Section, all non-vested awards shall be canceled immediately, unless the Award Agreement provides otherwise. Vested awards shall remain subject to the terms of the Award Agreement, except to the extent modified by the provisions of paragraphs (a) through (d) of this Section. I-8
(a) Retirement Under the Retirement Plan. When a participant's employment terminates as a result of Retirement with management approval in accordance with the terms of the BANC ONE CORPORATION Retirement Plan, the Committee (in the form of an amended Award Agreement or otherwise) may permit awards to continue in effect beyond the date of Retirement in accordance with the applicable Award Agreement and the exercisability and vesting of any Award may be accelerated. (b) Resignation in the Best Interest of the Corporation. When a Participant resigns from the Corporation and, in the judgment of the chief executive officer or other senior officer designated by the Committee, the acceleration and/or continuation of outstanding awards would be in the best interest of the Corporation, the Committee may (i) authorize, where appropriate, the acceleration and/or continuation of all or any part of awards granted prior to such termination, and (ii) permit the exercise, vesting and payment of such awards for such period as may be set forth in the applicable Award Agreement, subject to earlier cancelation pursuant to Section 10.9 or at such time as the Committee shall deem the continuation of all or any of the Participant's awards to be not in the Corporation's best interest. (c) Death or Disability of a Participant. (i) In the event of a Participant's death, the Participant's estate or beneficiaries shall have a period specified in the Award Agreement within which to receive or exercise any outstanding award held by the Participant under such terms as may be specified in the applicable Award Agreement. (ii) In the event a participant is deemed by the Corporation to be disabled and eligible for benefits pursuant to the terms of the Corporation's Long-Term Disability Plan, any successor plan, or any predecessor plan, awards and rights to any such awards may be paid to or exercised by the Participant, if legally competent, or a committee or other legally designated guardian or representative if the Participant is legally incompetent by virtue of such disability. (iii) After the death or disability of a Participant, the Committee may in its sole discretion at any time (1) terminate restrictions in Award Agreements; (2) accelerate any or all installments and rights; and (3) instruct the Corporation to pay the total of any accelerated payments in a lump sum to the Participant, the Participant's estate, beneficiaries or representative - notwithstanding that, in the absence of such termination of restrictions or acceleration of payments, any or all of the payments due under the awards may ultimately have become payable to other beneficiaries. (iv) In the event of uncertainty as to interpretation of or controversies concerning this paragraph (c) of this Section 10.8, the Committee's determination shall be binding and conclusive. (d) Sale of a Subsidiary. In the event of the sale of a subsidiary, or any portion thereof, the Committee may in its sole discretion at any time (1) terminate restrictions in Award Agreements; (2) accelerate any or all installments and rights; and (3) instruct the Corporation to pay the total of accelerated payments in a lump sum to affected Participants. 10.9 Cancellation and Rescission of Awards. Unless the Award Agreement specifies otherwise, the Committee may cancel any unexpired, unpaid, or deferred awards at any time if the Participant is in violation of or not in compliance with all other applicable provisions of the Plan, or the applicable Award Agreement. SECTION 11. Performance Shares 11.1 Grant of Performance Shares. Subject to the provisions of Sections 5 and 7, the Committee, at any time and from time to time, may grant Performance Shares to such Participants and in such amounts as it shall determine. Each grant of Performance Shares shall be in writing. I-9
11.2 Performance Period. The period over which Performance Shares may be earned shall begin on the first day of the fiscal year in which a grant occurs. The length of the Performance Period for each grant shall be determined by the Committee, in its sole discretion, but shall not be less than two years. 11.3 Performance Measurement. At the beginning of each Performance Period, Performance Objectives shall be established by the Chief Executive Officer of the Corporation subject to Committee approval. The degree of attainment of such Performance Objectives shall determine the number of the Performance Shares payable at the end of the Performance Period, in accordance with a schedule established by the Chief Executive Officer and approved by the Committee at the beginning of the Performance Period. The Committee may adjust the Performance Objectives during the Performance Period if it is determined that changes in business conditions have materially and unduly influenced the Corporation's ability to meet the Performance Objectives. 11.4 Payment of Awards. All payments pursuant to Performance Share grants shall be made as soon as practicable following the end of the applicable Performance Period based upon the degree of attainment of the Performance Objectives. Payments shall be made in Stock. The Committee shall review all calculations of actual Performance Objective accomplishments and shall make any adjustments in the computations to recognize material extraordinary or nonrecurring items if, in the judgment of the Committee, the effect of such adjustments is equitable and in conformity with the purposes of the Plan. 11.5 Termination of Employment Due to Retirement. In the event that a Participant terminates his employment with the Corporation because of Normal Retirement during the Performance Period, the Participant shall be entitled to a prorated award of Performance Shares as of the most recently completed full fiscal year of the Performance Period. Payments of Performance Shares determined in this manner shall be multiplied by a fraction, the numerator of which is the number of full months which have elapsed since the commencement of the Performance Period, and the denominator of which is the number of full months in the particular Performance Period. Payment of Performance Shares in this case shall be made as soon as practicable following the end of the fiscal year of termination. In the event that a Participant terminates his employment with the Corporation because of Early Retirement, any Performance Shares outstanding at the date of such Early Retirement automatically shall be forfeited; provided, however, that the Committee may, in its sole discretion, determine a prorated value for the Participant's then outstanding Performance Shares as it deems appropriate. Payment of Performance Shares in this case shall be made as soon as practicable following the end of the fiscal year of termination. 11.6 Termination of Employment Due to Death or Disability. In the event a Participant terminates his employment with the Corporation because of Death or Disability during the Performance Period, the Participant shall be entitled to a prorated award of Performance Shares as of the most recently completed full fiscal year of the Performance Period. Payments of Performance Shares determined in this manner shall be multiplied by a fraction, the numerator of which is the number of full months which have elapsed since the commencement of the Performance Period, and the denominator of which is the number of full months in the particular Performance Period. Payment of Performance Shares in this case shall be made as soon as practicable following the end of the fiscal year of termination. 11.7 Termination of Employment for Reasons Other Than Death, Disability or Retirement. In the event that a Participant terminates his employment with the Corporation for any reason other than those set forth in Sections 1 1.5 and 11.6 hereof during the Performance Period, then any Performance Shares still outstanding at the date of such termination automatically shall be forfeited; provided, however, that, in the event of an involuntary termination of the employment of a Participant by the Corporation the Committee may, in its sole discretion, waive the automatic forfeiture of any or all such Performance Shares as it deems appropriate, and pay a prorated award. 11.8 Nontransferability of Performance Shares. No Performance Shares granted under the Plan may be sold, transferred, pledged, assigned, or otherwise alienated or hypothecated, otherwise than by will or by the laws of descent I-10
and distribution until the termination of the applicable Performance Period. All rights with respect to Performance Shares granted to a Participant under the Plan shall be exercisable during his lifetime only by such Participant. SECTION 12. Performance Awards 12.1 Grant of Performance Awards. Subject to the provisions of Sections 5 and 7, the Committee, at any time and from time to time, may grant Performance Awards under the Plan to Such Participants and in such amounts as it shall determine. Each grant of Performance Awards shall be in writing. 12.2 Performance Period. The period over which Performance Awards may be earned shall begin on the first day of the fiscal year in which a grant occurs. The length of the Performance Period for each grant shall be determined by the Committee in its sole discretion but shall not be less than two years. 12.3 Performance Measurement. At the beginning of each Performance Period, Performance Objectives shall be established by the Chief Executive Officer of the Corporation subject to Committee approval. The degree of attainment of such Performance Objectives shall determine the value of the Performance Awards at the end of the Performance Period, in accordance with a schedule established by the Chief Executive Officer and approved by the Committee at the beginning of the Performance Period. The Committee may adjust the Performance Objectives during the Performance Period if it is determined that changes in business conditions have materially and unduly influenced the Corporation's ability to meet the Performance Objectives. 12.4 Payment of Awards. All payments pursuant to Performance Award grants shall be made as soon as practicable following the end of the applicable Performance Period based upon the degree of attainment of the Performance Objectives. Payments shall be made in cash. The Committee shall review all calculations of actual Performance Objective accomplishments and shall make any adjustments in the computations to recognize material extraordinary or nonrecurring items if, in the judgment of the Committee, the effect of such adjustments is equitable and in conformity with the purposes of the Plan. 12.5 Termination of Employment Due to Retirement. In the event that a Participant terminates his employment with the Corporation because of Normal Retirement during the Performance Period, the Participant shall be entitled to a prorated award of Performance Awards as of the most recently completed full fiscal year of the Performance Period. Payment of Performance Awards determined in this manner shall be multiplied by a fraction, the numerator of which is the number of full months which have elapsed since the commencement of the Performance Period, and the denominator of which is the number of full months in the particular Performance Period. Payment of Performance Awards in this case shall be made as soon as practicable following the end of the fiscal year of termination. In the event that a Participant terminates his employment with the Corporation because of Early Retirement, the Committee may, in its sole discretion, determine a prorated value for the Participant's then outstanding Performance Awards as it deems appropriate. Payment of Performance Awards in this case shall be made as soon as practicable following the end of the fiscal year of termination. 12.6 Termination of Employment Due to Death or Disability. In the event a Participant terminates his employment with the Corporation because of Death or Disability during the Performance Period, the Participant shall be entitled to a prorated award of Performance Awards as of the most recently completed full fiscal year of the Performance Period. Payments of Performance Awards determined in this manner shall be multiplied by a fraction, the numerator of which is the number of full months which have elapsed since the commencement of the Performance Period, and the denominator of which is the number of full months in the particular Performance Period. Payment of Performance Awards in this case shall be made as soon as practicable following the end of the fiscal year of termination. I-11
12.7 Termination of Employment for Reasons Other Than Death, Disability, or Retirement. In the event that a Participant terminates his employment with the Corporation for any reason other than those set forth in Sections 12.5 and 12.6 hereof during the Performance Period, then any Performance Awards still outstanding at the date of such termination automatically shall be forfeited; provided, however, that in the event of an involuntary termination of the employment of a Participant by the Corporation the Committee may, in its sole discretion, waive the automatic forfeiture of any or all such Performance Awards as it deems appropriate and pay a prorated award. 12.8 Nontransferability of Performance Awards. No Performance Awards granted under the Plan may be sold, transferred, pledged, assigned, or otherwise alienated or hypothecated, otherwise than by will or by the laws of descent and distribution until the termination of the applicable Performance Period. All rights with respect to Performance Awards granted to a Participant under the Plan shall be exercisable during his lifetime only by such Participant. SECTION 13. Beneficiary Designation Each Participant under the Plan may, from time to time, name any beneficiary or beneficiaries (who may be named contingently or successively) to whom any benefit under the Plan is to be paid in case of his death before he receives any or all of such benefit. Each designation will revoke all prior designations by the same Participant, shall be in a form prescribed by the Committee, and will be effective only when filed by the Participant in writing with the Committee during his lifetime. In the absence of any such designation, benefits remaining unpaid at the Participant's death shall be paid to his estate. SECTION 14. Rights of Employees 14.1 Employment. Nothing in the Plan shall interfere with or limit in any way the right of the Corporation to terminate any Participant's employment at any time, nor confer upon any Participant any right to continue in the employ of the Corporation. 14.2 Participation. No employee shall have a right to be selected as a Participant, or, having been so selected, to be selected again as a Participant. SECTION 15. Change in Control 15.1 In General. In the event that (a) the Corporation is a party to a merger or consolidation agreement, (b) the Corporation is a party to an agreement to sell substantially all of its assets, or (c) there is a change in control of the Corporation as defined in Section 15.3 below, the Committee may, in its sole discretion, provide that all outstanding Awards shall become 100% vested, that all outstanding Options and SARs shall become immediately exercisable and that any Period of Restriction shall immediately lapse. Performance Share and Performance Award values shall be computed as if the most recently completed full fiscal year was the end of the Performance Period, except that no Performance Share or Performance Award payable under this Section, except as limited by Section 15.2 hereof, may be less than would have been paid had the Corporation achieved 100% of its Performance Objectives. 15.2 Limitation on Payments. If the receipt of any payment under this Section by any Participant shall, in the opinion of independent tax counsel of recognized standing selected by the Corporation, result in the payment by such Participant of any excise tax provided for in Section 280G and Section 4999 of the Code, then the amount of such payment shall be reduced to the extent required, in the opinion of independent tax counsel, to prevent the imposition of such excise tax. 15.3 Definition. For purposes of the Plan, a "change in control" shall mean any of the following events: I-12
(i) The acquisition of "beneficial ownership", as defined in Rule 13d-3 promulgated under the Securities Exchange Act of 1934 (the "Exchange Act"), of twenty percent (20%) or more of the total voting capital Stock of the Corporation then issued and outstanding, by any person, or "group", as defined in Section 13(d)(3) of the Exchange Act, or (ii) Individuals who were members of the Board of the Corporation immediately prior to a meeting of the shareholders of the Corporation involving a contest for the election of directors do not constitute a majority of the Board immediately following such election, unless the election of such new directors was recommended to the shareholders by management of the Corporation. The Board has final authority to determine the exact date on which a change in control has been deemed to have occurred under (i) and (ii) above. SECTION 16. Amendment, Modification, and Termination of Plan The Board may at any time terminate and, from time to time, may amend or modify the Plan, provided, however, that no such action of the Board, without approval of the shareholders, may: (a) Increase the total amount of Stock which may be issued under the Plan, except as provided in Subsections 5.1 and 5.3 of the Plan. (b) Change the provisions of the Plan regarding the Option Price except as permitted by Subsection 5.3. (c) Materially increase the cost of the Plan or materially increase the benefits to Participants. (d) Extend the period during which Options, Stock Appreciation Rights, Restricted Stock, Performance Shares, or Performance Awards may be granted. (e) Extend the maximum period after the date of grant during which Options may be exercised. No amendment, modification, or termination of the Plan shall in any manner adversely affect any Options, Stock Appreciation Rights, Restricted Stock, Performance Shares, or Performance Awards theretofore granted under the Plan, without the consent of the Participant or the Eligible Director, as the case may be. SECTION 17. Tax Withholding (a) The Corporation shall have the right to withhold from any payments made under the Plan or to collect as a condition of payment, any taxes required by law to be withheld. At any time when a Participant or an Eligible Director, as the case may be, is required to pay to the Corporation an amount required to be withheld under applicable income tax laws In connection with a distribution of common stock or upon exercise of an Option or SAR, the Participant or an Eligible Director, as the case may be, may satisfy this obligation in whole or in part by electing (the "Election") to have the Corporation withhold from the distribution shares of common stock having a value equal to the amount required to be withheld. The value of the shares to be withheld shall be based on the Fair Market Value of the common stock on the date that the amount of tax to be withheld shall be determined ("Tax Date"). (b) Each Election must be made prior to the Tax Date. The Committee may disapprove of any Election, may suspend or terminate the right to make Elections, or may provide with respect to any grant that the right to make Elections shall not apply to such Grant. An Election is irrevocable. I-13
SECTION 18. Indemnification Each person who is or shall have been a member of the Committee or of the Board shall be indemnified and held harmless by the Corporation against and from any loss, cost, liability, or expense that may be imposed upon or reasonably incurred by him in connection with or resulting from any claim, action, Suit, or proceeding to which he may be a party or in which he may be involved by reason of any action taken or failure to act under the plan and against and from any and all amounts paid by him in settlement thereof, with the Corporation's approval, or paid by him in satisfaction of any judgment in any such action, suit, or proceeding against him, provided he shall give the Corporation an opportunity, at its own expense, to handle and defend the same before he undertakes to handle and defend it on his own behalf. The foregoing right of Indemnification, shall not be exclusive of any other rights of Indemnification to which such persons may be entitled under the Corporation's Articles of Incorporation or Code of Regulations, as a matter of law, or otherwise, or any power that the Corporation may have to indemnify them or hold them harmless. SECTION 19. Requirements of Law 19.1 Requirements of Law. The granting of Options, Stock Appreciation Rights, Restricted Stock, Performance Shares, or performance Awards, and the issuance of shares of Stock upon the exercise of an Option shall be subject to all applicable laws, rules, and regulations, and to such approvals by any governmental agencies or national securities exchanges as may be required. 19.2 Governing Law. The Plan, and all agreements hereunder, shall be construed in accordance with and be governed by the laws of the State of Ohio. Amended: Oct., 1996 - Section 2 - Definition of Committee Sections 8.9, 8.10 & 10.8 - Matters re: Termination of Employment Section 17(c) Deleted Apr., 1992 - Section 5.1 Stock Subject to Plan Increased I-14
Exhibit 10.31 REVISED AND RESTATED BANC ONE CORPORATION 1995 STOCK INCENTIVE PLAN 1. PURPOSE The purpose of the BANC ONE CORPORATION 1995 Stock Incentive Plan is to provide incentives and rewards for Employees and Eligible Directors of the Corporation and its Subsidiaries (i) to support the execution of the Corporation's business and human resource strategies and the achievement of its goals and (ii) to associate the interests of Employees and Eligible Directors with those of the Corporation's shareholders. 2. DEFINITIONS "Award" includes, without limitation, stock options (including incentive stock options under Section 422 of the Code and Director Stock Options), stock appreciation rights, restricted and performance shares, restricted and performance share units, Performance Stock Awards, dividend or equivalent rights, or other awards that are valued in whole or in part by reference to, or are otherwise based on, the Common Stock ("other Common Stock-based Awards"), all on a stand alone, combination or tandem basis, as described in or granted under this Plan. "Award Agreement" means a written agreement entered into between the Corporation and a Participant setting forth the terms and conditions of an Award made to such Participant under this Plan, in the form prescribed by the Committee. "Board" means the Board of Directors of the Corporation. "Change of Control" shall have the meaning specified in Section 12(b). "Code" means the Internal Revenue Code of 1986, as amended from time to time. "Committee" means the Committee appointed by the Board, each member of which shall be a "non-employee director" within the meaning of Rule 16b-3 under the Exchange Act and shall be an "outside director" within the meaning of Section 162(m) of the Code. The Committee shall be composed of no fewer than the minimum number of disinterested persons as may be required by Rule 16b-3. "Common Stock" means the common stock of the Corporation, without par value. "Corporation" means BANC ONE CORPORATION, a bank holding company under the Bank Holding Company Act of 1956 headquartered in Columbus, Ohio. "Director Stock Option" means the right, granted to an Eligible Director, to purchase Common Stock at a stated price for a specified period of time. Each Director Stock Option shall be a nonqualified stock option whose grant is not intended to comply with the requirements of Section 422 of the Code or any successor Section as it may be amended from time to time. "Eligible Director" means any statutory director of the Corporation who is not an employee of the Corporation or any Subsidiary. "Employee" means an employee of the Corporation or a Subsidiary. -1-
"Employee Award" means an Award (other than a Director Stock Option) to an Employee under this Plan. "ERISA" means the Employee Retirement Income Security Act of 1974, as amended. "Exchange Act" means the Securities Exchange Act of 1934, as amended. "Fair Market Value" means the closing price of the Common Stock as reported on the New York Stock Exchange Composite Transactions Tape on the relevant valuation date or, if there were no Common Stock transactions on the valuation date, on the next preceding date on which there were Common Stock transactions; provided, however, that the Committee may specify some other definition of Fair Market Value with respect to any particular Employee Award. "Negative Discretion" means other factors to be applied by the Committee in reducing the number of restricted shares to be issued pursuant to a Performance Stock Award if the Performance Goals have been met or exceeded if, in the Committee's sole judgment, such application is appropriate in order to act in the best interest of the Corporation and its shareholders. The Negative Discretion factors include, but are not limited to, the achievement of measurable individual performance objectives established by the Committee and communicated to the Employee in advance of the Performance Period, and competitive pay practices. "Participant" means an Employee or an Eligible Director who has been granted an Award under this Plan. "Performance Goals" means, with respect to any Performance Period, performance goals based on any of the following criteria and established by the Committee prior to the beginning of such Performance Period or performance goals based on any of the following criteria and established by the Committee after the beginning of such Performance Period that meet the requirements to be considered pre-established performance goals under Section 162(m) of the Code: earnings or earnings growth; return on equity, assets or investment; revenues; expenses; stock price; market share; charge-offs; or reductions in non-performing assets. Such Performance Goals may be particular to an Employee or the division, department, branch, line of business, Subsidiary or other Unit in which the Employee works, or may be based on the performance of the Corporation generally. "Performance Period" means the period of time designated by the Committee applicable to a Performance Stock Award during which the Performance Goals shall be measured. "Performance Stock Award" shall have the meaning specified in Section 6(g). "Plan" means this BANC ONE CORPORATION 1995 Stock Incentive Plan. "Plan Year" means a twelve-month period beginning with January 1 of each year. "Reporting Person" means an officer or director of the Corporation subject to the reporting requirements of Section 16 of the Exchange Act. "Subsidiary" means any corporation or other entity, whether domestic or foreign, in which the Corporation has or obtains, directly or indirectly, a proprietary interest of more than 50% by reason of stock ownership or otherwise. -2-
3. ELIGIBILITY (a) Any Employee selected by the Committee is eligible to receive an Employee Award. (b) Eligible Directors are entitled to participate in this Plan solely with respect to the grant of Director Stock Options and may not receive any other Awards under this Plan. The selection of Eligible Directors is not subject to the discretion of the Committee. Persons serving on the Committee who are Eligible Directors may receive grants of Director Stock Options. 4. PLAN ADMINISTRATION (a) This Plan shall be administered by the Committee. The Committee shall periodically make determinations with respect to the participation of Employees in this Plan and, except as otherwise required by law or this Plan, the grant terms of Awards including vesting schedules, price, performance standards (including Performance Goals), length of relevant performance, restriction or option period, dividend rights, post-retirement and termination rights, payment alternatives such as cash, stock, contingent awards or other means of payment consistent with the purposes of this Plan, and such other terms and conditions as the Committee deems appropriate. Except as otherwise required by this Plan, the Committee shall have authority to interpret and construe the provisions of this Plan and the Award Agreements and make determinations pursuant to any Plan provision or Award Agreement which shall be final and binding on all persons. (b) The Committee may designate persons other than its members to carry out its responsibilities under such conditions or limitations as it may set, other than its authority with regard to Awards granted to Reporting Persons. 5. STOCK SUBJECT TO THE PROVISIONS OF THIS PLAN (a) The stock subject to the provisions of this Plan shall either be shares of authorized but unissued Common Stock, shares of Common Stock held as treasury stock or previously issued shares of Common Stock reacquired by the Corporation, including shares purchased on the open market. Subject to adjustment in accordance with the provisions of Section 11, and subject to Section 5(d), (i) the total number of shares of Common Stock available for grants of Awards (including, without limitation, Awards of restricted and performance shares) in any Plan Year shall not exceed one percent of the outstanding Common Stock as reported in the Corporation's Annual Report on Form 10-K for the fiscal year ending immediately prior to such Plan Year and (ii) the total number of shares of Common Stock available for grants of restricted and performance shares (including restricted shares to be issued pursuant to Performance Stock Awards) in any Plan Year shall not exceed one fourth of one percent of the outstanding Common Stock as reported in the Corporation's Annual Report on form 10- K for the fiscal year ending immediately prior to such Plan Year. (b) Subject to adjustment in accordance with Section 11, and subject to Section 5(a), (i) the total number of shares of Common Stock available for grants of Awards in any Plan Year to any Participant shall not exceed one half of one percent of the outstanding Common Stock as reported in the Corporation's Annual Report on Form 10-K for the fiscal year ending immediately prior to such Plan Year and (ii) the total number of shares of Common Stock available for grants of restricted shares to be issued pursuant to Performance Stock Awards in any Plan Year to any Employee shall not exceed one eighth of one percent of the outstanding Common Stock as reported in the Corporation's Annual Report on form 10-K for the fiscal year ending immediately prior to such Plan Year. -3-
(c) For purposes of calculating the total number of shares of Common Stock available for grants of Awards, (i) the grant of a performance or restricted share unit Award shall be deemed to be equal to the maximum number of shares of Common Stock which may be issued under the Award and (ii) where the value of an Award is variable on the date it is granted, the value shall be deemed to be the maximum limitation of the Award. Awards payable solely in cash will not reduce the number of shares of Common Stock available for Awards granted under this Plan. (d) There shall be carried forward and be available for Awards under this Plan in each succeeding Plan Year, in addition to shares of Common Stock available for grant under paragraph (a) of this Section 5, all of the following: (i) any unused portion of the limit set forth in paragraph (a) of this Section 5 for the two immediately preceding Plan Years; (ii) shares of Common Stock represented by Awards which have been canceled, forfeited, surrendered, terminated or expire unexercised during that Plan Year or the two immediately preceding Plan Years; (iii) the excess amount of variable Awards which become fixed at less than their maximum limitations; (iv) authorized shares of Common Stock as to which stock options, stock appreciation rights, restricted stock awards, performance shares or performance awards were not granted under the BANC ONE CORPORATION 1989 Stock Incentive Plan; and (v) shares of Common Stock under the BANC ONE CORPORATION 1989 Stock Incentive Plan subject to stock options, stock appreciation rights, restricted stock awards, performance shares or performance awards which have been canceled, forfeited, surrendered, terminated or expire unexercised during that Plan Year or the two immediately preceding Plan Years. 6. EMPLOYEE AWARDS UNDER THIS PLAN As the Committee may determine, the following types of Employee Awards may be granted under this Plan to Employees on a stand alone, combination or tandem basis: (a) Stock Option. A right to buy a specified number of shares of Common Stock at a fixed exercise price during a specified time, all as the Committee may determine; provided that the exercise price of any option shall not be less than 100% of the Fair Market Value of the Common Stock on the date of grant of the Award. (b) Incentive Stock Option. An award in the form of a stock option which shall comply with the requirements of Section 422 of the Code or any successor Section as it may be amended from time to time. (c) Stock Appreciation Right. A right to receive the excess of the Fair Market Value of a share of Common Stock on the date the stock appreciation right is exercised over the Fair Market Value of a share of Common Stock on the date the stock appreciation right was granted. (d) Restricted and Performance Shares. A transfer of shares of Common Stock to a Participant, subject to such restrictions on transfer or other incidents of ownership, or subject to specified performance standards, for such periods of time as the Committee may determine. (e) Restricted and Performance Share Unit. A fixed or variable share or dollar denominated unit subject to conditions of vesting, performance and time of payment as the Committee may determine, which may be paid in shares of Common Stock, cash or a combination of both. (f) Dividend or Equivalent Right. A right to receive dividends or their equivalent in value in shares of Common Stock, cash or in a combination of both with respect to any new or previously existing Employee Award. -4-
(g) Performance Stock Awards. A right, granted to an Employee, to receive restricted shares (as defined in Section 6(d) hereof) that are not to be issued to the Employee until after the end of the related Performance Period, subject to satisfaction of the Performance Goals for such Performance Period. (h) Other Common Stock-Based Awards. Other Common Stock-based Awards which are related to or serve a similar function to those Employee Awards set forth in this Section 6. In addition to granting Employee Awards for purposes of incentive compensation, Employee Awards may also be made in tandem with or in lieu of current or deferred Employee compensation. 7. PERFORMANCE STOCK AWARDS. (a) Administration. Performance Stock Awards may be granted to Employees either alone or in addition to other Employee Awards granted under this Plan. The Committee shall determine the Employees to whom Performance Stock Awards shall be awarded for any Performance Period, the duration of the applicable Performance Period, the number of restricted shares to be awarded at the end of a Performance Period to Employees if the Performance Goals are met or exceeded and the terms and conditions of the Performance Stock Award in addition to those contained in this Section 7. (b) Payment of Award. After the end of a Performance Period, the financial performance of the Corporation during such Performance Period shall be measured against the Performance Goals. If the Performance Goals are not met, no restricted shares shall be issued pursuant to the Performance Stock Award. If the Performance Goals are met or exceeded, the Committee shall certify that fact in writing in the Committee minutes or elsewhere and certify the number of restricted shares to be issued under each Performance Stock Award in accordance with the related Award Agreement. The Committee may, in its sole discretion, apply Negative Discretion to reduce the number of restricted shares to be issued under a Performance Stock Award. (c) Requirement of Employment. To be entitled to receive a Performance Stock Award, an Employee must remain in the employment of the Corporation through the end of the Performance Period, except that the Committee may provide for partial or complete exceptions to this requirement as it deems equitable in its sole discretion. 8. DIRECTOR STOCK OPTIONS Subject to the provisions of Section 5, Director Stock Options shall be granted to Eligible Directors as provided in this Section 8 and the Committee shall have no discretion with respect to any matters set forth in this Section 8. (a) Vesting. Each Director Stock Option shall become exercisable on and after the first anniversary of the date of the grant. (b) Number of Shares. Director Stock Options shall be granted as follows: (i) Each person who is first elected or appointed to serve as a director of the Corporation after the effective date of this Plan and who is an Eligible Director shall, upon such person's initial appointment or election as an Eligible Director, automatically be granted Director Stock Options for that number of shares of Common Stock having a Fair Market Value of $100,000 on the date the Director Stock Options are granted; and (ii) Commencing immediately after the adjournment of the Corporation's annual meeting of shareholders (an "Annual Meeting") in 1995 and immediately after the adjournment of the Annual -5-
Meeting each year thereafter, each Eligible Director who was an Eligible Director immediately preceding such Annual Meeting and who has been elected as a director at such Annual Meeting shall automatically be granted Director Stock Options for that number of shares of Common Stock having a Fair Market Value of $60,000 on the date the Director Stock Options are granted if, but only if, the return on common equity of the Corporation as set forth in the Corporation's annual report to shareholders for the immediately preceding fiscal year is equal to or greater than 10%. (c) Option Price. Each Director Stock Option shall have an option price ("Option Price") that is equal to the Fair Market Value of the Common Stock on the date the Director Stock Option is granted. (d) Duration of Options. No Director Stock Option may be exercisable later than twenty years and one day from the date of its grant. (e) Payment. The Option Price upon exercise of any Director Stock Option shall be payable to the Corporation in full either (i) in U.S. dollars by personal check, bank draft or money order payable to the order of the Corporation, by money transfers or direct account debits, (ii) through the delivery or deemed delivery based on attestation of ownership of shares of Common Stock with a Fair Market Value at the time of exercise equal to the total Option Price or (iii) by a combination of the methods described in items (i) and (ii) above. (f) Termination of Director Stock Options. If an Eligible Director ceases to be an Eligible Director for any reason, the rights under any then outstanding Director Stock Option granted pursuant to this Plan which are exercisable as of the date such person ceases to be an Eligible Director shall terminate upon the date determined as provided in Section 8(d), above, or three years after such cessation date, whichever first occurs. Any then outstanding Director Stock Option granted to such Eligible Director which is not exercisable as of the date such person ceases to be an Eligible Director shall terminate on and as of such date. 9. OTHER TERMS AND CONDITIONS (a) Assignability. Except to the extent, if any, as may be permitted by the Code and rules promulgated under Section 16 of the Exchange Act, (i) no Award shall be assignable or transferable except by will, by the laws of descent and distribution, pursuant to a qualified domestic relations order as defined by the Code and as determined or established by the Committee, and (ii) during the lifetime of a Participant, an Award shall be exercisable only by such Participant, such Participant's guardian, legal representative or assignee pursuant to a qualified domestic relations order or as determined or established by the Committee. An Award shall not otherwise be assignable. (b) Award Agreement. Each Award under this Plan shall be evidenced by an Award Agreement. (c) Rights As A Shareholder. Except as otherwise provided herein or in any Award Agreement, a Participant shall have no rights as a shareholder with respect to shares of Common Stock covered by an Award until the date the Participant or his nominee (which, for purposes of this Plan, shall include any third party agent selected by the Committee to hold such shares on behalf of a Participant), guardian or legal representative is the holder of record of such shares. (d) No Obligation to Exercise. The grant of an Award shall impose no obligation upon the Participant to exercise the Award. (e) Payments by Participants. The Committee may determine that Employee Awards for which a payment is due from a Participant may be payable: (i) in U.S. dollars by personal check, bank draft or money order payable to the order of the Corporation, by money transfers or direct account debits; (ii) through the delivery or deemed delivery based on attestation to the ownership of shares of Common Stock with a Fair Market Value equal to the total payment due from the Participant; (iii) by a combination of the methods described in (i) and (ii) above; or (iv) by such other methods as the Committee may deem appropriate. -6-
(f) Tax Withholding. The Corporation shall have the right to withhold from any payments made under this Plan, or to collect as a condition of payment, any taxes required by law to be withheld. At any time when a Participant is required to pay to the Corporation an amount required to be withheld under applicable income tax laws in connection with a distribution of shares of Common Stock pursuant to this Plan, the Participant may satisfy this obligation in whole or in part by electing to have the Corporation withhold from such distribution shares of Common Stock having a value equal to the amount required to be withheld. The value of the shares of Common Stock to be withheld shall be based on the Fair Market Value of the Common Stock on the date that the amount of tax to be withheld shall be determined (the "Tax Date"). Any such election is subject to the following restrictions: (i) the election must be made on or prior to the Tax Date and (ii) the election must be subject to the disapproval of the Committee. (g) Restrictions On Sale and Exercise. With respect to Reporting Persons, and if required to comply with rules promulgated under Section 16 of the Exchange Act, (i) no Award providing for exercise, a vesting period, a restriction period or the attainment of performance standards shall permit unrestricted ownership of shares of Common Stock by the Participant for at least six months from the date of grant, and (ii) shares of Common Stock acquired pursuant to this Plan (other than shares of Common Stock acquired as a result of the granting of a "derivative security") may not be sold or otherwise disposed of for at least six months after acquisition. (h) Requirements of Law. The granting of Awards and the issuance of shares of Common Stock upon the exercise of Awards shall be subject to all applicable requirements imposed by federal and state securities and other laws, rules and regulations and by any regulatory agencies having jurisdiction, and by any stock exchanges upon which the Common Stock may be listed. As a condition precedent to the issuer of shares of Common Stock pursuant to the grant or exercise of an Award, the Corporation may require the Participant to take any reasonable action to meet such requirements. 10. AMENDMENTS (a) Except as otherwise provided in this Plan, the Board may at any time terminate and, from time to time, may amend or modify this Plan. Any such action of the Board may be taken without the approval of the Corporation's shareholders, but only to the extent that such shareholder approval is not required by applicable law or regulation, including specifically Rule 16b-3 under the Exchange Act. (b) No amendment, modification or termination of this Plan shall in any manner adversely affect any Awards theretofore granted to a Participant under this Plan without the consent of such Participant. 11. RECAPITALIZATION The aggregate number of shares of Common Stock as to which Awards may be granted to Participants, the number of shares thereof covered by each outstanding Award, and the price per share thereof in each such Award, shall all be proportionately adjusted for any increase or decrease in the number of issued shares of Common Stock resulting from a stock split, stock dividend, combination or exchange of shares, exchange for other securities, reclassification, reorganization, redesignation, merger, consolidation, recapitalization or other such change. Any such adjustment may provide for the elimination of fractional shares. 12. NO RIGHT TO EMPLOYMENT No person shall have any claim or right to be granted an Award, and the grant of an Award shall not be construed as giving a Participant the right to be retained in the employ of the Corporation or a Subsidiary. Nothing in this Plan shall interfere with or limit in any way the right of the Corporation or any Subsidiary to terminate any Participant's employment at any time, nor confer upon any Participant any right to continue in the employ of the Corporation or any Subsidiary. -7-
13. CHANGE OF CONTROL (a) Subject to the provisions of Section 13(c) below, notwithstanding anything contained in this Plan, the provisions of Section 13(a)(iii) below or any Award Agreement to the contrary, in the event of a Change of Control, as defined below, the following (x) may, in the sole discretion of the Committee, occur with respect to any and all Employee Awards outstanding as of such Change of Control and (y) shall occur with respect to any and all Director Stock Options outstanding as of such Change of Control: (i) automatic maximization of performance standards, lapse of all restrictions and acceleration of any time periods relating to the exercise, realization or vesting of such Awards so that such Awards may be immediately exercised, realized or vested in full on or before the relevant date fixed in the Award Agreement; (ii) performance shares or performance units shall be paid entirely in cash; (iii) upon exercise of a stock option or an incentive stock option (collectively, an "Option") during the 60-day period from and after the date of a Change of Control, the Participant exercising the Option may in lieu of the receipt of Common Stock upon the exercise of the Option, elect by written notice to the Corporation to receive an amount in cash equal to the excess of the aggregate Value (as defined below) of the shares of Common Stock covered by the Option or portion thereof surrendered determined on the date the Option is exercised, over the aggregate exercise price of the Option (such excess is referred to herein as the "Aggregate Spread"); provided, however, and notwithstanding any other provision of this Plan, if the end of such 60-day period from and after the date of a Change of Control is within six months of the date of grant of an Option held by a Participant who is a Reporting Person, such Option shall be canceled in exchange for a cash payment to the Participant equal to the Aggregate Spread on the day which is six months and one day after the date of grant of such Option. As used in this Section 13(a)(iii) the term "Value" means the higher of (i) the highest Fair Market Value during the 60-day period from and after the date of a Change of Control and (ii) if the Change of Control is the result of a transaction or series of transactions described in paragraphs (i) or (iii) of the definition of Change of Control, the highest price per share of the Common Stock paid in such transaction or series of transactions (which in the case of paragraph (i) shall be the highest price per share of the Common Stock as reflected in a Schedule 13D filed by the person having made the acquisition); (iv) if a Participant's employment terminates for any reason other than retirement or death following a Change of Control, any Options held by such Participant may be exercised by such Participant until the earlier of three months after the termination of employment or the expiration date of such Options; and (v) all Awards become non-cancelable. (b) A "Change of Control" of the Corporation shall be deemed to have occurred upon the happening of any of the following events: (i) the acquisition, other than from the Corporation, by any individual, entity or group (within the meaning of Section 13(d)(3) or 14(d)(2) of the Exchange Act) of beneficial ownership of 20% or more of either the then outstanding shares of Common Stock of the Corporation or the combined voting power of the then outstanding voting securities of the Corporation entitled to vote generally in the election of directors; provided, however, that any acquisition by the Corporation or any of its Subsidiaries, or any employee benefit plan (or related trust) of the Corporation or its Subsidiaries, or any corporation with respect to which, following such acquisition, more than 50% of, respectively, the then outstanding shares of common stock of such corporation and the combined voting power of the then outstanding voting securities of such corporation entitled to vote generally in the election of directors is then beneficially owned, directly or indirectly, by all or substantially all of the individuals and entities who were the beneficial owners, respectively, of the Common Stock and voting securities of the Corporation immediately prior to such acquisition in substantially the same proportion as their ownership, immediately -8-
prior to such acquisition, of the then outstanding shares of Common Stock of the Corporation or the combined voting power of the then outstanding voting securities of the Corporation entitled to vote generally in the election of directors, as the case may be, shall not constitute a Change of Control; (ii) individuals who, as of January 1, 1995, constitute the Board as of the date hereof (the "Incumbent Board") cease for any reason to constitute at least a majority of the Board, provided that any individual becoming a director subsequent to such date whose election, or nomination for election by the Corporation's shareholders, was approved by a vote of at least a majority of the directors then comprising the Incumbent Board shall be considered as though such individual were a member of the Incumbent Board, but excluding, for this purpose, any such individual whose initial assumption of office is in connection with an actual or threatened election contest relating to the election of the directors of the Corporation (as such terms are used in Rule 14a-11 of Regulation 14A promulgated under the Exchange Act); or (iii) approval by the shareholders of the Corporation of a reorganization, merger or consolidation of the Corporation, in each case, with respect to which the individuals and entities who were the respective beneficial owners of the Common Stock and voting securities of the Corporation immediately prior to such reorganization, merger or consolidation do not, following such reorganization, merger or consolidation, beneficially own, directly or indirectly, more than 50% of, respectively, the then outstanding shares of Common Stock and the combined voting power of the then outstanding voting securities entitled to vote generally in the election of directors, as the case may be, of the corporation resulting from such reorganization, merger or consolidation, or a complete liquidation or dissolution of the Corporation or of the sale or other disposition of all or substantially all of the assets of the Corporation. (c) If any right granted pursuant to Section 13(a) would make a Change of Control transaction ineligible for pooling of interests accounting that but for Section 13(a) would otherwise be eligible for such accounting treatment, the Committee shall have the ability to substitute the cash payable pursuant to Section 13(a) with Common Stock with a Fair Market Value equal to the cash that would otherwise be payable thereunder. 14. GOVERNING LAW To the extent that federal laws do not otherwise control, this Plan shall be construed in accordance with and governed by the law of the State of Ohio. 15. INDEMNIFICATION Each person who is or shall have been a member of the Committee or of the Board shall be indemnified and held harmless by the Corporation against and from any loss, cost, liability or expense that may be imposed upon or reasonably incurred by him in connection with or resulting from any claim, action, suit or proceeding to which he may be a party or in which he may be involved by reason of any action taken or failure to act under this Plan and against and from any and all amounts paid by him in settlement thereof, with the Corporation's approval, or paid by him in satisfaction of any judgment in any such action, suit or proceeding against him, provided he shall give the Corporation an opportunity, at its own expense, to handle and defend the same before he undertakes to handle and defend it on his own behalf. The foregoing right of indemnification shall not be exclusive of any other rights of indemnification to which such persons may be entitled under the Corporation's Articles of Incorporation or Code of Regulations, as a matter of law, or otherwise, or any power that the Corporation may have to indemnify them or hold them harmless. -9-
16. SAVINGS CLAUSE This Plan is intended to comply in all aspects with applicable law and regulation, including, with respect to those Employees who are Reporting Persons, Rule 16b-3 under the Exchange Act. In case any one or more of the provisions of this Plan shall be held invalid, illegal or unenforceable in any respect under applicable law and regulation (including Rule 16b-3), the validity, legality and enforceability of the remaining provisions shall not in any way be affected or impaired thereby and the invalid, illegal or unenforceable provision shall be deemed null and void; however, to the extent permissible by laws, any provision which could be deemed null and void shall first be construed, interpreted or revised retroactively to permit this Plan to be construed in compliance with all applicable laws (including Rule 16b-3) so as to foster the intent of this Plan. Notwithstanding anything in this Plan to the contrary, the Committee, in its sole and absolute discretion, may bifurcate this Plan so as to restrict, limit or condition the use of any provision of this Plan to Participants who are Reporting Persons without so restricting, limiting or conditioning this Plan with respect to other Participants. 17. EFFECTIVE DATE AND TERM The effective date of this Plan is April 17, 1995 subject to its approval by the Corporation's shareholders at their next annual meeting or at any adjournment thereof, within twelve months following the date of its adoption by the Board. This Plan shall remain in effect until terminated by the Board. Amended: Oct. 1996 - Section 2 - Definition of Committee Section 9(f) - Tax Withholding Jan. 1997 - Section 9(a) - Assignability Jan. 1998 - Section 10 - Amendments - former Section 10(b) deleted Section 13(a) - Change of Control Section 13(c) - Change of Control added Revised 5/30/97 Revised 6/2/97 (tab spacing change only) Revised 2/27/98 Revised 3/10/98 (correct two typos) -10-
Exhibit 12.1
JPMorgan Chase & Co.
Computation of ratio of earnings to fixed charges
| Year ended December 31, 2004 (in millions, except ratios) | ||||
Excluding interest on deposits |
||||
Income before income taxes |
$ | 6,194 | ||
Fixed charges: |
||||
Interest expense |
9,234 | |||
One-third of rents, net of income from subleases(a) |
343 | |||
Total fixed charges |
9,577 | |||
Add: equity in undistributed loss of affiliates |
44 | |||
Earnings before taxes and fixed charges, excluding capitalized interest |
$ | 15,815 | ||
Fixed charges, as above |
$ | 9,577 | ||
Ratio of earnings to fixed charges |
1.65 | |||
Including interest on deposits |
||||
Fixed charges, as above |
$ | 9,577 | ||
Add: interest on deposits |
4,600 | |||
Total fixed charges and interest on deposits |
$ | 14,177 | ||
Earnings before taxes and fixed charges, excluding capitalized interest, as above |
$ | 15,815 | ||
Add: interest on deposits |
4,600 | |||
Total earnings before taxes, fixed charges and interest on deposits |
$ | 20,415 | ||
Ratio of earnings to fixed charges |
1.44 | |||
| (a) | The proportion deemed representative of the interest factor. |
146
Exhibit 12.2
JPMorgan Chase & Co.
Computation of ratio of earnings to fixed charges
and preferred stock dividend requirements
| Year ended December 31, 2004 (in millions, except ratios) | ||||
Excluding interest on deposits |
||||
Income before income taxes |
$ | 6,194 | ||
Fixed charges: |
||||
Interest expense |
9,234 | |||
One-third of rents, net of income from subleases(a) |
343 | |||
Total fixed charges |
9,577 | |||
Add: equity in undistributed loss of affiliates |
44 | |||
Earnings before taxes and fixed charges, excluding capitalized interest |
$ | 15,815 | ||
Fixed charges, as above |
$ | 9,577 | ||
Preferred stock dividends (pre-tax) |
72 | |||
Fixed charges including preferred stock dividends |
$ | 9,649 | ||
Ratio of earnings to fixed charges and preferred stock dividend requirements |
1.64 | |||
Including interest on deposits |
||||
Fixed charges including preferred stock dividends, as above |
$ | 9,649 | ||
Add: interest on deposits |
4,600 | |||
Total fixed charges including preferred stock dividends and interest on deposits |
$ | 14,249 | ||
Earnings before taxes and fixed charges, excluding capitalized interest, as above |
$ | 15,815 | ||
Add: interest on deposits |
4,600 | |||
Total earnings before taxes, fixed charges and interest on deposits |
$ | 20,415 | ||
Ratio of earnings to fixed charges and preferred stock dividend requirements |
1.43 | |||
| (a) | The proportion deemed representative of the interest factor. |
147
Exhibit 21.1
JPMorgan Chase & Co.
List of subsidiaries
JPMorgan Chase had the following subsidiaries at December 31, 2004:
| Percentage | ||||||||
| of voting | ||||||||
| securities | ||||||||
| owned by | ||||||||
| Organized under the | immediate | |||||||
| Name | laws of | parent | ||||||
BOI Leasing Corporation |
Indiana | 100 | % | |||||
Banc One Building Management Corporation |
Wisconsin | 100 | ||||||
Banc One Capital Holdings Corporation |
Ohio | 100 | ||||||
BOCP Holdings Corporation |
Ohio | 100 | ||||||
BOCF, LLC |
Delaware | 100 | ||||||
BOCNY, LLC |
Delaware | 100 | ||||||
BOME Investors, Inc. |
Delaware | 100 | ||||||
Banc One Capital Partners BC, LLC |
Ohio | 80 | ||||||
Banc One Capital BIDCO-1998, LLC |
Louisiana | 100 | ||||||
Banc One Capital Partners Holdings, Ltd. |
Ohio | 100 | ||||||
Banc One Capital Partners II, LLC |
Delaware | 100 | ||||||
Banc One Capital Partners, LLC |
Delaware | 100 | ||||||
Banc One Capital Partners IV, Ltd. |
Ohio | 100 | ||||||
Banc One Capital Partners V, Ltd. |
Ohio | 100 | ||||||
Banc One Capital Partners XI, Ltd. |
Ohio | 100 | ||||||
Banc One Stonehenge Capital Fund Wisconsin, LLC |
Delaware | 100 | ||||||
Tax Credit Acquisitions II, LLC |
Ohio | 100 | ||||||
Tax Credit Acquisitions, LLC |
Ohio | 100 | ||||||
Banc One Securities Corporation |
Ohio | 100 | ||||||
Banc One Financial LLC |
Delaware | 100 | ||||||
JPMorgan Capital Corporation |
Delaware | 100 | ||||||
Banc One Capital Management LLC |
Delaware | 100 | ||||||
Bank One Investment Corporation |
Delaware | 100 | ||||||
OEP Holding Corporation |
Delaware | 100 | ||||||
Banc One Equity Capital Fund II, L.L.C. |
Delaware | 100 | ||||||
Banc One Equity Capital SBIC Fund II, L.L.C. |
Delaware | 100 | ||||||
OEP Management LLC |
Delaware | 93.75 | ||||||
One Equity Partners LLC |
Delaware | 100 | ||||||
OEP Star Limited LLC |
Delaware | 100 | ||||||
First Chicago Capital Corporation |
Delaware | 100 | ||||||
One Mortgage Partners Corp. |
Vermont | 100 | ||||||
First Chicago Leasing Corporation |
Delaware | 100 | ||||||
NLTC Fund Holdings I, Inc. |
Delaware | 100 | ||||||
OX FCL Two, Inc. |
Delaware | 100 | ||||||
Skyhigh Corporation |
Delaware | 100 | ||||||
Oak Street FSC, Ltd. |
Bermuda | 100 | ||||||
FCL Ship Five, Inc. |
Delaware | 100 | ||||||
Cooper Project, L.L.C. |
Delaware | 100 | ||||||
FCL Ship Fourteen, Inc. |
Delaware | 100 | ||||||
FM Holdings I, Inc. |
Delaware | 100 | ||||||
FM Holdings II, Inc. |
Delaware | 100 | ||||||
First Chicago Lease Holdings, Inc. |
Delaware | 100 | ||||||
Palo Verde Leasing Corporation |
Delaware | 100 | ||||||
First Chicago Lease Investments, Inc. |
Delaware | 100 | ||||||
Fountain FSC, Ltd. |
Belgium | 100 | ||||||
GHML Holdings I, Inc. |
Delaware | 100 | ||||||
GHML Holdings II, Inc. |
Delaware | 100 | ||||||
GTC Fund III Holdings, Inc. |
Delaware | 100 | ||||||
GTC Fund IV Holdings, Inc. |
Delaware | 100 | ||||||
GTC Fund V Holdings, Inc. |
Delaware | 100 | ||||||
148
| Percentage | ||||||||
| of voting | ||||||||
| securities | ||||||||
| owned by | ||||||||
| Organized under the | immediate | |||||||
| Name | laws of | parent | ||||||
Banc One Financial Services, Inc. |
Indiana | 100 | ||||||
Banc One Insurance Holdings, Inc. |
Arizona | 100 | ||||||
Banc One Insurance Agency, Inc. |
Wisconsin | 100 | ||||||
Banc One Insurance Company |
Vermont | 100 | ||||||
Banc One Life Reinsurance Company |
Arizona | 100 | ||||||
Federal Kemper Life Assurance Company |
Illinois | 100 | ||||||
Zurich Life Insurance Company of America |
Illinois | 100 | ||||||
Zurich Life Insurance Company of New York |
New York | 100 | ||||||
One Life Direct, Inc. |
Illinois | 100 | ||||||
Banc One Kentucky Insurance Company |
Kentucky | 100 | ||||||
Banc One Management Corporation |
Ohio | 100 | ||||||
Banc One Deferred Benefits Corporation |
Ohio | 100 | ||||||
Banc One Neighborhood Development Corporation |
Ohio | 100 | ||||||
Bank One Trust Company, National Association |
United States | 100 | ||||||
Bridge Acquisition Holdings, Inc. |
Delaware | 100 | ||||||
CCC Holding, Inc. |
Delaware | 100 | ||||||
Chase Commercial Corporation |
Delaware | 100 | ||||||
CMRCC, Inc. |
New York | 100 | ||||||
Chase Funding, Inc. |
New York | 100 | ||||||
Chase Home Mortgage Corporation of the Southeast |
Florida | 100 | ||||||
Chase Investment Services Corp. |
Delaware | 100 | ||||||
Chase Lincoln First Commercial Corporation |
Delaware | 100 | ||||||
Chase Manhattan Realty Leasing Corporation |
New York | 100 | ||||||
PV2-APS 150 Corporation |
Delaware | 100 | ||||||
PV2-PNM December 35 Corporation |
Delaware | 100 | ||||||
Palo Verde 1-PNM August 50 Corporation |
Delaware | 100 | ||||||
Palo Verde 1-PNM December 75 Corporation |
Delaware | 100 | ||||||
Chase Shareholder Services of California, Inc. |
Delaware | 100 | ||||||
Chatham Ventures, Inc. |
New York | 100 | ||||||
J.P. Morgan Partners (BHCA), L.P. |
California | 100 | ||||||
J.P. Morgan Partners (SBIC), LLC |
California | 100 | ||||||
Chemical Equity Incorporated |
New York | 100 | ||||||
Chemical Investments, Inc. |
Delaware | 100 | ||||||
Clintstone Properties Inc. |
New York | 100 | ||||||
Hambrecht & Quist Group |
Delaware | 100 | ||||||
Hambrecht & Quist California |
California | 100 | ||||||
Hambrecht & Quist Guaranty Finance, LLC |
California | 87.5 | ||||||
Hatherley Insurance Ltd. |
Bermuda | 100 | ||||||
J.P. Morgan Capital Financing Limited |
England | 100 | ||||||
Aldermanbury Investments Limited |
England | 100 | ||||||
Robert Fleming Holdings Limited |
England | 100 | ||||||
Copthall Overseas Limited |
England | 100 | ||||||
Robert Fleming (Luxembourg) (Joint Ventures) Sarl |
Luxembourg | 100 | ||||||
Robert Fleming Investment Trust Limited |
England | 100 | ||||||
J.P. Morgan Chase International Financing Limited |
England | 100 | ||||||
J.P. Morgan Chase Community Development Corporation |
Delaware | 100 | ||||||
J.P. Morgan Chase National Corporate Services, Inc. |
New York | 100 | ||||||
J.P. Morgan Corporate Services Limited |
England | 100 | ||||||
Robert Fleming Holdings Inc. |
Delaware | 100 | ||||||
J.P. Morgan Equity Holdings, Inc. |
Delaware | 100 | ||||||
CBD Holdings Ltd. |
Delaware | 100 | ||||||
Chase Life & Annuity Co. |
Ohio | 100 | ||||||
Chase Life & Annuity Company of New York |
New York | 100 | ||||||
Great Lakes Insurance Company |
Delaware | 100 | ||||||
CMC Holding Delaware Inc. |
Delaware | 100 | ||||||
A.S. Holding Corporation |
Delaware | 100 | ||||||
Chase Manhattan Bank USA, National Association |
United States | 100 | ||||||
Card Acquisition Funding LLC |
Delaware | 100 | ||||||
Chase BankCard Services, Inc. |
Delaware | 100 | ||||||
Chase Data Services Corporation |
Delaware | 100 | ||||||
149
| Percentage | ||||||||
| of voting | ||||||||
| securities | ||||||||
| owned by | ||||||||
| Organized under the | immediate | |||||||
| Name | laws of | parent | ||||||
Chase Insurance Agency, Inc. |
Delaware | 100 | ||||||
Cross Country Insurance Company |
Vermont | 100 | ||||||
First USA Services, Inc. |
Delaware | 100 | ||||||
First USA Management Services, Inc. |
Delaware | 100 | ||||||
J.P. Morgan Investor Services Co. |
Delaware | 100 | ||||||
Chase Re Limited |
Bermuda | 100 | ||||||
J.P. Morgan Personal Wealth Management, Inc. |
Delaware | 100 | ||||||
J.P. Morgan Trust Company of Delaware |
Delaware | 100 | ||||||
J.P. Morgan Trust Company, National Association |
United States | 100 | ||||||
Texas Commerce Shareholders Company |
Texas | 100 | ||||||
J.P. Morgan Fleming Asset Management Holdings Inc. |
Delaware | 100 | ||||||
J.P. Morgan Fleming Asset Management (Asia) Inc. |
Delaware | 100 | ||||||
J.P. Morgan Fleming Asset Management (Japan) Limited |
Japan | 100 | ||||||
J.P. Morgan Fleming Taiwan Limited |
Taiwan | 100 | ||||||
JF Asset Management International Limited |
British Virgin Islands | 100 | ||||||
JF Asset Management Limited |
Hong Kong | 100 | ||||||
JF Funds Limited |
Hong Kong | 100 | ||||||
JF Asset Management (Taiwan) Limited |
Taiwan | 99.9 | ||||||
J.P. Morgan Fleming Asset Management (Canada) Inc. |
Canada | 100 | ||||||
J.P. Morgan Fleming Asset Management International Limited |
England | 100 | ||||||
Robert Fleming Asset Management Limited |
England | 100 | ||||||
Robert Fleming (Luxembourg) Sarl |
Luxembourg | 100 | ||||||
J.P. Morgan Fleming Asset Management (Europe) S.a.r.l |
Luxembourg | 100 | ||||||
J.P. Morgan Fleming Asset Management France SAS |
France | 100 | ||||||
J.P. Morgan Fleming Societa di Gestione del Risparmio S.p.A. |
Italy | 100 | ||||||
Chase Fleming Luxembourg Holding S.A. |
Luxembourg | 100 | ||||||
Fleming Flagship Advisory Company Sarl |
Luxembourg | 100 | ||||||
JPMorgan Fleming srl |
Italy | 100 | ||||||
J.P. Morgan Fleming Asset Management (UK) Limited |
England | 100 | ||||||
J.P. Morgan Fleming Life Limited |
England | 100 | ||||||
J.P. Morgan Fleming Marketing Limited |
England | 100 | ||||||
Save & Prosper Insurance Limited |
England | 100 | ||||||
Save & Prosper Pensions Limited |
England | 100 | ||||||
Save & Prosper International Insurance Limited |
Bermuda | 100 | ||||||
J.P. Morgan Investment Management Limited |
England | 100 | ||||||
J.P. Morgan Fleming Asset Management (London) Limited |
England | 100 | ||||||
J.P. Morgan Investment Management Inc. |
Delaware | 100 | ||||||
J.P. Morgan Funding Corp. |
England | 100 | ||||||
J.P. Morgan Futures Inc. |
Delaware | 100 | ||||||
J.P. Morgan GT Corporation |
Delaware | 100 | ||||||
J.P. Morgan International Holdings Corp. |
Delaware | 100 | ||||||
J.P. Morgan Trust Company (Bahamas) Limited |
Bahamas | 100 | ||||||
J.P. Morgan Trust Company (Cayman) Limited |
Cayman Islands, BWI | 100 | ||||||
JPMAC Holdings Inc. |
Delaware | 100 | ||||||
J.P. Morgan Invest Inc. |
Delaware | 100 | ||||||
J.P. Morgan Invest, LLC |
Delaware | 100 | ||||||
J.P. Morgan Retirement Plan Services LLC |
Delaware | 100 | ||||||
J.P. Morgan Private Investments Inc. |
Delaware | 100 | ||||||
J.P. Morgan Services Inc. |
Delaware | 100 | ||||||
J.P. Morgan Ventures Corporation |
Delaware | 100 | ||||||
DNT Asset Trust |
Delaware | 100 | ||||||
Ventures Business Trust |
Delaware | 100 | ||||||
JPMP Capital Corp. |
New York | 100 | ||||||
J.P. Morgan Partners, LLC |
Delaware | 100 | ||||||
JPMP Capital, LLC |
Delaware | 100 | ||||||
LabMorgan International Ltd. |
Cayman Islands, BWI | 100 | ||||||
J.P. Morgan Capital Bahamas Limited |
Bahamas | 100 | ||||||
J.P. Morgan Capital, L.P. |
Delaware | 100 | ||||||
J.P. Morgan SBIC Holdings LLC |
Delaware | 100 | ||||||
150
| Percentage | ||||||||
| of voting | ||||||||
| securities | ||||||||
| owned by | ||||||||
| Organized under the | immediate | |||||||
| Name | laws of | parent | ||||||
JPMCC Luxembourg Corporation |
Luxembourg | 100 | ||||||
J.P. Morgan Capital Luxembourg S.a.r.l. |
Luxembourg | 100 | ||||||
JPMCC Belgium S.P.R.L. |
Belgium | 100 | ||||||
JPMCC Belgium (SCA) |
Belgium | 100 | ||||||
J.P. Morgan Partnership Capital Corporation |
Delaware | 100 | ||||||
J.P. Morgan Partnership Investment Corporation |
Delaware | 100 | ||||||
Peabody Real Estate Partnership Corporation |
Delaware | 100 | ||||||
JPMorgan Chase Bank, Dearborn |
Michigan | 100 | ||||||
JPMorgan Chase Bank, National Association |
United States | 100 | ||||||
Anexsys Holdings, Inc. |
Delaware | 100 | ||||||
Anexsys, LLC |
Illinois | 64 | (a) | |||||
BOILL IHC, Inc. |
Nevada | 100 | ||||||
BONA Capital I, LLC |
Delaware | 100 | ||||||
BONA Capital II, LLC |
Delaware | 100 | ||||||
BOTAC, Inc. |
Nevada | 100 | ||||||
Banc One Acceptance Corporation |
Ohio | 100 | ||||||
Banc One Arizona Leasing Corporation |
Arizona | 100 | ||||||
Banc One Building Corporation |
Illinois | 100 | ||||||
Banc One Community Development Corporation |
Delaware | 100 | ||||||
Banc One Equipment Finance, Inc. |
Indiana | 100 | ||||||
Banc One Investment Advisors Corporation |
Ohio | 100 | ||||||
Security Capital Research & Management Incorporated |
Delaware | 100 | ||||||
Banc One Kentucky Vehicle Leasing Company |
Kentucky | 100 | ||||||
Banc One POS Services Corporation |
Ohio | 100 | ||||||
Banc One Payment Services, LLC |
Delaware | 74.83 | ||||||
BOPS Holdings, LLC |
Delaware | 99 | ||||||
Paymentech, L.P. |
Delaware | 100 | ||||||
Paymentech Salem Services, LLC |
Delaware | 100 | ||||||
FDC Offer Corporation |
Delaware | 54.8 | ||||||
Paymentech, Inc. |
Delaware | 100 | ||||||
Paymentech Management Resources, Inc. |
Delaware | 100 | ||||||
Paymentech Employee Resources, LLC |
Delaware | 100 | ||||||
Banc One Private Mortgage Insurance Company, Inc. |
Maine | 100 | ||||||
Banc One Real Estate Investment Corp. |
Delaware | 100 | ||||||
Bank One Auto Securitization LLC |
Delaware | 100 | ||||||
Bank One Equity Investors — BIDCO, Inc. |
Louisiana | 100 | ||||||
Bank One International Corporation |
United States | 100 | ||||||
CSL Leasing Inc. |
Delaware | 100 | ||||||
Cedar Hill International Corp. |
Delaware | 100 | ||||||
Chase Access Services Corporation |
Delaware | 100 | ||||||
Chase Bankruptcy Information Systems, Inc. |
Delaware | 100 | ||||||
Chase Community Development Corporation |
Delaware | 100 | ||||||
Chase Education Holdings, Inc. |
Delaware | 100 | ||||||
Chase Equipment Leasing, Inc. |
Ohio | 100 | ||||||
Chase Funding Corporation |
Delaware | 100 | ||||||
Chase Manhattan Automotive Finance Corporation |
Delaware | 100 | ||||||
Chase Manhattan Mortgage Corporation |
New Jersey | 100 | ||||||
Chase Ventures Holdings, Inc. |
New Jersey | 100 | ||||||
The Home Loan Group, LP |
California | 50 | ||||||
Chase Merchant Ventures, Inc. |
Delaware | 100 | ||||||
Chase Mortgage Holdings, Inc. |
Delaware | 100 | ||||||
Chase Preferred Capital Corporation |
Delaware | 100 | ||||||
CPCC Delaware Statutory Trust |
Delaware | 100 | ||||||
CPCC Massachusetts Business Trust |
Massachusetts | 100 | ||||||
CPCC Texas Limited Partnership |
Texas | 100 | ||||||
Chem Network Processing Services, Inc. |
New Jersey | 100 | ||||||
Colson Services Corp. |
Delaware | 100 | ||||||
FC Energy Finance I, Inc. |
Delaware | 100 | ||||||
FC Energy Finance II, Inc. |
Delaware | 100 | ||||||
151
| Percentage | ||||||||
| of voting | ||||||||
| securities | ||||||||
| owned by | ||||||||
| Organized under the | immediate | |||||||
| Name | laws of | parent | ||||||
FNBC Leasing Corporation |
Delaware | 100 | ||||||
Genesis Holding Corporation |
Delaware | 100 | ||||||
Liberty Payment Services, Inc. |
Kentucky | 100 | ||||||
Manufacturers Hanover Leasing International Corp. |
Delaware | 100 | ||||||
Chase Leasing of Texas, Inc. |
Delaware | 100 | ||||||
Naugatuck Holding Corp. |
Delaware | 100 | ||||||
Overseas Realty Corp. |
New York | 100 | ||||||
South Cutler Corporation |
Delaware | 100 | ||||||
Harvest Opportunity Holdings Corp. |
New York | 100 | ||||||
Independence Park Building Inc. |
Delaware | 100 | ||||||
J.P. Morgan Alternative Asset Management, Inc. |
Delaware | 100 | ||||||
J.P. Morgan Chase Custody Services, Inc. |
Delaware | 100 | ||||||
J.P. Morgan Electronic Financial Services, Inc. |
New York | 100 | ||||||
J.P. Morgan FCS Corporation |
Texas | 100 | ||||||
J.P. Morgan International Inc. |
United States | 100 | ||||||
Bank One International Holdings Corporation |
United States | 100 | ||||||
Bank One Europe Limited |
England | 100 | ||||||
J.P. Morgan International Finance Limited |
United States | 100 | ||||||
Norchem Holdings e Negocios S.A. |
Brazil | 78.24 | ||||||
Robert Fleming Equity (Bermuda) Limited |
Bermuda | 100 | ||||||
Willard Holdings, Inc. |
Delaware | 100 | ||||||
Woodward Holdings, Inc. |
Delaware | 100 | ||||||
BOL (C) II, Inc. |
Delaware | 100 | ||||||
BOL Canada II Sub, Inc. |
Delaware | 100 | ||||||
BOL Canada II Trust |
Delaware | 100 | ||||||
BO Leasing II ULC |
Canada | 100 | ||||||
BOL Canada I, Inc. |
Delaware | 100 | ||||||
BOL Canada I Sub, Inc. |
Delaware | 100 | ||||||
BO Leasing I ULC |
Canada | 100 | ||||||
BOL Canada III, Inc. |
Delaware | 100 | ||||||
BOL Canada III Sub, Inc. |
Delaware | 100 | ||||||
BO Leasing III ULC |
Canada | 100 | ||||||
Banco J.P. Morgan S.A. |
Brazil | 99.69 | (b) | |||||
J.P. Morgan Corretora de Cambio e Valores Mobiliarios S.A. |
Brazil | 100 | ||||||
J.P. Morgan S.A. Distribuidora de Titulos e Valores Mobiliarios |
Brazil | 100 | ||||||
Dearborn Merchant Services, Inc. |
Canada | 100 | ||||||
Paymentech Canada |
Canada | 100 | ||||||
J.P. Morgan Bank International LLC |
Russian Federation | 100 | ||||||
J.P. Morgan Beteiligungs-und Verwaltungsgesellschaft M6H |
Germany | 100 | ||||||
J.P. Morgan AG |
Germany | 100 | ||||||
J.P. Morgan Fonds Services GmbH |
Germany | 100 | ||||||
J.P. Morgan International Holdings Limited |
Cayman Islands, BWI | 100 | ||||||
J.P. Morgan India Securities Holdings Limited |
Mauritius | 100 | ||||||
J.P. Morgan Services India Private Limited |
India | 100 | ||||||
J.P. Morgan Indonesia Holdings (B.V.I.) Limited |
British Virgin Islands | 100 | ||||||
J.P. Morgan Securities (Taiwan) Limited |
Taiwan | 74.95 | (c) | |||||
J.P. Morgan Securities Holdings (Bermuda) Limited |
Bermuda | 100 | ||||||
J.P. Morgan Securities Singapore Private Limited |
Singapore | 100 | ||||||
Jadeling Malaysia Holdings Limited |
British Virgin Islands | 100 | ||||||
NorChem Participacoes e Consultoria S.A. |
Brazil | 50 | ||||||
Bedford Holdings, Inc. |
Delaware | 100 | ||||||
Chase Manhattan Holdings Limitada |
Brazil | 99.99 | ||||||
Inversiones Y Asesorias Chase Manhattan Limitada |
Chile | 99.94 | ||||||
J.P. Morgan & Cie S.A. |
France | 100 | ||||||
J.P. Morgan (Suisse) SA |
Switzerland | 100 | ||||||
J.P. Morgan Bank (Ireland) plc |
Republic of Ireland | 100 | ||||||
J.P. Morgan Bank Luxembourg S.A. |
Luxembourg | 100 | ||||||
J.P. Morgan Bank, S.A. |
Spain | 100 | ||||||
J.P. Morgan Capital Holdings Limited |
England | 99.99 | ||||||
J.P. Morgan Chase (UK) Holdings Limited |
England | 100 | ||||||
152
| Percentage | ||||||||
| of voting | ||||||||
| securities | ||||||||
| owned by | ||||||||
| Organized under the | immediate | |||||||
| Name | laws of | parent | ||||||
J.P. Morgan Chase International Holdings Limited |
England | 100 | ||||||
Crosby Sterling (Holdings) Limited |
England | 100 | ||||||
J.P. Morgan EU Holdings Limited |
England | 100 | ||||||
J.P. Morgan (SC) Limited |
England | 100 | ||||||
J.P. Morgan Equities Limited |
South Africa | 100 | ||||||
J.P. Morgan Europe Limited |
England | 100 | ||||||
J.P. Morgan Markets LLP |
England | 100 | ||||||
J.P. Morgan Securities Ltd. |
England | 100 | ||||||
Robert Fleming (Overseas) Number 2 Limited |
England | 100 | ||||||
J.P. Morgan plc |
England | 100 | ||||||
J.P. Morgan Trustee and Depositary |
England | 100 | ||||||
J.P. Morgan Luxembourg International S.a.r.l. |
Luxembourg | 99.9 | ||||||
J.P. Morgan Cayman Limited |
Cayman Islands, BWI | 100 | ||||||
J.P. Morgan Chase Bank Berhad |
Malaysia | 100 | ||||||
J.P. Morgan Chile Limitada |
Chile | 100 | ||||||
J.P. Morgan Funding South East Asia Private Limited |
Singapore | 100 | ||||||
J.P. Morgan Grupo Financiero S.A. De C.V. |
Mexico | 100 | ||||||
Banco J.P. Morgan S.A., Institucion de Banca Multiple, J.P. Morgan Grupo Financiro |
Mexico | 100 | ||||||
J.P. Morgan Holdings (Hong Kong) Limited |
Hong Kong | 100 | ||||||
Copthall Mauritius Investment Limited |
Mauritius | 100 | ||||||
J.P. Morgan Futures (Korea) Limited |
South Korea | 100 | ||||||
J.P. Morgan Securities (Far East) Limited |
Hong Kong | 100 | ||||||
J.P. Morgan Broking (Hong Kong) Limited |
Hong Kong | 100 | ||||||
J.P. Morgan International Derivatives Ltd. |
Channel Islands | 100 | ||||||
J.P. Morgan Investimentos e Financas Ltda. |
Brazil | 100 | ||||||
J.P. Morgan Malaysia Ltd. |
Malaysia | 100 | ||||||
J.P. Morgan Overseas Capital Corporation |
Delaware | 100 | ||||||
J.P. Morgan Australia Group Pty Limited |
Australia | 100 | ||||||
J.P. Morgan Operations Australia Limited |
Australia | 100 | ||||||
J.P. Morgan Administrative Services Australia Limited |
Australia | 100 | ||||||
J.P. Morgan Australia Limited |
New South Wales | 100 | ||||||
J.P. Morgan Financial Services New Zealand Limited |
Australia | 100 | ||||||
J.P. Morgan Institutional Services Australia Limited |
Australia | 100 | ||||||
J.P. Morgan Nominees Australia Limited |
Australia | 100 | ||||||
J.P. Morgan Portfolio Services Limited |
Australia | 100 | ||||||
J.P. Morgan Trust Australia Limited |
Australia | 100 | ||||||
JFOM Pty Limited |
Australia | 100 | ||||||
J.P. Morgan Markets Australia Pty Limited |
Australia | 100 | ||||||
J.P. Morgan Espana S.A. |
Spain | 100 | ||||||
J.P. Morgan Gestion, Sociedad Gestora de Instituciones de Inversion Colectiva, S.A. |
Spain | 100 | ||||||
J.P. Morgan Sociedad de Valores, S.A. |
Spain | 79 | (d) | |||||
J.P. Morgan International Bank Limited |
England | 100 | ||||||
J.P. Morgan Securities Canada Inc. |
Canada | 100 | ||||||
J.P. Morgan Whitefriars Inc. |
Delaware | 100 | ||||||
J.P. Morgan Whitefriars (UK) |
England | 100 | ||||||
PT J.P. Morgan Securities Indonesia |
Indonesia | 42.75 | (e) | |||||
J.P. Morgan Partners (CMB Reg K GP), Inc. |
Delaware | 100 | ||||||
J.P. Morgan Securities (C.I.) Limited |
Channel Islands | 100 | ||||||
J.P. Morgan (Jersey) Limited |
Channel Islands | 100 | ||||||
J.P. Morgan Securities Asia Private Limited |
Singapore | 100 | ||||||
J.P. Morgan Securities Holdings (Hong Kong) Limited |
Hong Kong | 100 | ||||||
J.P. Morgan Investment Holdings II (Mauritius) Limited |
Mauritius | 67 | ||||||
J.P. Morgan Securities (Asia Pacific) Limited |
Hong Kong | 100 | ||||||
J.P. Morgan Securities Holdings (Caymans) Limited |
Cayman Islands, BWI | 100 | ||||||
J.P. Morgan Securities India Private Limited |
India | 100 | ||||||
J.P. Morgan Securities South Africa (Proprietary) Limited |
South Africa | 100 | ||||||
J.P. Morgan Services Asia Holdings Limited |
Mauritius | 100 | ||||||
J.P. Morgan Services India Private Limited |
India | 100 | ||||||
153
| Percentage | ||||||||
| of voting | ||||||||
| securities | ||||||||
| owned by | ||||||||
| Organized under the | immediate | |||||||
| Name | laws of | parent | ||||||
J.P. Morgan Services Japan Ltd. |
Delaware | 100 | ||||||
J.P. Morgan Trust Bank Ltd. |
Japan | 100 | ||||||
J.P. Morgan Trust Company (Jersey) Limited |
Channel Islands | 100 | ||||||
J.P. Morgan Leasing Inc. |
New York | 100 | ||||||
J.P. Morgan Mortgage Acquisition Corp |
Delaware | 100 | ||||||
J.P. Morgan Mortgage Capital Inc. |
Delaware | 100 | ||||||
J.P. Morgan Partners (23A SBIC Manager), Inc. |
Delaware | 100 | ||||||
J.P. Morgan Partners (23A SBIC), L.P. |
Delaware | 100 | ||||||
J.P. Morgan Property Exchange Inc. |
Delaware | 100 | ||||||
J.P. Morgan Treasury Technologies Corporation |
Delaware | 100 | ||||||
JPMorgan Securities Holdings LLC |
Delaware | 100 | ||||||
J.P. Morgan Institutional Investments Inc. |
Delaware | 100 | ||||||
J.P. Morgan Securities Inc. |
Delaware | 100 | ||||||
LabMorgan Corporation |
Delaware | 100 | ||||||
LabMorgan Investment Corporation |
Delaware | 100 | ||||||
MorServ, Inc. |
Delaware | 100 | ||||||
NBD Community Development Corporation |
Michigan | 100 | ||||||
Offshore Equities, Inc. |
New York | 100 | ||||||
One Group Dealer Services, Inc. |
Delaware | 100 | ||||||
One Group Administrative Services, Inc. |
Delaware | 100 | ||||||
One Mezzanine Capital Corporation |
Delaware | 100 | ||||||
Park Assurance Company |
Vermont | 100 | ||||||
Sterling Assurance Company |
Vermont | 100 | ||||||
Support Development Corporation |
Delaware | 100 | ||||||
| (a) | Anexsys Holding of Missouri owns 36%. |
|
| (b) | Chase Manhattan Holdings Limitada owns 0.31%. |
|
| (c) | JF Securities Limited owns 10%, and Robert Fleming Investment Trust Limited owns 10%. |
|
| (d) | J.P. Morgan & Cie S.A. owns 19% and J.P. Morgan Securities Ltd. owns 2%. |
|
| (e) | J.P. Morgan Indonesia Holdings (B.V.I.) Limited owns 42.5%, and J.P. Morgan Securities Asia
Private Limited owns 13.75%. |
154
Exhibit 23.1
Consent of independent registered public accounting firm
333-117785, 333-117785-04 and 333-117785-05) and in the Registration Statements on Form S-8 (Nos. 33-01776, 33-13457, 33-40272, 33-40675, 33-45017, 33-45018, 33-49909, 33-49911, 33-49913, 33-54547, 33-62453, 33-63833, 333-02073, 333-07941, 333-15281, 333-22451, 333-31634, 333-31656, 333-31666, 333-47350, 333-64476, 333-73119, 333-92217, 333-92737 and 333-112967) of JPMorgan Chase & Co. or affiliates of our report dated February 22, 2005 relating to the financial statements, management’s assessment of the effectiveness of internal control over financial reporting and the effectiveness of internal control over financial reporting, which appears on page 83 of this Form 10-K.
155
Exhibit 31.1
JPMorgan Chase & Co.
CERTIFICATION
I, William B. Harrison, Jr., certify that:
| 1. | I have reviewed this annual report on Form 10-K of JPMorgan Chase & Co.; |
|||
| 2. | Based on my knowledge, this report does not contain any untrue statement of a material fact
or omit to state a material fact necessary to make the
statements made, in light of the circumstances under which such statements were made, not
misleading with respect to the period covered by this
report; |
|||
| 3. | Based on my knowledge, the Consolidated financial statements, and other financial information
included in this report, fairly present in all material
respects the financial condition, results of operations and cash flows of the registrant as of,
and for, the periods presented in this report; |
|||
| 4. | The registrant’s other certifying officer(s) and I are responsible for establishing and
maintaining disclosure controls and procedures (as defined in
Exchange Act Rules 13a-15(e) and 15d-15(e)) and internal control over financial reporting (as
defined in Exchange Act Rules 13a-15(f) and 15d-15(f))
for the registrant and have: |
|||
| a) | Designed such disclosure controls and procedures, or caused such disclosure controls and
procedures to be designed under our supervision, to
ensure that material information relating to the registrant, including its consolidated
subsidiaries, is made known to us by others within those
entities, particularly during the period in which this report is being prepared; |
|||
| b) | Designed such internal controls over financial reporting, or caused such internal
controls over financial reporting to be designed under our super
vision, to provide reasonable assurance regarding the reliability of financial reporting and
the preparation of financial statements for external purposes in accordance with generally accepted accounting principles; |
|||
| c) | Evaluated the effectiveness of the registrant’s disclosure controls and procedures and
presented in this report our conclusions about the effectiveness of the disclosure controls and procedures, as of the end of the period covered by this
report based on such evaluation; and |
|||
| d) | Disclosed in this report any change in the registrant’s internal control over financial
reporting that occurred during the registrant’s most recent fiscal quarter (the registrant’s fourth quarter in the case of an annual report) that has
materially affected, or is reasonably likely to materially affect,
the registrant’s internal control over financial reporting; and |
|||
| 5. | The registrant’s other certifying officer(s) and I have disclosed, based on our most recent
evaluation of internal control over financial reporting, to the
registrant’s auditors and the audit committee of the registrant’s board of directors (or persons
performing the equivalent function): |
| a) | All significant deficiencies and material weaknesses in the design or operation of
internal control over financial reporting which are reasonably
likely to adversely affect the registrant’s ability to record, process, summarize and report
financial information; and |
|||
| b) | Any fraud, whether or not material, that involves management or other employees who have
a significant role in the registrant’s internal control
over financial reporting. |
|||
Chairman and Chief Executive Officer
| 156 |
Exhibit 31.2
JPMorgan Chase & Co.
CERTIFICATION
I, James Dimon, certify that:
| 1. | I have reviewed this annual report on Form 10-K of JPMorgan Chase & Co.; |
|||
| 2. | Based on my knowledge, this report does not contain any untrue statement of a material fact
or omit to state a material fact necessary to make the
statements made, in light of the circumstances under which such statements were made, not
misleading with respect to the period covered by this
report; |
|||
| 3. | Based on my knowledge, the Consolidated financial statements, and other financial information
included in this report, fairly present in all material
respects the financial condition, results of operations and cash flows of the registrant as of,
and for, the periods presented in this report; |
|||
| 4. | The registrant’s other certifying officer(s) and I are responsible for establishing and
maintaining disclosure controls and procedures (as defined in
Exchange Act Rules 13a-15(e) and 15d-15(e)) and internal control over financial reporting (as
defined in Exchange Act Rules 13a-15(f) and 15d-15(f))
for the registrant and have: |
|||
| a) | Designed such disclosure controls and procedures, or caused such disclosure controls and
procedures to be designed under our supervision, to
ensure that material information relating to the registrant, including its consolidated
subsidiaries, is made known to us by others within those
entities, particularly during the period in which this report is being prepared; |
|||
| b) | Designed such internal controls over financial reporting, or caused such internal
controls over financial reporting to be designed under our super
vision, to provide reasonable assurance regarding the reliability of financial reporting and
the preparation of financial statements for external purposes in accordance with generally accepted accounting principles; |
|||
| c) | Evaluated the effectiveness of the registrant’s disclosure controls and procedures and
presented in this report our conclusions about the effectiveness of the disclosure controls and procedures, as of the end of the period covered by this
report based on such evaluation; and |
|||
| d) | Disclosed in this report any change in the registrant’s internal control over financial
reporting that occurred during the registrant’s most recent fiscal quarter (the registrant’s fourth quarter in the case of an annual report) that has
materially affected, or is reasonably likely to materially affect,
the registrant’s internal control over financial reporting; and |
|||
| 5. | The registrant’s other certifying officer(s) and I have disclosed, based on our most recent
evaluation of internal control over financial reporting, to the
registrant’s auditors and the audit committee of the registrant’s board of directors (or persons
performing the equivalent function): |
| a) | All significant deficiencies and material weaknesses in the design or operation of
internal control over financial reporting which are reasonably
likely to adversely affect the registrant’s ability to record, process, summarize and report
financial information; and |
|||
| b) | Any fraud, whether or not material, that involves management or other employees who have
a significant role in the registrant’s internal control
over financial reporting. |
|||
President and Chief Operating Officer
| 157 |
Exhibit 31.3
JPMorgan Chase & Co.
CERTIFICATION
I, Michael J. Cavanagh, certify that:
| 1. | I have reviewed this annual report on Form 10-K of JPMorgan Chase & Co.; |
|||
| 2. | Based on my knowledge, this report does not contain any untrue statement of a material fact
or omit to state a material fact necessary to make the
statements made, in light of the circumstances under which such statements were made, not
misleading with respect to the period covered by this
report; |
|||
| 3. | Based on my knowledge, the Consolidated financial statements, and other financial information
included in this report, fairly present in all material
respects the financial condition, results of operations and cash flows of the registrant as of,
and for, the periods presented in this report; |
|||
| 4. | The registrant’s other certifying officer(s) and I are responsible for establishing and
maintaining disclosure controls and procedures (as defined in
Exchange Act Rules 13a-15(e) and 15d-15(e)) and internal control over financial reporting (as
defined in Exchange Act Rules 13a-15(f) and 15d-15(f))
for the registrant and have: |
|||
| a) | Designed such disclosure controls and procedures, or caused such disclosure controls and
procedures to be designed under our supervision, to
ensure that material information relating to the registrant, including its consolidated
subsidiaries, is made known to us by others within those
entities, particularly during the period in which this report is being prepared; |
|||
| b) | Designed such internal controls over financial reporting, or caused such internal
controls over financial reporting to be designed under our super
vision, to provide reasonable assurance regarding the reliability of financial reporting and
the preparation of financial statements for external purposes in accordance with generally accepted accounting principles; |
|||
| c) | Evaluated the effectiveness of the registrant’s disclosure controls and procedures and
presented in this report our conclusions about the effectiveness of the disclosure controls and procedures, as of the end of the period covered by this
report based on such evaluation; and |
|||
| d) | Disclosed in this report any change in the registrant’s internal control over financial
reporting that occurred during the registrant’s most recent fiscal quarter (the registrant’s fourth quarter in the case of an annual report) that has
materially affected, or is reasonably likely to materially affect,
the registrant’s internal control over financial reporting; and |
|||
| 5. | The registrant’s other certifying officer(s) and I have disclosed, based on our most recent
evaluation of internal control over financial reporting, to the
registrant’s auditors and the audit committee of the registrant’s board of directors (or persons
performing the equivalent function): |
| a) | All significant deficiencies and material weaknesses in the design or operation of
internal control over financial reporting which are reasonably
likely to adversely affect the registrant’s ability to record, process, summarize and report
financial information; and |
|||
| b) | Any fraud, whether or not material, that involves management or other employees who have
a significant role in the registrant’s internal control
over financial reporting. |
|||
Executive Vice President and Chief Financial Officer
| 158 |
Exhibit 32
JPMorgan Chase & Co.
CERTIFICATION PURSUANT TO 18 U.S.C. SECTION 1350, AS ADOPTED PURSUANT TO
SECTION 906 OF THE SARBANES-OXLEY ACT OF 2002
In connection with the Annual Report of JPMorgan Chase & Co. on Form 10-K for the period ended December 31, 2004 as filed with the Securities and Exchange Commission on the date hereof (the “Report”), each of the undersigned officers of JPMorgan Chase & Co., certify, pursuant to 18 U.S.C. Section 1350, as adopted pursuant to Section 906 of the Sarbanes-Oxley Act of 2002, that:
| 1. | The Report fully complies with the requirements of Section 13(a) or 15(d) of the Securities
Exchange Act of 1934; and |
|||
| 2. | The information contained in the Report fairly presents, in all material respects, the
financial condition and results of operations of
JPMorgan Chase & Co. |
|||
Date: March 1, 2005
|
By: | /s/ William B. Harrison, Jr. | ||
William B. Harrison, Jr. Chairman and Chief Executive Officer |
||||
Date: March 1, 2005
|
By: | /s/ James Dimon | ||
James Dimon President and Chief Operating Officer |
||||
Date: March 1, 2005
|
By: | /s/ Michael J. Cavanagh | ||
Michael J. Cavanagh Executive Vice President and Chief Financial Officer |
This certification accompanies this Form 10-K and shall not be deemed “filed” for purposes of Section 18 of the Securities Exchange Act of 1934, or otherwise subject to the liability of that Section.
A signed original of this written statement required by Section 906 has been provided to, and will be retained by, JPMorgan Chase & Co. and furnished to the Securities and Exchange Commission or its staff upon request.
| 159 |